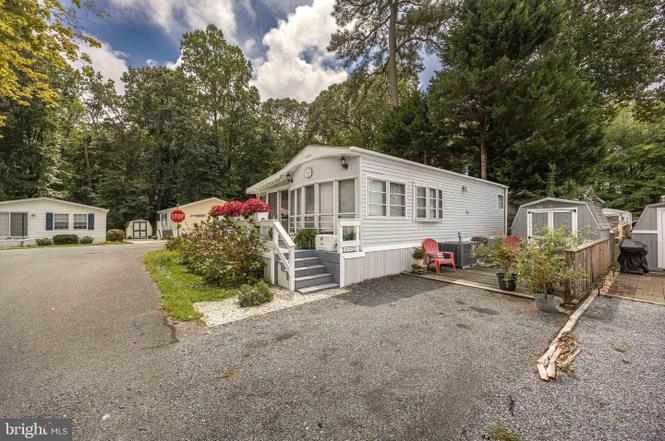
273 Woodhaven Ct · Ocean Pines, MD
Flood risk 1/10 · Minimal
- FEMA flood zone
- X (unshaded)
- Chance of flooding over 30 yrs
- 0.0%
- Est. flood insurance / yr
- $507 – $1,088
Fire risk 1/10 · Minimal
- Est. fire insurance / yr
- $755 – $1,403
Heat risk 8/10 · Major
- Hot days now (above 102°F)
- 7 days/yr
- Hot days in 30 yrs
- 17 days/yr
Wind risk 8/10 · Major
- Chance of severe wind over 30 yrs
- 80.0%
Air-quality risk 2/10 · Minimal
- Unhealthy air days now
- 2 days/yr
- Unhealthy air days in 30 yrs
- 2 days/yr
Risk factors via First Street. Map © Google.
Why this score? — see what drove the C+ grade
The composite is a weighted blend of 9 inputs, each scored 0–100. Each bar is that input's sub-score; the figure is the points it added to the 100-point composite (weight × sub-score).
- Cash flow +25.3/30.0
- DSCR +8.4/10.0
- ARV discount +7.5/15.0
- 1% rule +7.2/10.0
- Livability +3.5/5.0
- Schools +3.3/10.0
- Rent growth +2.5/5.0
- Condition / age +2.5/5.0
- Appreciation +0.0/10.0
$159,900
🖨 Deal sheet 📄 Offer letter ✓ Due diligence
Listing remarks
Discover the charm of coastal living in this beautifully maintained 2-bedroom, 1- bath manufactured home with a spacious addition, perfectly situated on a desirable corner lot in the peaceful White Horse Park community of Ocean Pines, Md. This seasonal retreat offers the ideal escape with serene surroundings and all the comforts of home. Inside, you'll find a bright and generous living area, a well appointed kitchen, and cozy bedrooms. The home comes partially furnished. Recent updates ensure peace of mind. The interior has been renovated within the past 3 years. New flooring throughout, the roof is only 4 years old, brand new HVAC system. White Horse Park offers wonderful amenities, includ
Key facts
- Desirable corner lot
- Recent updates
- Bright living area
Tags
Neighborhood map
What this means for you Summary
Snapshot
- This is a 2-bed/1.0-bath manufactured listed at $160k.
Deal economics
- At list price, monthly cash flow is $366 ($4k/yr) — positive.
- The deal already cash-flows at list — no discount required.
- Meets the 1% rule at list price ($2k rent vs $160k).
- Recommended offer: $155k (3.0% below list) — sets the bar for market timing.
- Cap rate 9.0% vs local median 3.3% in Ocean Pines — top-decile yield for the area; either an underpriced asset or a hidden risk that comps aren't pricing in. Stress-test before assuming the spread holds.
Location & tenants
- Location reads 70/100 on livability (#172 in MD) — a middle-class / working-renter tenant base. Strengths: crime A+, employment A+, housing A+; Watch: schools D, cost of living D, amenities F.
- Worcester County Public Schools (town): math 30% / reading 44% proficiency, ranked #6 of 24 in MD (top 25%) — families likely to look elsewhere, expect single-tenant / working-renter base with shorter leases.
- Market conditions: 315 active listings in the ZIP; solid renter incomes; 354 units permitted in Worcester County in 2024 (6 in 5+ unit buildings).
Forward outlook
- Local home prices are declining (-3.0%/yr); year-one equity from $1k of loan paydown is wiped out by about $5k of value loss. Plan a longer hold.
- Worcester County population projected to shrink 4% by 2050 — rents likely to lag national; underwrite the cash flow, not the appreciation.
Negotiation context
- It's been on market 50 days — a 3% lower offer ($155k) is reasonable based on typical stale-listing flexibility.
- 10 sale attempts since 23y ago with the ask held roughly flat each time — persistent listings suggest the price (not the market) is what's stuck; bring a comps-based counter.
Risks & watch-outs
- Climate carrying-cost: severe wind risk, 80% chance of damaging wind over 30y; extreme-heat days projected 7→17/yr by 2055 (HVAC capex compounding) — expect insurance premiums to compound above CPI over the hold.
Questions for the listing agent
- It's been on market 50 days. Have you received any prior offers? Is the seller open to a 3% concession, seller financing, or rate buy-down credit?
- What does the HOA fee cover, when was the last increase, and are there any pending special assessments or reserve-fund shortfalls?
- Is there a deadline driving the sale (1031 exchange, divorce, estate, relocation)? That informs how much negotiation room exists.
- Schools are D-rated, which usually means shorter tenancies and higher turnover. Who's the typical renter profile here, and what's been the actual vacancy rate?
- What's the average days-on-market for RENTAL listings here right now (not sales)? A rising rental-DOM trend means longer vacancies and softer asking-rent achievability than the comps imply.
- What's the recent tenant-quality profile in this submarket — average credit score on applications, eviction rate, late-payment / NSF rate, and stable-employment percentage? A property-management company in the area should have these aggregated.
- How much new for-sale + rental construction is in the pipeline within 1–3 miles? Heavy new supply typically softens prices + rents 12–24 months out; constrained supply supports both.
Investment metrics
- 1% rule
- 1.22% ✓
- Cap rate
- 9.04%
- Cash-on-cash
- 9.80%
- DSCR
- 1.44
- GRM
- 6.8
CMA / ARV
No comps found within radius.
Projected returns pro-forma
-3.0% appreciation · 3.0% rent growth · sell at horizon
- IRR
- -1.5%
- Equity multiple
- 0.94×
- Total profit
- $-2,548
- Equity at exit
- $23,842
- IRR
- 8.2%
- Equity multiple
- 1.63×
- Total profit
- $28,072
- Equity at exit
- $13,825
Cash invested: $44,772 (down + closing). Projections, not guarantees.
Landlord ↔ Tenant lean methodology
- Overall (STATE)
- 27 Tenant-Leaning
- State Maryland
- 27 Tenant-Leaning · D+14
- County
- — inherits STATE
- City
- — inherits STATE
ZIP-level market 21811
- Home prices YoY
- -29.0%
- Active inventory
- 315
- Price-to-rent
- 6.8×
Monthly cashflow live
- Estimated rent
- $1,956 medium interval (Pro) →
- Mortgage (P&I)
- −$839
- Tax from tax record
- −$94 /mo · $1,131/yr
- Insurance
- −$67
- HOA
- −$180
- Vacancy / Maint / Mgmt
- −$411
- Net cashflow
- $366
Break-even live
UW: 25.0% down · 7.5% · 30yr · 1.5% tax · 5.0% vac · 8.0% maint · 8.0% mgmt
Financing live
Cash to close
- Down payment
- $39,975
- Closing costs
- $4,797
- Reserves months
- —
- Total cash needed
- —
Loan-product check · same deal, 3 products live
Conventional
25% down · 7.5% · 30yr
- Down + closing
- —
- Monthly P&I
- —
- Monthly cashflow
- —
- DSCR
- —
- Eligible?
- —
Personal DTI + credit; lowest rate.
DSCR
20% down · 8.5% · 30yr
- Down + closing
- —
- Monthly P&I
- —
- Monthly cashflow
- —
- DSCR
- —
- Eligible?
- —
No personal income docs; deal must DSCR.
Hard money
10% down · 12.0% · 12mo
- Down + closing
- —
- Monthly P&I
- —
- Monthly cashflow
- —
- DSCR
- —
- Eligible?
- —
Short-term bridge; refi at stabilization.
HOA detail
- Monthly dues
- $180 · $2,160/yr
Listing history 36 events
-
2026-03-29status Pending
-
2026-02-07$159,900 Active
-
2026-01-12historical
-
2025-10-08price $160,000
-
2025-09-18price $164,999
-
2025-08-23$169,999 Active
-
2025-08-22historical
-
2025-08-15historical
-
2025-05-15price $194,900
-
2025-03-01$215,000 Active
-
2024-12-27historical
-
2024-09-03$215,000 Active
-
2024-04-11soldstatus $160,000
-
2024-04-08soldstatus $160,000 Closed
-
2024-03-02status Pending
-
2023-11-29price $179,900
-
2023-11-07price $199,900
-
2023-11-01$219,900 Active
-
2023-11-01historical $219,900
-
2021-07-27soldstatus $104,000
-
2021-07-20soldstatus $104,000 Closed
-
2021-07-03historical Active Under Contract
-
2021-06-25status Active
-
2021-06-18historical Active Under Contract
-
2021-06-14price $114,000
-
2021-05-19$119,000 Active
-
2006-09-06historical
-
2006-05-22$159,900
-
2004-04-13soldstatus $95,000
-
2004-04-13soldstatus $95,000
-
2003-12-03$95,000
-
2003-04-15soldstatus $87,000
-
2003-04-11soldstatus $87,000
-
2003-02-01$88,500
-
2000-11-28soldstatus $58,500
-
1986-03-27soldstatus $17,500
ⓘ Source: listings_history table (triggers on properties + properties_extension) + one-shot
backfill from property_details.listing_events for pre-trigger history.
Tax reassessment forecast MD · Partial reset (capped growth)
- Current annual tax
- $1,131 · $94/mo
- Projected year-2 tax
- $1,437 · $120/mo
- Expected delta
- +$306/yr (+$26/mo · 27.1%)
ⓘ Screening estimate from a state-policy table — verify with the county assessor before closing.
Climate risk First Street
- Flood 1/10 Low FEMA zone X (unshaded) · 0% chance over 30 yrs
- Wildfire 1/10 Low
- Heat 8/10 Severe 7 d/yr ≥102°F today · 17 d/yr by 30 yrs out
- Wind 8/10 Severe 80% chance of damaging wind over 30 yrs
- Air quality 2/10 Low 2 unhealthy d/yr today · 2 by 30 yrs out
Nearby sold comps map
Loading sold comps map…
Walkable amenities ~0.75 mi
Loading nearby amenities…
Taxation est. · year 1
- Rental income
- $23,468
- − Mortgage interest
- −$8,957
- − Property taxes
- −$1,131
- − Insurance
- −$800
- − Repairs & maintenance
- −$1,877
- − Management
- −$1,877
- − HOA
- −$2,160
- − Depreciation
- −$4,652
- Taxable income
- $2,015
- Est. tax owed @ 24.0%
- −$484
- After-tax cash flow
- $3,904/yr
For passive investors: Depreciation is non-cash, so a rental often shows a tax loss while cash-flowing — sheltering income. Rental losses are passive: they offset passive income freely, and up to $25,000/yr can offset ordinary (W-2) income if you actively participate and your MAGI is under $100k (phasing out to $0 by $150k); unused losses carry forward. On sale, claimed depreciation is recaptured at up to 25%, and gains may owe capital-gains tax (a 1031 exchange can defer both). Figures are a year-1 estimate at your 24.0% rate — not tax advice; consult a CPA.
Schools (NCES district)
- District
- Worcester County Public Schools
- NCES district ID
- 2400720
- Math proficiency
- 30% ▼ -25.00%
- Reading proficiency
- 44% ▼ -20.00%
- Median HH income
- $56,748
- Composite
- 32.6/100
- National rank
- #5672
- State rank
- #6 of 24 in MD
Livability — Ocean Pines
- Score
- 70/100
- State rank
- #172
- US rank
- #7691
Category grades
Schools grade is shown separately in the Schools card above.
Census & demographics
- Census place
- Ocean Pines, MD
- County
- Worcester County · 35,603 people
- Metro
- Salisbury, MD-DE
- Population (ZIP)
- 24,377
- Household income
- $90,082
- Rent vs Own
- Severe rent burden
- 551.0
Population outlook (Worcester County) Hauer SSP2
- Today (2025)
- 51,363 people
- By 2030
- 51,191 · -0.3%
- By 2040
- 50,459 · -1.8%
- By 2050
- 49,451 · -3.7%
- By 2075
- 48,533 · -5.5%
- By 2100
- 44,223 · -13.9%
Race, ethnicity, and origin ACS 2023
- Neighborhood character
- Predominantly White (82%)
- Race & ethnicity
- White 82% Black 9% Two or more races 5% Hispanic / Latino 3% Asian 2%
- Common ancestry
- Romanian 4% Italian 2% Lithuanian 2%
- Foreign-born
- 5% · Canada, China
- Languages at home
- 94% English-only · Spanish 2% Other Indo-European 1% French/Haitian/Cajun 1%
Political lean MEDSL · Worcester
- 2024 margin
- Strong R (+22.0) · D 38.0% · R 60.0% · Other 2.0%
- 2008→2024 swing
- -6.5pp toward R · 2008: -15.5pp · 2024: -22.0pp
- All cycles
- 2024: R+22.0 2020: R+19.0 2016: R+27.9 2012: R+18.3 2008: R+15.5
Not yet ingested
- Civics
- —
Market trends
- HPI YoY
- ▼ -119.52%
- Current HPI
- 292.9004
- Rent YoY
- —
- Metro
- Salisbury, MD-DE
- State GDP YoY
- ▲ 2.97%
- F500 in state
- 12
Industry mix (Fortune 500 HQ in MD)
| Industry | F500 HQs | Revenue |
|---|---|---|
| Aerospace / Defense | 1 | $71B |
|
||
| Utilities | 1 | $25B |
|
||
| Hotels | 1 | $24B |
|
||
| Consumer Goods | 1 | $7B |
|
||
| Real Estate | 1 | $6B |
|
||
| Chemicals | 1 | $2B |
|
||
Price history
+813.7% since first listed36 events — show timeline
- 2026-03-29 Pending — BRIGHT MLS
- 2026-02-07 Listed $159,900 BRIGHT MLS
- 2026-01-12 Listing Removed — BRIGHT MLS
- 2025-10-08 Price Changed $160,000 BRIGHT MLS
- 2025-09-18 Price Changed $164,999 BRIGHT MLS
- 2025-08-23 Listed $169,999 BRIGHT MLS
- 2025-08-22 Coming Soon — BRIGHT MLS
- 2025-08-15 Listing Removed — BRIGHT MLS
- 2025-05-15 Price Changed $194,900 BRIGHT MLS
- 2025-03-01 Listed $215,000 BRIGHT MLS
- 2024-12-27 Listing Removed — BRIGHT MLS
- 2024-09-03 Listed $215,000 BRIGHT MLS
- 2024-04-11 Sold (Public Records) $160,000 Public Records
- 2024-04-08 Sold (MLS) $160,000 BRIGHT MLS
- 2024-03-02 Pending — BRIGHT MLS
- 2023-11-29 Price Changed $179,900 BRIGHT MLS
- 2023-11-07 Price Changed $199,900 BRIGHT MLS
- 2023-11-01 Listed $219,900 BRIGHT MLS
- 2023-11-01 Coming Soon $219,900 BRIGHT MLS
- 2021-07-27 Sold (Public Records) $104,000 Public Records
- 2021-07-20 Sold (MLS) $104,000 BRIGHT MLS
- 2021-07-03 Contingent — BRIGHT MLS
- 2021-06-25 Relisted — BRIGHT MLS
- 2021-06-18 Contingent — BRIGHT MLS
- 2021-06-14 Price Changed $114,000 BRIGHT MLS
- 2021-05-19 Listed $119,000 BRIGHT MLS
- 2006-09-06 Listing Removed — BRIGHT MLS
- 2006-05-22 Listed $159,900 BRIGHT MLS
- 2004-04-13 Sold (Public Records) $95,000 Public Records
- 2004-04-13 Sold (MLS) $95,000 BRIGHT MLS
- 2003-12-03 Listed $95,000 BRIGHT MLS
- 2003-04-15 Sold (Public Records) $87,000 Public Records
- 2003-04-11 Sold (MLS) $87,000 BRIGHT MLS
- 2003-02-01 Listed $88,500 BRIGHT MLS
- 2000-11-28 Sold (Public Records) $58,500 Public Records
- 1986-03-27 Sold (Public Records) $17,500 Public Records
Property tax history
+0.8%/yrLatest (2025): $1,131 · +11.0% YoY. Source: county tax records.
Cash-flow waterfall
monthlySold comps — $/sqft
last 12 mo · ≤1 miLoading sold comps…