 🏷️ Likely Rental
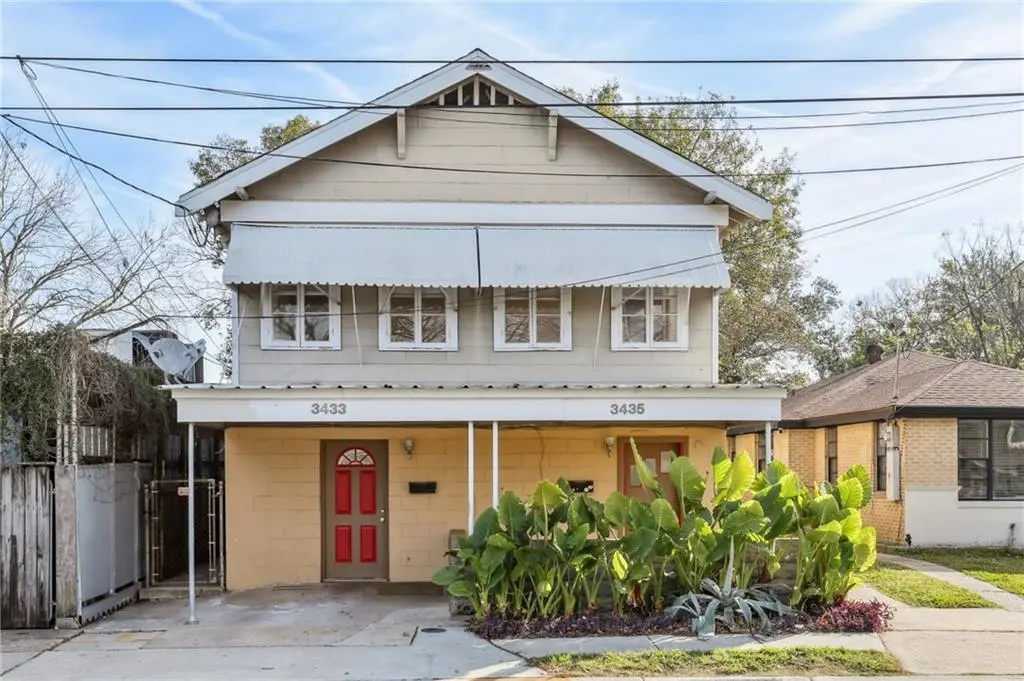
3433-35 Paris Ave · New Orleans, LA
Flood risk 8/10 · Major
- FEMA flood zone
- X
- Chance of flooding over 30 yrs
- 0.6%
- Est. flood insurance / yr
- $507 – $1,088
Fire risk 1/10 · Minimal
- Est. fire insurance / yr
- $1,269 – $2,357
Heat risk 10/10 · Severe
- Hot days now (above 108°F)
- 7 days/yr
- Hot days in 30 yrs
- 21 days/yr
Wind risk 10/10 · Severe
- Chance of severe wind over 30 yrs
- 99.0%
Air-quality risk 4/10 · Minor
- Unhealthy air days now
- 4 days/yr
- Unhealthy air days in 30 yrs
- 4 days/yr
Risk factors via First Street. Map © Google.
Why this score? — see what drove the B+ grade
The composite is a weighted blend of 9 inputs, each scored 0–100. Each bar is that input's sub-score; the figure is the points it added to the 100-point composite (weight × sub-score).
- Cash flow +30.0/30.0
- ARV discount +15.0/15.0
- 1% rule +10.0/10.0
- DSCR +10.0/10.0
- Livability +4.0/5.0
- Condition / age +2.5/5.0
- Rent growth +2.3/5.0
- Schools +1.6/10.0
- Appreciation +0.0/10.0
$245,000
🖨 Deal sheet 📄 Offer letter ✓ Due diligence
Multi-family units
County records classify this as Multi-Family (2-4 Unit). Listing-text estimate: 1 unit. estimate disagrees with records
Listing remarks MLS
Discover this bright and welcoming double on Paris Avenue! Each spacious 4 bedroom unit features low maintenance tile and laminate floors. Each side has large eat-in kitchens and its own in-unit laundry. The property also offers a shaded, fenced yard and one off-street parking space. Excellent location only a five minute drive from City Park, the Fairgrounds, and Dillard University. Easy interstate access will make your commute a breeze! One side has tenants in place at $1600 per month. Ideal for investors or any homebuyer who wants to live in one side and have the other help pay your note!
Key facts
- In-unit laundry
- Shaded fenced yard
- Parking
Tags
Neighborhood map
What this means for you Summary
Snapshot
- This is a 7-bed/2.5-bath multifamily listed at $245k.
Deal economics
- At list price, monthly cash flow is $1k ($17k/yr) — positive.
- The deal already cash-flows at list — no discount required.
- Meets the 1% rule at list price ($4k rent vs $245k).
- Recommended offer: $216k (12.0% below list) — sets the bar for market timing.
- Cap rate 13.7% vs local median 4.4% in New Orleans — top-decile yield for the area; either an underpriced asset or a hidden risk that comps aren't pricing in. Stress-test before assuming the spread holds.
Location & tenants
- Location reads 81/100 on livability (#3 in LA, #1,383 nationally) — a professional / high-income tenant draw. Strengths: amenities A+, commute A+, health & safety A+; Watch: crime C-, employment D.
- Orleans Parish (urban): math 11% / reading 27% proficiency, ranked #69 of 98 in LA (top 70%) — low school quality limits family demand, transient renter base, plan for 1-2y turnover; 68% free/reduced lunch — lower-income household profile, screen leases tightly.
- Market conditions: Rents soft (-0.6%/yr); 332 active listings in the ZIP; 710 units permitted in Orleans Parish in 2024 (244 in 5+ unit buildings).
- At $3,883/mo this rent would consume 94% of the median local household income ($49k/yr) (locally 2150% of renters already pay >50% of income on rent) — very limited rent-growth headroom before tenants either downsize or default.
Forward outlook
- Local home prices are declining (-3.0%/yr); year-one equity from $2k of loan paydown is wiped out by about $7k of value loss. Plan a longer hold.
- Orleans County population projected at +61% by 2050 — long-run rental-demand tailwind backs the buy-and-hold thesis.
- At projected returns (-3.0% appreciation + 0.0% rent growth), your $69k cash investment doubles in ~6 years — after that, you're playing with house money.
Negotiation context
- It's been on market 139 days — a 12% lower offer ($216k) is reasonable based on typical stale-listing flexibility.
- 12 sale attempts since 29y ago; this cycle's ask has dropped $20k (8%) from the opening price — seller is motivated, your offer sets the floor, not the list.
Risks & watch-outs
- Watch-outs: flood insurance adds $66/mo; built in 1959 — expect roof / HVAC / electrical / plumbing capex.
- Climate carrying-cost: severe flood risk; severe wind risk, 99% chance of damaging wind over 30y; extreme-heat days projected 7→21/yr by 2055 (HVAC capex compounding) — expect insurance premiums to compound above CPI over the hold.
Questions for the listing agent
- It's been on market 139 days. Have you received any prior offers? Is the seller open to a 12% concession, seller financing, or rate buy-down credit?
- Built in 1959 — when were the roof, HVAC, electrical panel, plumbing, and water heater last replaced?
- What's the actual annual flood-insurance premium (NFIP or private), and is the property in a SFHA with mandatory coverage?
- Why hasn't it sold? Are there any deal-killer items the seller is aware of (foundation, flood, title, zoning, code violations)?
- Is there a deadline driving the sale (1031 exchange, divorce, estate, relocation)? That informs how much negotiation room exists.
- What's the average days-on-market for RENTAL listings here right now (not sales)? A rising rental-DOM trend means longer vacancies and softer asking-rent achievability than the comps imply.
- What's the recent tenant-quality profile in this submarket — average credit score on applications, eviction rate, late-payment / NSF rate, and stable-employment percentage? A property-management company in the area should have these aggregated.
- How much new apartment / multifamily construction is in the pipeline within 1–3 miles? Heavy new supply (>2% of stock underway) typically softens rents 12–24 months out; light construction supports rent growth.
Investment metrics
- 1% rule
- 1.58% ✓
- Cap rate
- 13.67%
- Cash-on-cash
- 26.33%
- DSCR
- 2.17
- GRM
- 5.3
CMA / ARV
- ARV (median comp)
- $323,681
- List price
- $245,000
- Delta
- -24.31%
- Verdict
- UNDERPRICED
- Comps
- 20 within 1.0 mi
Show comp detail 12 sales within ~0.75 mi
| Address | Dist | Beds/Ba | Sqft | Sold | Price | $/sf | Match |
|---|---|---|---|---|---|---|---|
| 3521 Gibson St | 0.16mi | 6/4.0 (-1) | 2,619 (-1%) | 11mo | $410,000 | $157 | 71 |
| 3923 25 Roneagle Way | 0.62mi | 6/4.0 (-1) | 2,684 (+2%) | 1mo | $265,000 | $99 | 56 |
| 3738-40 Bruxelles St | 0.22mi | 6/5.0 (-1) | 2,910 (+10%) | 2mo | $532,000 | $183 | 56 |
| 2878 Annette St | 0.66mi | 8/4.0 (+1) | 2,653 (+0%) | 4mo | $290,000 | $109 | 54 |
| 1902 04 Agriculture St | 0.60mi | 6/3.0 (-1) | 2,524 (-4%) | 5mo | $102,000 | $40 | 54 |
| 1222-1224 St Denis St | 0.58mi | 6/4.0 (-1) | 2,576 (-2%) | 7mo | $424,000 | $165 | 52 |
| 2303 05 Abundance St | 0.42mi | 6/4.0 (-1) | 2,596 (-2%) | 21mo | $399,000 | $154 | 50 |
| 1525 27 Lafreniere St | 0.40mi | 6/4.0 (-1) | 2,474 (-6%) | 15mo | $423,000 | $171 | 47 |
| 3014-16 Allen St | 0.50mi | 8/4.0 (+1) | 2,448 (-7%) | 17mo | $85,000 | $35 | 39 |
| 4210 Alfred St | 0.66mi | 7/4.0 | 2,275 (-14%) | 5mo | $355,000 | $156 | 36 |
| 3012 Castiglione St | 0.50mi | 6/3.0 (-1) | 3,000 (+14%) | 14mo | $165,000 | $55 | 35 |
| 2883-85 Annette St | 0.67mi | 6/4.0 (-1) | 3,035 (+15%) | 17mo | $215,000 | $71 | 19 |
Match score weights: distance 35% · size 25% · config 20% · recency 20%. Top-matched comps best support the ARV.
Projected returns pro-forma
-3.0% appreciation · 0.0% rent growth · sell at horizon
- IRR
- 15.3%
- Equity multiple
- 1.59×
- Total profit
- $40,577
- Equity at exit
- $36,530
- IRR
- 21.7%
- Equity multiple
- 2.60×
- Total profit
- $109,433
- Equity at exit
- $21,183
Cash invested: $68,600 (down + closing). Projections, not guarantees.
Landlord ↔ Tenant lean methodology
- Overall (STATE)
- 90 Strongly Landlord-Friendly
- State Louisiana
- 90 Strongly Landlord-Friendly · R+12
- County
- — inherits STATE
- City
- — inherits STATE
ZIP-level market 70122
- Rents YoY
- -0.6%
- Active inventory
- 332
- Price-to-rent
- 10.5×
Monthly cashflow live
- Estimated rent
- $3,883 high interval (Pro) →
- Mortgage (P&I)
- −$1,285
- Tax from tax record
- −$175 /mo · $2,105/yr
- Insurance
- −$102
- Flood insurance flood zone
- −$66 /mo · $798/yr
- HOA
- −$0
- Vacancy / Maint / Mgmt
- −$815
- Net cashflow
- $1,439
Break-even live
2-unit breakdown (identical units grouped — click to expand)
| Units | Beds | Baths | Est. rent |
|---|---|---|---|
| 2× units | 4 | 1 | $3,882 |
| #1 | 4 | 1 | $1,941 |
| #2 | 4 | 1 | $1,941 |
| Total (2 units) | $3,883 | ||
UW: 25.0% down · 7.5% · 30yr · 1.5% tax · 5.0% vac · 8.0% maint · 8.0% mgmt
Financing live
Cash to close
- Down payment
- $61,250
- Closing costs
- $7,350
- Reserves months
- —
- Total cash needed
- —
Loan-product check · same deal, 3 products live
Conventional
25% down · 7.5% · 30yr
- Down + closing
- —
- Monthly P&I
- —
- Monthly cashflow
- —
- DSCR
- —
- Eligible?
- —
Personal DTI + credit; lowest rate.
DSCR
20% down · 8.5% · 30yr
- Down + closing
- —
- Monthly P&I
- —
- Monthly cashflow
- —
- DSCR
- —
- Eligible?
- —
No personal income docs; deal must DSCR.
Hard money
10% down · 12.0% · 12mo
- Down + closing
- —
- Monthly P&I
- —
- Monthly cashflow
- —
- DSCR
- —
- Eligible?
- —
Short-term bridge; refi at stabilization.
Listing history 33 events
-
2026-06-13statusdays on market $245,000 Pending 139 DOM
-
2026-06-10days on market $245,000 Active 138 DOM
-
2026-06-09days on market $245,000 Active 137 DOM
-
2026-06-08days on market $245,000 Active 136 DOM
-
2026-06-07days on market $245,000 Active 135 DOM
-
2026-06-05pricedays on market $245,000 Active 132 DOM
-
2026-06-03days on market $255,000 Active 131 DOM
-
2026-06-02days on market $255,000 Active 130 DOM
-
2026-06-01days on market $255,000 Active 129 DOM
-
2026-05-31days on market $255,000 Active 128 DOM
-
2026-03-27price $255,000 597-char remark
Show marketing remark (597 chars)
Discover this bright and welcoming double on Paris Avenue! Each spacious 4 bedroom unit features low maintenance tile and laminate floors. Each side has large eat-in kitchens and its own in-unit laundry. The property also offers a shaded, fenced yard and one off-street parking space. Excellent location only a five minute drive from City Park, the Fairgrounds, and Dillard University. Easy interstate access will make your commute a breeze! One side has tenants in place at $1600 per month. Ideal for investors or any homebuyer who wants to live in one side and have the other help pay your note!
-
2026-01-23$265,000 Active 597-char remark
Show marketing remark (597 chars)
Discover this bright and welcoming double on Paris Avenue! Each spacious 4 bedroom unit features low maintenance tile and laminate floors. Each side has large eat-in kitchens and its own in-unit laundry. The property also offers a shaded, fenced yard and one off-street parking space. Excellent location only a five minute drive from City Park, the Fairgrounds, and Dillard University. Easy interstate access will make your commute a breeze! One side has tenants in place at $1600 per month. Ideal for investors or any homebuyer who wants to live in one side and have the other help pay your note!
-
2017-10-12soldstatus $222,800
-
2017-08-29$254,900
-
2017-01-09soldstatus $135,000
-
2016-11-07$150,000
-
2016-10-12historical
-
2016-07-15price $155,000
-
2016-05-16price $160,000
-
2016-04-12$175,000 Active
-
2016-04-12$155,000
-
2012-07-19$155,000
-
2012-07-19$155,000
-
2003-08-22soldstatus $94,000
-
2003-03-13$94,500
-
2003-03-13$94,500
-
1997-12-31soldstatus $61,000
-
1997-12-31soldstatus $61,000
-
1997-10-24$61,000
-
1997-10-24$61,000
-
1978-03-28soldstatus $35,000
ⓘ Source: listings_history table (triggers on properties + properties_extension) + one-shot
backfill from property_details.listing_events for pre-trigger history.
Tax reassessment forecast LA · Resets to sale price
- Current annual tax
- $2,105 · $175/mo
- Projected year-2 tax
- $2,105 · $175/mo
- Expected delta
- $0/yr ($0/mo · 0.0%)
ⓘ Screening estimate from a state-policy table — verify with the county assessor before closing.
Climate risk First Street
- Flood 8/10 Severe FEMA zone X · 60% chance over 30 yrs
- Wildfire 1/10 Low
- Heat 10/10 Extreme 7 d/yr ≥108°F today · 21 d/yr by 30 yrs out
- Wind 10/10 Extreme 99% chance of damaging wind over 30 yrs
- Air quality 4/10 Moderate 4 unhealthy d/yr today · 4 by 30 yrs out
Nearby sold comps map
Loading sold comps map…
Walkable amenities ~0.75 mi
Loading nearby amenities…
Taxation est. · year 1
- Rental income
- $46,596
- − Mortgage interest
- −$13,724
- − Property taxes
- −$2,105
- − Insurance
- −$2,022
- − Repairs & maintenance
- −$3,728
- − Management
- −$3,728
- − Depreciation
- −$7,127
- Taxable income
- $14,162
- Est. tax owed @ 24.0%
- −$3,399
- After-tax cash flow
- $13,867/yr
For passive investors: Depreciation is non-cash, so a rental often shows a tax loss while cash-flowing — sheltering income. Rental losses are passive: they offset passive income freely, and up to $25,000/yr can offset ordinary (W-2) income if you actively participate and your MAGI is under $100k (phasing out to $0 by $150k); unused losses carry forward. On sale, claimed depreciation is recaptured at up to 25%, and gains may owe capital-gains tax (a 1031 exchange can defer both). Figures are a year-1 estimate at your 24.0% rate — not tax advice; consult a CPA.
Schools (NCES district)
- District
- Orleans Parish
- NCES district ID
- 2201170
- Math proficiency
- 11% ▼ -52.00%
- Reading proficiency
- 27% ▼ -46.00%
- Median HH income
- $37,011
- Composite
- 15.78/100
- National rank
- #9271
- State rank
- #69 of 98 in LA
Livability — New Orleans
- Score
- 81/100
- State rank
- #3
- US rank
- #1383
Category grades
Schools grade is shown separately in the Schools card above.
Census & demographics
- Census place
- New Orleans, LA
- County
- Orleans Parish · 338,817 people
- City population
- 338,817
- Metro
- New Orleans-Metairie, LA
- Population (ZIP)
- 35,253
- Household income
- $49,455
- Rent vs Own
- Severe rent burden
- 2150.0
Population outlook (Orleans County) Hauer SSP2
- Today (2025)
- 513,025 people
- By 2030
- 575,781 · +12.2%
- By 2040
- 700,174 · +36.5%
- By 2050
- 826,541 · +61.1%
- By 2075
- 1,123,374 · +119.0%
- By 2100
- 1,355,609 · +164.2%
Race, ethnicity, and origin ACS 2023
- Neighborhood character
- Predominantly Black (69%)
- Race & ethnicity
- Black 69% White 18% Two or more races 7% Hispanic / Latino 6% Asian 1%
- Hispanic origin (detail)
- Mexican 1%
- Common ancestry
- Lithuanian 4% Italian 2% Slovak 1%
- Foreign-born
- 4% · Canada, China
- Languages at home
- 92% English-only · Spanish 5% Chinese 1% French/Haitian/Cajun 1%
Political lean MEDSL · Orleans
- 2024 margin
- Solid D (+67.0) · D 82.2% · R 15.2% · Other 2.7%
- 2008→2024 swing
- +6.7pp toward D · 2008: 60.3pp · 2024: 67.0pp
- All cycles
- 2024: D+67.0 2020: D+68.2 2016: D+66.2 2012: D+62.5 2008: D+60.3
Not yet ingested
- Civics
- —
Market trends
- HPI YoY
- ▼ -222.37%
- Current HPI
- 231.9921
- Rent YoY
- ▼ -0.61%
- Metro
- New Orleans-Metairie, LA
- State GDP YoY
- ▲ 3.29%
- F500 in state
- 10
Industry mix (Fortune 500 HQ in LA)
| Industry | F500 HQs | Revenue |
|---|---|---|
| Telecommunications | 2 | $23B |
|
||
| Utilities | 1 | $12B |
|
||
| Wholesale / Distribution | 1 | $5B |
|
||
| Advertising | 1 | $2B |
|
||
Price history
+628.6% since first listed23 events — show timeline
- 2026-03-27 Price Changed $255,000 AcadianaMLS
- 2026-03-27 Price Changed $255,000 GSREIN
- 2026-01-23 Listed $265,000 GSREIN
- 2026-01-23 Listed $265,000 AcadianaMLS
- 2017-10-12 Sold (Public Records) $222,800 Public Records
- 2017-08-29 Listed $254,900 AcadianaMLS
- 2017-01-09 Sold (Public Records) $135,000 Public Records
- 2016-11-07 Listed $150,000 AcadianaMLS
- 2016-10-12 Listing Removed — GSREIN
- 2016-07-15 Price Changed $155,000 GSREIN
- 2016-05-16 Price Changed $160,000 GSREIN
- 2016-04-12 Listed $175,000 GSREIN
- 2016-04-12 Listed $155,000 AcadianaMLS
- 2012-07-19 Listed $155,000 GSREIN
- 2012-07-19 Listed $155,000 AcadianaMLS
- 2003-08-22 Sold (MLS) $94,000 GSREIN
- 2003-03-13 Listed $94,500 AcadianaMLS
- 2003-03-13 Listed $94,500 GSREIN
- 1997-12-31 Sold (Public Records) $61,000 Public Records
- 1997-12-31 Sold (MLS) $61,000 GSREIN
- 1997-10-24 Listed $61,000 GSREIN
- 1997-10-24 Listed $61,000 AcadianaMLS
- 1978-03-28 Sold (Public Records) $35,000 Public Records
Property tax history
+0.8%/yrLatest (2026): $2,105 · +1.1% YoY. Source: county tax records.
Cash-flow waterfall
monthlySold comps — $/sqft
last 12 mo · ≤1 miLoading sold comps…