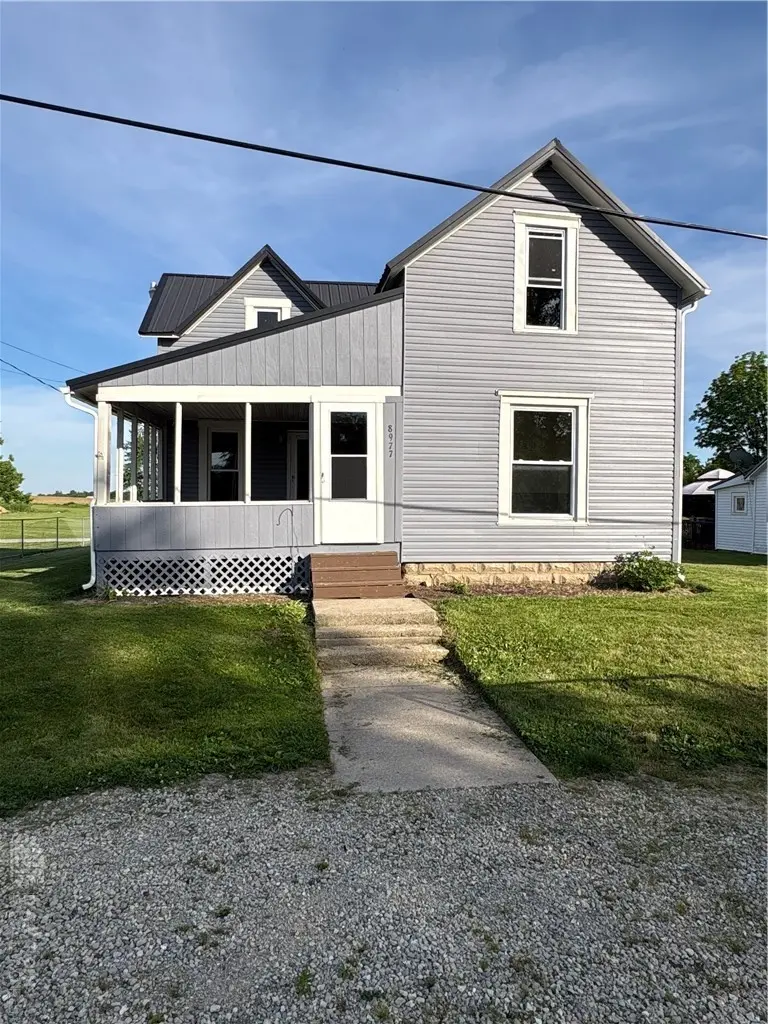
8977 Liberty St · Union City, OH
Flood risk 1/10 · Minimal
- FEMA flood zone
- X (unshaded)
- Chance of flooding over 30 yrs
- 0.0%
- Est. flood insurance / yr
- $473 – $860
Fire risk 1/10 · Minimal
- Est. fire insurance / yr
- $713 – $1,323
Heat risk 3/10 · Minor
- Hot days now (above 100°F)
- 7 days/yr
- Hot days in 30 yrs
- 18 days/yr
Wind risk 2/10 · Minimal
- Chance of severe wind over 30 yrs
- 1.0%
Air-quality risk 3/10 · Minor
- Unhealthy air days now
- 2 days/yr
- Unhealthy air days in 30 yrs
- 3 days/yr
Risk factors via First Street. Map © Google.
Why this score? — see what drove the C+ grade
The composite is a weighted blend of 9 inputs, each scored 0–100. Each bar is that input's sub-score; the figure is the points it added to the 100-point composite (weight × sub-score).
- Cash flow +20.7/30.0
- Appreciation +10.0/10.0
- ARV discount +7.5/15.0
- DSCR +6.6/10.0
- 1% rule +4.5/10.0
- Schools +4.5/10.0
- Livability +3.2/5.0
- Rent growth +2.5/5.0
- Condition / age +2.5/5.0
$129,900
🖨 Deal sheet 📄 Offer letter ✓ Due diligence
Listing remarks MLS
Lots of potential! This 4 bedroom 2 bath home located in Hillgrove is your canvas! Master bedroom with attach full bath located on main floor. Detached garage and enclosed front porch perfect for relaxing! Price reflects condition of home and home is being sold as is. Room sizes are estimates. All information is gathered from seller and Darke County auditors website. Information on this listing is not guaranteed or warranted. Selling Agent Mary E. North is member of North Heritage Development LLC, seller of property.
Key facts
- Open living room
- Front porch
- Water heater
Tags
Property features AI
Finance
- Financial info: Offered for sale
Exterior
- Parking: No garage
- Utilities: Has heating
- Home design: Vinyl siding exterior
- Construction: Vinyl siding construction
- Exterior features: Residential lot of approximately 0.174 acres
Interior
- Bedrooms: 6 total rooms (bedroom count not specified)
- Bathrooms: 2 full bathrooms
- Heating & cooling: Forced air heating
- Interior features: Partial basement
Neighborhood map
What this means for you Summary
Snapshot
- This is a 4-bed/2.0-bath single-family listed at $130k.
Deal economics
- At list price, monthly cash flow is $175 ($2k/yr) — positive.
- The deal already cash-flows at list — no discount required.
- To meet the 1% rule (rent ≥ 1% of price), the offer needs to be $124k (4.6% below list).
- Recommended offer: $124k (4.6% below list) — sets the bar for 1% rule.
Location & tenants
- Location reads 63/100 on livability (#854 in OH) — a middle-class / working-renter tenant base. Strengths: cost of living A+, crime A, housing B; Watch: schools C-, health & safety C-, amenities F.
- Mississinawa Valley Local (rural): math 56% / reading 51% proficiency, ranked #405 of 656 in OH (top 62%) — acceptable for families but not a draw, mixed tenant base, ~2y average lease; 70% free/reduced lunch — lower-income household profile, screen leases tightly.
- Market conditions: 13 active listings in the ZIP; 43 units permitted in Darke County in 2024 (0 in 5+ unit buildings).
- This rent runs 32% of the median local income ($47k/yr) — at the standard rent-burdened threshold; future hikes will face affordability resistance.
Forward outlook
- In year one you build about $14k of equity ($898 loan paydown + $13k appreciation (10.0% local appreciation)).
- Darke County population projected at -20% by 2050 — secular population decline; favor cash flow + early exit over multi-decade hold.
- At projected returns (10.0% appreciation + 3.0% rent growth), your $36k cash investment doubles in ~3 years — after that, you're playing with house money.
- By year 3, paydown + projected appreciation supports a ~$35k cash-out refi (75% LTV) — recoverable capital for the next deal without selling this one.
Negotiation context
- Only 14 days on market — expect competitive offers; lowballing is unlikely to land.
- 4 sale attempts since 11y ago with the ask held roughly flat each time — persistent listings suggest the price (not the market) is what's stuck; bring a comps-based counter.
- Current owner paid $37k; list at $130k implies a 251% gain — meaningful room to come down on a strong offer.
Risks & watch-outs
- Watch-outs: built in 1900 — expect roof / HVAC / electrical / plumbing capex.
Questions for the listing agent
- Built in 1900 — when were the roof, HVAC, electrical panel, plumbing, and water heater last replaced?
- Is there a deadline driving the sale (1031 exchange, divorce, estate, relocation)? That informs how much negotiation room exists.
- What's the average days-on-market for RENTAL listings here right now (not sales)? A rising rental-DOM trend means longer vacancies and softer asking-rent achievability than the comps imply.
- What's the recent tenant-quality profile in this submarket — average credit score on applications, eviction rate, late-payment / NSF rate, and stable-employment percentage? A property-management company in the area should have these aggregated.
- How much new for-sale + rental construction is in the pipeline within 1–3 miles? Heavy new supply typically softens prices + rents 12–24 months out; constrained supply supports both.
Investment metrics
- 1% rule
- 0.95% ✗
- Cap rate
- 7.91%
- Cash-on-cash
- 5.79%
- DSCR
- 1.26
- GRM
- 8.7
CMA / ARV
No comps found within radius.
Projected returns pro-forma
10.0% appreciation · 3.0% rent growth · sell at horizon
- IRR
- 28.5%
- Equity multiple
- 3.25×
- Total profit
- $81,877
- Equity at exit
- $117,024
- IRR
- 24.8%
- Equity multiple
- 7.39×
- Total profit
- $232,253
- Equity at exit
- $252,367
Cash invested: $36,372 (down + closing). Projections, not guarantees.
Landlord ↔ Tenant lean methodology
- Overall (STATE)
- 73 Landlord-Friendly
- State Ohio
- 73 Landlord-Friendly · R+6
- County
- — inherits STATE
- City
- — inherits STATE
ZIP-level market 45390
- Home prices YoY
- 5.1%
- Active inventory
- 13
- Price-to-rent
- 8.7×
Monthly cashflow live
- Estimated rent
- $1,240 medium interval (Pro) →
- Mortgage (P&I)
- −$681
- Tax from tax record
- −$69 /mo · $824/yr
- Insurance
- −$54
- HOA
- −$0
- Vacancy / Maint / Mgmt
- −$260
- Net cashflow
- $175
Break-even live
UW: 25.0% down · 7.5% · 30yr · 1.5% tax · 5.0% vac · 8.0% maint · 8.0% mgmt
Financing live
Cash to close
- Down payment
- $32,475
- Closing costs
- $3,897
- Reserves months
- —
- Total cash needed
- —
Loan-product check · same deal, 3 products live
Conventional
25% down · 7.5% · 30yr
- Down + closing
- —
- Monthly P&I
- —
- Monthly cashflow
- —
- DSCR
- —
- Eligible?
- —
Personal DTI + credit; lowest rate.
DSCR
20% down · 8.5% · 30yr
- Down + closing
- —
- Monthly P&I
- —
- Monthly cashflow
- —
- DSCR
- —
- Eligible?
- —
No personal income docs; deal must DSCR.
Hard money
10% down · 12.0% · 12mo
- Down + closing
- —
- Monthly P&I
- —
- Monthly cashflow
- —
- DSCR
- —
- Eligible?
- —
Short-term bridge; refi at stabilization.
Listing history 12 events
-
2026-06-18days on market $129,900 Active 14 DOM
-
2026-06-17days on market $129,900 Active 13 DOM
-
2026-06-16days on market $129,900 Active 12 DOM
-
2026-06-16price $129,900 Active 11 DOM
-
2026-06-15days on market $134,900 Active 11 DOM
-
2026-06-13days on market $134,900 Active 9 DOM
-
2026-06-12days on market $134,900 Active 8 DOM
-
2026-06-09days on market $134,900 Active 5 DOM
-
2026-06-08days on market $134,900 Active 4 DOM
-
2026-06-08days on market $134,900 Active 3 DOM
-
2026-06-05remarks 682-char remark
-
2026-06-05$134,900 Active 1 DOM
ⓘ Source: listings_history table (triggers on properties + properties_extension) + one-shot
backfill from property_details.listing_events for pre-trigger history.
Tax reassessment forecast OH · Partial reset (capped growth)
- Current annual tax
- $824 · $69/mo
- Projected year-2 tax
- $1,425 · $119/mo
- Expected delta
- +$601/yr (+$50/mo · 73.0%)
ⓘ Screening estimate from a state-policy table — verify with the county assessor before closing.
Climate risk First Street
- Flood 1/10 Low FEMA zone X (unshaded) · 0% chance over 30 yrs
- Wildfire 1/10 Low
- Heat 3/10 Moderate 7 d/yr ≥100°F today · 18 d/yr by 30 yrs out
- Wind 2/10 Low 100% chance of damaging wind over 30 yrs
- Air quality 3/10 Moderate 2 unhealthy d/yr today · 3 by 30 yrs out
Nearby sold comps map
Loading sold comps map…
Walkable amenities ~0.75 mi
Loading nearby amenities…
Taxation est. · year 1
- Rental income
- $14,876
- − Mortgage interest
- −$7,276
- − Property taxes
- −$824
- − Insurance
- −$650
- − Repairs & maintenance
- −$1,190
- − Management
- −$1,190
- − Depreciation
- −$3,779
- Taxable loss
- −$33
- Est. tax savings @ 24.0%
- +$8
- After-tax cash flow
- $2,112/yr
For passive investors: Depreciation is non-cash, so a rental often shows a tax loss while cash-flowing — sheltering income. Rental losses are passive: they offset passive income freely, and up to $25,000/yr can offset ordinary (W-2) income if you actively participate and your MAGI is under $100k (phasing out to $0 by $150k); unused losses carry forward. On sale, claimed depreciation is recaptured at up to 25%, and gains may owe capital-gains tax (a 1031 exchange can defer both). Figures are a year-1 estimate at your 24.0% rate — not tax advice; consult a CPA.
Schools (NCES district)
- District
- Mississinawa Valley Local
- NCES district ID
- 3904667
- Math proficiency
- 56% ▼ -11.00%
- Reading proficiency
- 51% ▼ -13.00%
- Median HH income
- $40,999
- Composite
- 44.86/100
- National rank
- #2727
- State rank
- #405 of 656 in OH
Livability — Union City
- Score
- 63/100
- State rank
- #854
- US rank
- #15985
Category grades
Schools grade is shown separately in the Schools card above.
Census & demographics
- County
- Darke · 50,606 people
- Population (ZIP)
- 3,349
- Household income
- $46,974
- Rent vs Own
- Severe rent burden
- 5.9
Population outlook (Darke County) Hauer SSP2
- Today (2025)
- 49,377 people
- By 2030
- 47,494 · -3.8%
- By 2040
- 43,553 · -11.8%
- By 2050
- 39,320 · -20.4%
- By 2075
- 30,091 · -39.1%
- By 2100
- 21,110 · -57.2%
Race, ethnicity, and origin ACS 2023
- Neighborhood character
- Predominantly White (88%)
- Race & ethnicity
- White 88% Hispanic / Latino 9% Two or more races 6% Asian 2%
- Hispanic origin (detail)
- Mexican 4% Cuban 4%
- Common ancestry
- Iranian 1% Slovak 1%
- Foreign-born
- 2% · Canada, China
- Languages at home
- 96% English-only · Spanish 2% Chinese 2%
Political lean MEDSL · Darke
- 2024 margin
- Solid R (+65.4) · D 17.0% · R 82.3%
- 2008→2024 swing
- -29.2pp toward R · 2008: -36.1pp · 2024: -65.4pp
- All cycles
- 2024: R+65.4 2020: R+63.6 2016: R+61.2 2012: R+44.9 2008: R+36.1
Not yet ingested
- Civics
- —
Market trends
- HPI YoY
- ▲ 13.15%
- Current HPI
- 270.1901
- Rent YoY
- —
- Metro
- —
- State GDP YoY
- ▲ 1.98%
- F500 in state
- 48
Industry mix (Fortune 500 HQ in OH)
| Industry | F500 HQs | Revenue |
|---|---|---|
| Insurance | 3 | $145B |
|
||
| Industrial Machinery | 3 | $49B |
|
||
| Financial Services | 3 | $24B |
|
||
| Consumer Goods | 2 | $93B |
|
||
| Aerospace / Defense | 2 | $47B |
|
||
| Utilities | 2 | $33B |
|
||
Price history
+542.4% since first listed14 events — show timeline
- 2026-06-04 Listed $134,900 Dayton MLS
- 2024-02-09 Sold (MLS) $37,000 Dayton MLS
- 2024-02-09 Sold (MLS) $37,000 Dayton MLS
- 2024-01-12 Pending — Dayton MLS
- 2024-01-12 Listed $25,000 Dayton MLS
- 2016-12-02 Sold (Public Records) $49,900 Public Records
- 2015-11-28 Listing Removed — WRIST
- 2015-11-28 Listing Removed — Dayton MLS
- 2015-06-17 Listed $49,900 WRIST
- 2015-06-17 Listed $49,900 Dayton MLS
- 2004-11-12 Sold (Public Records) $48,000 Public Records
- 2002-08-21 Sold (Public Records) $20,000 Public Records
- 1997-10-23 Sold (Public Records) $22,000 Public Records
- 1995-06-29 Sold (Public Records) $21,000 Public Records
Property tax history
+4.6%/yrLatest (2025): $824 · +0.8% YoY. Source: county tax records.
Cash-flow waterfall
monthlySold comps — $/sqft
last 12 mo · ≤1 miLoading sold comps…