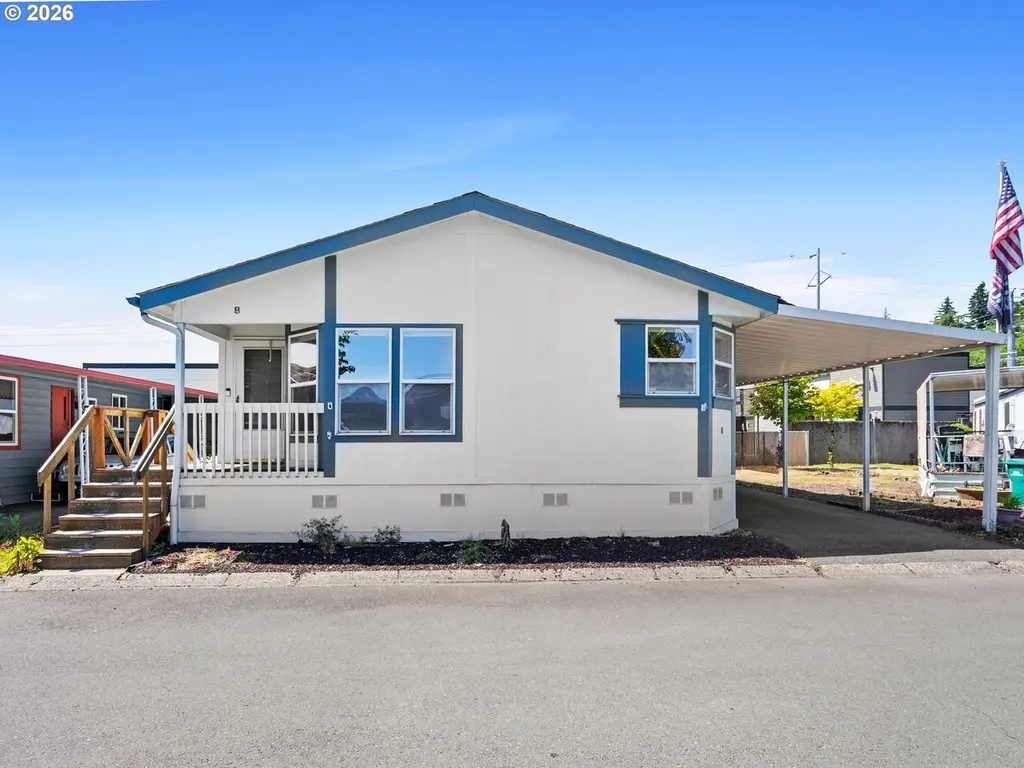
13640 SE Highway 212 #8 · Happy Valley, OR
Flood risk 1/10 · Minimal
- FEMA flood zone
- X (unshaded)
- Chance of flooding over 30 yrs
- 0.0%
- Est. flood insurance / yr
- $507 – $1,088
Fire risk 3/10 · Minor
- Est. fire insurance / yr
- $498 – $926
Heat risk 3/10 · Minor
- Hot days now (above 93°F)
- 7 days/yr
- Hot days in 30 yrs
- 15 days/yr
Wind risk 1/10 · Minimal
- Chance of severe wind over 30 yrs
- —
Air-quality risk 10/10 · Severe
- Unhealthy air days now
- 14 days/yr
- Unhealthy air days in 30 yrs
- 16 days/yr
Risk factors via First Street. Map © Google.
Why this score? — see what drove the B grade
The composite is a weighted blend of 9 inputs, each scored 0–100. Each bar is that input's sub-score; the figure is the points it added to the 100-point composite (weight × sub-score).
- Cash flow +30.0/30.0
- 1% rule +10.0/10.0
- DSCR +10.0/10.0
- ARV discount +7.5/15.0
- Livability +3.8/5.0
- Schools +3.2/10.0
- Rent growth +3.1/5.0
- Condition / age +2.5/5.0
- Appreciation +0.0/10.0
$109,900
🖨 Deal sheet 📄 Offer letter ✓ Due diligence
Listing remarks
Don’t miss out on this beautifully maintained, move-in-ready home built in 2003. Inside, you will find a bright and spacious open layout where the kitchen flows seamlessly into the main living areas, while the back deck provides a quiet outdoor retreat for relaxing or entertaining. As part of this desirable Shadow Brook neighborhood, you will enjoy fantastic community perks including exclusive access to a recreation room, pool, and a quiet place for your daily walk. Combining turn-key convenience with excellent neighborhood amenities and a highly accessible location just minutes away from Fred Meyer, New Seasons, Restaurants and more!
Key facts
- Accessible location
- Recreation room
- Open layout
Tags
Neighborhood map
What this means for you Summary
Snapshot
- This is a 2-bed/1.0-bath other listed at $110k.
Deal economics
- At list price, monthly cash flow is $979 ($12k/yr) — positive.
- The deal already cash-flows at list — no discount required.
- Meets the 1% rule at list price ($2k rent vs $110k).
- Recommended offer: $108k (1.5% below list) — sets the bar for market timing.
- Cap rate 17.0% vs local median 2.5% in Happy Valley — top-decile yield for the area; either an underpriced asset or a hidden risk that comps aren't pricing in. Stress-test before assuming the spread holds.
Location & tenants
- Location reads 76/100 on livability (#76 in OR, #3,386 nationally) — a middle-class / working-renter tenant base. Strengths: employment A+, housing A+, crime A; Watch: amenities F, cost of living F.
- North Clackamas SD 12 (suburban): math 29% / reading 43% proficiency, ranked #22 of 58 in OR (top 38%) — families likely to look elsewhere, expect single-tenant / working-renter base with shorter leases.
- Zoned schools: Verne A Duncan Elementary School (math 8% / reading 34%, grade F, #353 of 412 statewide, top 87%, 407 students, 32% FRL); Happy Valley Middle School (math 41% / reading 56%, grade C-, #29 of 128 statewide, top 22%, 1,021 students, 25% FRL); Clackamas High School (math 52% / reading 67%, grade C+, #23 of 143 statewide, top 19%, 1,224 students, 27% FRL).
- Market conditions: Rents rising (+2.5%/yr); 120 active listings in the ZIP; 9 comparable units currently listed for rent nearby; rentals at typical pace (median 24d on market — plan ~3-4 weeks tenant-placement turnaround); solid renter incomes; 946 units permitted in Clackamas County in 2024 (188 in 5+ unit buildings).
Forward outlook
- Local home prices are declining (-3.0%/yr); year-one equity from $760 of loan paydown is wiped out by about $3k of value loss. Plan a longer hold.
- Clackamas County population projected at +25% by 2050 — long-run rental-demand tailwind backs the buy-and-hold thesis.
- At projected returns (-3.0% appreciation + 2.5% rent growth), your $31k cash investment doubles in ~4 years — after that, you're playing with house money.
Negotiation context
- It's been on market 21 days — a 2% lower offer ($108k) is reasonable based on typical stale-listing flexibility.
Questions for the listing agent
- Is there a deadline driving the sale (1031 exchange, divorce, estate, relocation)? That informs how much negotiation room exists.
- Schools are A-rated — typically a magnet for longer-tenancy family renters. What's the average tenant stay here, and is there a school-zone premium baked into asking?
- What's the average days-on-market for RENTAL listings here right now (not sales)? A rising rental-DOM trend means longer vacancies and softer asking-rent achievability than the comps imply.
- What's the recent tenant-quality profile in this submarket — average credit score on applications, eviction rate, late-payment / NSF rate, and stable-employment percentage? A property-management company in the area should have these aggregated.
- How much new for-sale + rental construction is in the pipeline within 1–3 miles? Heavy new supply typically softens prices + rents 12–24 months out; constrained supply supports both.
Investment metrics
- 1% rule
- 1.96% ✓
- Cap rate
- 16.98%
- Cash-on-cash
- 38.18%
- DSCR
- 2.70
- GRM
- 4.3
CMA / ARV
No comps found within radius.
Projected returns pro-forma
-3.0% appreciation · 2.48% rent growth · sell at horizon
- IRR
- 33.7%
- Equity multiple
- 2.41×
- Total profit
- $43,445
- Equity at exit
- $16,386
- IRR
- 40.3%
- Equity multiple
- 4.69×
- Total profit
- $113,622
- Equity at exit
- $9,502
Cash invested: $30,772 (down + closing). Projections, not guarantees.
Landlord ↔ Tenant lean methodology
- Overall (STATE)
- 28 Tenant-Leaning
- State Oregon
- 28 Tenant-Leaning · D+6
- County
- — inherits STATE
- City
- — inherits STATE
ZIP-level market 97015
- Rents YoY
- 2.5%
- Active inventory
- 120
- Price-to-rent
- 4.3×
Monthly cashflow live
- Estimated rent
- $2,153 high interval (Pro) →
- Mortgage (P&I)
- −$576
- Tax from tax record
- −$100 /mo · $1,199/yr
- Insurance
- −$46
- HOA
- −$0
- Vacancy / Maint / Mgmt
- −$452
- Net cashflow
- $979
Break-even live
UW: 25.0% down · 7.5% · 30yr · 1.5% tax · 5.0% vac · 8.0% maint · 8.0% mgmt
Financing live
Cash to close
- Down payment
- $27,475
- Closing costs
- $3,297
- Reserves months
- —
- Total cash needed
- —
Loan-product check · same deal, 3 products live
Conventional
25% down · 7.5% · 30yr
- Down + closing
- —
- Monthly P&I
- —
- Monthly cashflow
- —
- DSCR
- —
- Eligible?
- —
Personal DTI + credit; lowest rate.
DSCR
20% down · 8.5% · 30yr
- Down + closing
- —
- Monthly P&I
- —
- Monthly cashflow
- —
- DSCR
- —
- Eligible?
- —
No personal income docs; deal must DSCR.
Hard money
10% down · 12.0% · 12mo
- Down + closing
- —
- Monthly P&I
- —
- Monthly cashflow
- —
- DSCR
- —
- Eligible?
- —
Short-term bridge; refi at stabilization.
Rent comps 9 comps
| Address | Beds | Baths | Sqft | Rent | $/sqft | DOM | Units | Dist |
|---|---|---|---|---|---|---|---|---|
| 13300 SE Hubbard Rd Clackamas, OR | 3.0 | 1.0–2.0 | 818 | $1,987 | $2.43 | 2d | 6 | 0.29mi |
| 12301 SE Hubbard Rd Clackamas, OR | 2.0–3.0 | 1.0–2.0 | 936 | $1,523 | $1.63 | 10d | 4 | 0.69mi |
| 13898 SE Rogers Ln Clackamas, OR | 3.0 | 2.0 | 1488 | $2,599 | $1.75 | 43d | 1 | 0.84mi |
| 14439 SE Oregon Trail Dr Clackamas, OR | 3.0 | 2.0 | 1650 | $2,615 | $1.58 | 1d | 1 | 0.95mi |
| 14095 SE Summerfield Loop Happy Valley, OR | 3.0 | 2.5 | 1453 | $2,695 | $1.85 | 43d | 1 | 1.10mi |
| 14712 SE Misty Dr Happy Valley, OR | 2.0 | 1.0–2.0 | 955 | $1,988 | $2.08 | 2d | 13 | 1.21mi |
| 14154 SE Summerfield Loop Unit 14194 Happy Valley, OR | 3.0 | 2.5 | 1125 | $2,250 | $2.00 | 24d | 1 | 1.23mi |
| 14194 SE Summerfield Loop Happy Valley, OR | 3.0 | 2.5 | 1125 | $2,250 | $2.00 | 24d | 1 | 1.23mi |
| 13120 SE 128th Ave Happy Valley, OR | 3.0 | 2.5 | 1861 | $2,900 | $1.56 | 43d | 1 | 1.27mi |
Listing history 9 events
-
2026-06-13statusdays on market $109,900 Pending 21 DOM
-
2026-06-09days on market $109,900 Active 19 DOM
-
2026-06-08days on market $109,900 Active 18 DOM
-
2026-06-07days on market $109,900 Active 17 DOM
-
2026-06-05days on market $109,900 Active 14 DOM
-
2026-06-03days on market $109,900 Active 13 DOM
-
2026-06-02days on market $109,900 Active 12 DOM
-
2026-06-02remarks 643-char remark
-
2026-06-02$109,900 Active 11 DOM
ⓘ Source: listings_history table (triggers on properties + properties_extension) + one-shot
backfill from property_details.listing_events for pre-trigger history.
Tax reassessment forecast OR · Resets to sale price
- Current annual tax
- $1,199 · $100/mo
- Projected year-2 tax
- $1,199 · $100/mo
- Expected delta
- $0/yr ($0/mo · 0.0%)
ⓘ Screening estimate from a state-policy table — verify with the county assessor before closing.
Climate risk First Street
- Flood 1/10 Low FEMA zone X (unshaded) · 0% chance over 30 yrs
- Wildfire 3/10 Moderate
- Heat 3/10 Moderate 7 d/yr ≥93°F today · 15 d/yr by 30 yrs out
- Wind 1/10 Low
- Air quality 10/10 Extreme 14 unhealthy d/yr today · 16 by 30 yrs out
Nearby sold comps map
Loading sold comps map…
Walkable amenities ~0.75 mi
Loading nearby amenities…
Taxation est. · year 1
- Rental income
- $25,841
- − Mortgage interest
- −$6,156
- − Property taxes
- −$1,199
- − Insurance
- −$550
- − Repairs & maintenance
- −$2,067
- − Management
- −$2,067
- − Depreciation
- −$3,197
- Taxable income
- $10,605
- Est. tax owed @ 24.0%
- −$2,545
- After-tax cash flow
- $9,205/yr
For passive investors: Depreciation is non-cash, so a rental often shows a tax loss while cash-flowing — sheltering income. Rental losses are passive: they offset passive income freely, and up to $25,000/yr can offset ordinary (W-2) income if you actively participate and your MAGI is under $100k (phasing out to $0 by $150k); unused losses carry forward. On sale, claimed depreciation is recaptured at up to 25%, and gains may owe capital-gains tax (a 1031 exchange can defer both). Figures are a year-1 estimate at your 24.0% rate — not tax advice; consult a CPA.
Schools (NCES district)
- District
- North Clackamas SD 12
- NCES district ID
- 4108830
- Math proficiency
- 29% ▼ -14.00%
- Reading proficiency
- 43% ▼ -13.00%
- Median HH income
- $60,217
- Composite
- 32.1/100
- National rank
- #5807
- State rank
- #22 of 58 in OR
Livability — Happy Valley
- Score
- 76/100
- State rank
- #76
- US rank
- #3386
Category grades
Schools grade is shown separately in the Schools card above.
Census & demographics
- County
- Clackamas County · 361,406 people
- City population
- 34,567
- Metro
- Portland-Vancouver-Hillsboro, OR-WA
- Population (ZIP)
- 24,433
- Household income
- $87,333
- Rent vs Own
- Severe rent burden
- 1166.0
Population outlook (Clackamas County) Hauer SSP2
- Today (2025)
- 458,456 people
- By 2030
- 485,185 · +5.8%
- By 2040
- 532,932 · +16.2%
- By 2050
- 574,445 · +25.3%
- By 2075
- 665,497 · +45.2%
- By 2100
- 697,488 · +52.1%
Race, ethnicity, and origin ACS 2023
- Neighborhood character
- Predominantly White (66%)
- Race & ethnicity
- White 66% Hispanic / Latino 15% Two or more races 12% Asian 11% Black 2%
- Hispanic origin (detail)
- Mexican 13%
- Common ancestry
- Italian 4% Scotch-Irish 4% Lithuanian 3%
- Foreign-born
- 15% · Canada, China, Vietnam
- Languages at home
- 74% English-only · Spanish 11% Chinese 5% Russian/Polish/Slavic 3%
Political lean MEDSL · Clackamas
- 2024 margin
- Lean D (+9.7) · D 53.4% · R 43.6% · Other 3.0%
- 2008→2024 swing
- -0.6pp no change · 2008: 10.4pp · 2024: 9.7pp
- All cycles
- 2024: D+9.7 2020: D+11.1 2016: D+6.1 2012: D+3.5 2008: D+10.4
Not yet ingested
- Civics
- —
Market trends
- HPI YoY
- ▼ -170.50%
- Current HPI
- 295.7295
- Rent YoY
- ▲ 2.48%
- Metro
- Portland-Vancouver-Hillsboro, OR-WA
- State GDP YoY
- ▲ 2.05%
- F500 in state
- 2
Industry mix (Fortune 500 HQ in OR)
| Industry | F500 HQs | Revenue |
|---|---|---|
| Consumer Goods | 1 | $51B |
|
||
Price history
1 event — show timeline
- 2026-05-21 Listed $109,900 RMLS
Property tax history
+3.8%/yrLatest (2025): $1,199 · +3.7% YoY. Source: county tax records.
Cash-flow waterfall
monthlySold comps — $/sqft
last 12 mo · ≤1 miLoading sold comps…