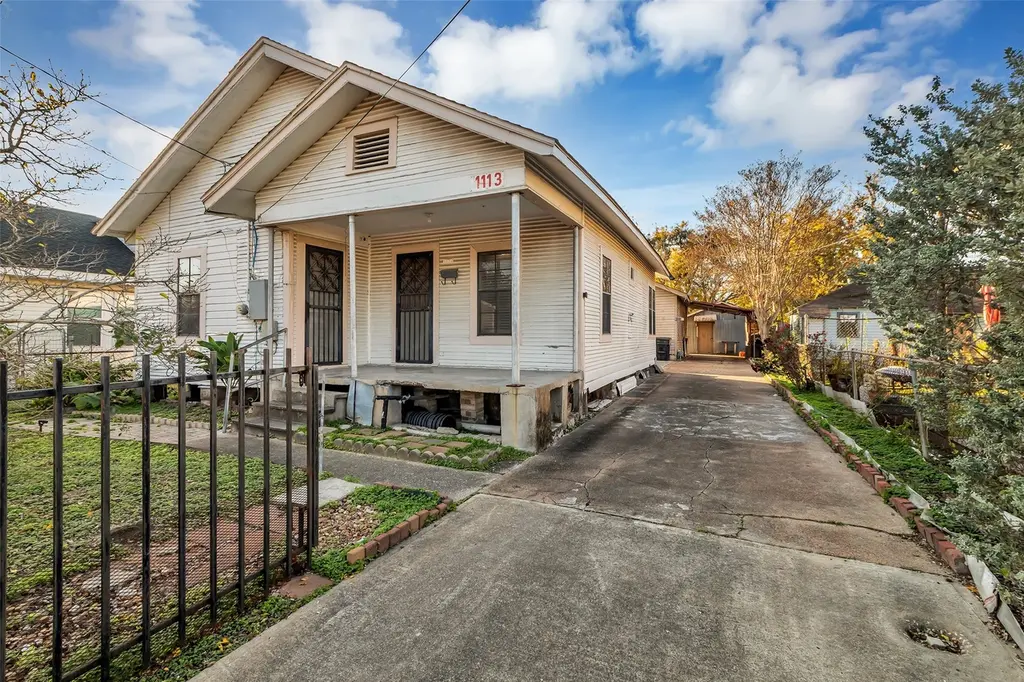
1113 71st St · Houston, TX
Flood risk 3/10 · Minor
- FEMA flood zone
- X (unshaded)
- Chance of flooding over 30 yrs
- 0.12%
- Est. flood insurance / yr
- $507 – $1,088
Fire risk 1/10 · Minimal
- Est. fire insurance / yr
- $1,222 – $2,270
Heat risk 9/10 · Severe
- Hot days now (above 110°F)
- 7 days/yr
- Hot days in 30 yrs
- 24 days/yr
Wind risk 9/10 · Severe
- Chance of severe wind over 30 yrs
- 99.0%
Air-quality risk 2/10 · Minimal
- Unhealthy air days now
- 2 days/yr
- Unhealthy air days in 30 yrs
- 2 days/yr
Risk factors via First Street. Map © Google.
Why this score? — see what drove the D grade
The composite is a weighted blend of 9 inputs, each scored 0–100. Each bar is that input's sub-score; the figure is the points it added to the 100-point composite (weight × sub-score).
- Cash flow +12.6/30.0
- Appreciation +10.0/10.0
- DSCR +3.8/10.0
- Livability +3.7/5.0
- 1% rule +3.6/10.0
- Schools +2.7/10.0
- Condition / age +2.2/5.0
- Rent growth +1.8/5.0
- ARV discount +0.0/15.0
$225,000
🖨 Deal sheet 📄 Offer letter ✓ Due diligence
Listing remarks MLS
Unique opportunity in Houston’s rapidly growing East End! This property features two separate homes on one oversized lot of over 9,000 sq ft, along with a storage building in the rear. The front home has 2-bedrooms and 1-bathroom, and the second home has 2-bedrooms / 1-bathroom. The primary home has been freshly painted, offers a functional layout, and includes updated flooring with plenty of natural light. The second home provides an excellent opportunity for rental income or additional living space, making this property ideal for owner-occupants or investors. The property is fully fenced with a long driveway and ample parking. Situated in an up-and-coming area with new construction nearby, this location offers quick access to Downtown Houston, major highways, the East End District, dining, shopping, and entertainment.
Key facts
- Storage building
- Two separate homes
- Natural light
Tags
Neighborhood map
What this means for you Summary
Snapshot
- This is a 4-bed/2.0-bath single-family listed at $225k. Condition is rated fair.
Deal economics
- At list price, monthly cash flow is $-27 ($-327/yr) — negative.
- To cash-flow at today's rent, offer at most $221k (1.8% below list).
- To meet the 1% rule (rent ≥ 1% of price), the offer needs to be $193k (14.1% below list).
- Recommended offer: $193k (14.1% below list) — sets the bar for 1% rule.
- Cap rate 6.1% vs local median 3.2% in Houston — top-decile yield for the area; either an underpriced asset or a hidden risk that comps aren't pricing in. Stress-test before assuming the spread holds.
Location & tenants
- Location reads 74/100 on livability (#184 in TX, #4,771 nationally) — a middle-class / working-renter tenant base. Strengths: amenities A+, cost of living A+, housing A+; Watch: schools D, crime F.
- Houston ISD (urban): math 27% / reading 35% proficiency, ranked #593 of 826 in TX (top 72%) — families likely to look elsewhere, expect single-tenant / working-renter base with shorter leases; 71% free/reduced lunch — lower-income household profile, screen leases tightly.
- Market conditions: Rents soft (-2.9%/yr); 161 active listings in the ZIP; 5 comparable units currently listed for rent nearby; rentals leasing fast (median 3d on market — plan ~1-2 weeks tenant-placement turnaround); 40% of comp listings sitting > 30 days — soft ceiling on asking rent; 29,883 units permitted in Harris County in 2024 (8,621 in 5+ unit buildings).
- At $1,934/mo this rent would consume 46% of the median local household income ($50k/yr) (locally 655% of renters already pay >50% of income on rent) — very limited rent-growth headroom before tenants either downsize or default.
Forward outlook
- In year one you build about $24k of equity ($2k loan paydown + $22k appreciation (10.0% local appreciation)).
- Harris County population projected at +47% by 2050 — long-run rental-demand tailwind backs the buy-and-hold thesis.
- At projected returns (10.0% appreciation + 0.0% rent growth), your $63k cash investment doubles in ~3 years — after that, you're playing with house money.
- By year 2, paydown + projected appreciation supports a ~$39k cash-out refi (75% LTV) — recoverable capital for the next deal without selling this one.
Negotiation context
- It's been on market 185 days — a 12% lower offer ($198k) is reasonable based on typical stale-listing flexibility.
Risks & watch-outs
- Watch-outs: built in 1936 — expect roof / HVAC / electrical / plumbing capex.
- Climate carrying-cost: severe wind risk, 99% chance of damaging wind over 30y; extreme-heat days projected 7→24/yr by 2055 (HVAC capex compounding) — expect insurance premiums to compound above CPI over the hold.
Questions for the listing agent
- What do current leases actually rent for vs. the listed asking? Can we see a recent rent roll and the last 12 months of T-12 income?
- It's been on market 185 days. Have you received any prior offers? Is the seller open to a 14% concession, seller financing, or rate buy-down credit?
- Have any recent inspections been done? Can we get a copy of the seller's disclosures and any deferred-maintenance estimates?
- Built in 1936 — when were the roof, HVAC, electrical panel, plumbing, and water heater last replaced?
- Why hasn't it sold? Are there any deal-killer items the seller is aware of (foundation, flood, title, zoning, code violations)?
- Is there a deadline driving the sale (1031 exchange, divorce, estate, relocation)? That informs how much negotiation room exists.
- Schools are D-rated, which usually means shorter tenancies and higher turnover. Who's the typical renter profile here, and what's been the actual vacancy rate?
- Crime grade is F in this area — have there been break-ins, vandalism, or insurance claims at this property in the last 3 years? What carrier currently insures it and at what premium?
- The area grade is low — what's the realistic commute time and amenity access for the typical tenant pool here? Any planned neighborhood developments (good or bad) we should know about?
- What's the average days-on-market for RENTAL listings here right now (not sales)? A rising rental-DOM trend means longer vacancies and softer asking-rent achievability than the comps imply.
- What's the recent tenant-quality profile in this submarket — average credit score on applications, eviction rate, late-payment / NSF rate, and stable-employment percentage? A property-management company in the area should have these aggregated.
- How much new for-sale + rental construction is in the pipeline within 1–3 miles? Heavy new supply typically softens prices + rents 12–24 months out; constrained supply supports both.
Investment metrics
- 1% rule
- 0.86% ✗
- Cap rate
- 6.15%
- Cash-on-cash
- -0.52%
- DSCR
- 0.98
- GRM
- 9.7
CMA / ARV
- ARV (median comp)
- $185,677
- List price
- $225,000
- Delta
- 21.18%
- Verdict
- OVERPRICED
- Comps
- 20 within 1.0 mi
Show comp detail 7 sales within ~0.75 mi
| Address | Dist | Beds/Ba | Sqft | Sold | Price | $/sf | Match |
|---|---|---|---|---|---|---|---|
| 7135 Avenue E | 0.33mi | 3/1.0 (-1) | 912 (-1%) | 4mo | $160,000 | $175 | 70 |
| 7043 Avenue L | 0.05mi | 3/2.0 (-1) | 999 (+8%) | 16mo | $168,000 | $168 | 66 |
| 6822 Avenue F | 0.42mi | 4/3.0 | 1,008 (+9%) | 12mo | $182,900 | $181 | 52 |
| 7122 Avenue O | 0.18mi | 3/1.0 (-1) | 842 (-9%) | 23mo | $155,000 | $184 | 49 |
| 6705 Avenue V | 0.73mi | 3/1.0 (-1) | 894 (-3%) | 15mo | $160,000 | $179 | 39 |
| 917 Terminal St | 0.72mi | 3/2.0 (-1) | 1,032 (+12%) | 12mo | $200,000 | $194 | 32 |
| 6619 Avenue Unit Q | 0.67mi | 3/1.0 (-1) | 1,056 (+14%) | 7mo | $135,000 | $128 | 30 |
Match score weights: distance 35% · size 25% · config 20% · recency 20%. Top-matched comps best support the ARV.
Projected returns pro-forma
10.0% appreciation · 0.0% rent growth · sell at horizon
- IRR
- 22.9%
- Equity multiple
- 2.83×
- Total profit
- $115,170
- Equity at exit
- $202,698
- IRR
- 19.8%
- Equity multiple
- 6.24×
- Total profit
- $330,429
- Equity at exit
- $437,126
Cash invested: $63,000 (down + closing). Projections, not guarantees.
Landlord ↔ Tenant lean methodology
- Overall (STATE)
- 87 Strongly Landlord-Friendly
- State Texas
- 87 Strongly Landlord-Friendly · R+5
- County
- — inherits STATE
- City
- — inherits STATE
ZIP-level market 77011
- Home prices YoY
- 30.1%
- Rents YoY
- -2.9%
- Active inventory
- 161
- Price-to-rent
- 9.7×
Monthly cashflow live
- Estimated rent
- $1,934 high interval (Pro) →
- Mortgage (P&I)
- −$1,180
- Tax est. 1.5%
- −$281 /mo · $3,375/yr
- Insurance
- −$94
- HOA
- −$0
- Vacancy / Maint / Mgmt
- −$406
- Net cashflow
- $-27
Break-even live
UW: 25.0% down · 7.5% · 30yr · 1.5% tax · 5.0% vac · 8.0% maint · 8.0% mgmt
Financing live
Cash to close
- Down payment
- $56,250
- Closing costs
- $6,750
- Reserves months
- —
- Total cash needed
- —
Loan-product check · same deal, 3 products live
Conventional
25% down · 7.5% · 30yr
- Down + closing
- —
- Monthly P&I
- —
- Monthly cashflow
- —
- DSCR
- —
- Eligible?
- —
Personal DTI + credit; lowest rate.
DSCR
20% down · 8.5% · 30yr
- Down + closing
- —
- Monthly P&I
- —
- Monthly cashflow
- —
- DSCR
- —
- Eligible?
- —
No personal income docs; deal must DSCR.
Hard money
10% down · 12.0% · 12mo
- Down + closing
- —
- Monthly P&I
- —
- Monthly cashflow
- —
- DSCR
- —
- Eligible?
- —
Short-term bridge; refi at stabilization.
Rent comps 5 comps
| Address | Beds | Baths | Sqft | Rent | $/sqft | DOM | Units | Dist |
|---|---|---|---|---|---|---|---|---|
| 7043 Avenue L Houston, TX | 3.0 | 2.0 | 999 | $1,845 | $1.85 | 44d | 1 | 0.05mi |
| 7250 Avenue C Houston, TX | 1.0–3.0 | 1.0–2.0 | 886 | $1,680 | $1.90 | 1d | 14 | 0.48mi |
| 7310 Sherman St Houston, TX | 1.0–3.0 | 1.0–2.0 | 879 | $1,499 | $1.71 | 2d | 7 | 0.52mi |
| 6403 Avenue C Unit 1019625P Houston, TX | 2.0–8.0 | 1.0–4.0 | 1232 | $4,453 | $3.61 | 3d | 2 | 0.89mi |
| 1016 S Wayside Dr Houston, TX | 3.0 | 2.0 | 1021 | $1,425 | $1.40 | 44d | 1 | 1.31mi |
Listing history 12 events
-
2026-06-18days on market $225,000 Active 185 DOM
-
2026-06-17days on market $225,000 Active 184 DOM
-
2026-06-16days on market $225,000 Active 183 DOM
-
2026-06-15days on market $225,000 Active 182 DOM
-
2026-06-13days on market $225,000 Active 180 DOM
-
2026-06-10days on market $225,000 Active 176 DOM
-
2026-06-08days on market $225,000 Active 175 DOM
-
2026-06-07days on market $225,000 Active 174 DOM
-
2026-06-04days on market $225,000 Active 171 DOM
-
2026-06-01days on market $225,000 Active 168 DOM
-
2026-05-31days on market $225,000 Active 167 DOM
-
2025-12-15$225,000 Active 837-char remark
Show marketing remark (837 chars)
Unique opportunity in Houston’s rapidly growing East End! This property features two separate homes on one oversized lot of over 9,000 sq ft, along with a storage building in the rear. The front home has 2-bedrooms and 1-bathroom, and the second home has 2-bedrooms / 1-bathroom. The primary home has been freshly painted, offers a functional layout, and includes updated flooring with plenty of natural light. The second home provides an excellent opportunity for rental income or additional living space, making this property ideal for owner-occupants or investors. The property is fully fenced with a long driveway and ample parking. Situated in an up-and-coming area with new construction nearby, this location offers quick access to Downtown Houston, major highways, the East End District, dining, shopping, and entertainment.
ⓘ Source: listings_history table (triggers on properties + properties_extension) + one-shot
backfill from property_details.listing_events for pre-trigger history.
Climate risk First Street
- Flood 3/10 Moderate FEMA zone X (unshaded) · 12% chance over 30 yrs
- Wildfire 1/10 Low
- Heat 9/10 Extreme 7 d/yr ≥110°F today · 24 d/yr by 30 yrs out
- Wind 9/10 Extreme 99% chance of damaging wind over 30 yrs
- Air quality 2/10 Low 2 unhealthy d/yr today · 2 by 30 yrs out
Nearby sold comps map
Loading sold comps map…
Walkable amenities ~0.75 mi
Loading nearby amenities…
Taxation est. · year 1
- Rental income
- $23,206
- − Mortgage interest
- −$12,603
- − Property taxes
- −$3,375
- − Insurance
- −$1,125
- − Repairs & maintenance
- −$1,856
- − Management
- −$1,856
- − Depreciation
- −$6,545
- Taxable loss
- −$4,156
- Est. tax savings @ 24.0%
- +$997
- After-tax cash flow
- $671/yr
For passive investors: Depreciation is non-cash, so a rental often shows a tax loss while cash-flowing — sheltering income. Rental losses are passive: they offset passive income freely, and up to $25,000/yr can offset ordinary (W-2) income if you actively participate and your MAGI is under $100k (phasing out to $0 by $150k); unused losses carry forward. On sale, claimed depreciation is recaptured at up to 25%, and gains may owe capital-gains tax (a 1031 exchange can defer both). Figures are a year-1 estimate at your 24.0% rate — not tax advice; consult a CPA.
Condition & rehab AI · 12 photos
This property requires moderate renovations to improve its condition and increase its value. The front home has been freshly painted and offers a functional layout, but the exterior and interior need significant updates.
Repairs flagged
- Major roof — potential water damage
- Major exterior siding — signs of wear and tear
- Major driveway — cracked and uneven
Value-add opportunities
- Resale modern kitchen appliances — attracts more buyers with updated features
- Both landscaping and curb appeal — enhances property's visual appeal and marketability
- Resale modern bathroom fixtures — increases the home's overall appeal and functionality
Renovation cost estimate screening
| Repair item | Severity | Est. cost |
|---|---|---|
| roof · potential water damage | Major | $15,000–50,000 |
| exterior siding · signs of wear and tear | Major | $15,000–50,000 |
| driveway · cracked and uneven | Major | $15,000–50,000 |
| Total estimated repair cost · 3 items | $45,000–150,000 |
Value-add ROI direction
- Resale modern kitchen appliances — attracts more buyers with updated features ↑
- Both landscaping and curb appeal — enhances property's visual appeal and marketability ↑
- Resale modern bathroom fixtures — increases the home's overall appeal and functionality ↑
ⓘ Cost ranges are severity-bucket heuristics (US national rule-of-thumb). Get contractor quotes + a written scope before underwriting a rehab budget.
Schools (NCES district)
- District
- Houston ISD
- NCES district ID
- 4823640
- Math proficiency
- 27% ▼ -18.00%
- Reading proficiency
- 35% ▼ -6.00%
- Median HH income
- $46,054
- Composite
- 26.63/100
- National rank
- #7173
- State rank
- #593 of 826 in TX
Livability — Houston
- Score
- 74/100
- State rank
- #184
- US rank
- #4771
Category grades
Schools grade is shown separately in the Schools card above.
Census & demographics
- Census place
- Houston, TX
- County
- Harris County · 4,702,590 people
- City population
- 3,226,434
- Metro
- Houston-The Woodlands-Sugar Land, TX
- Population (ZIP)
- 14,940
- Household income
- $50,133
- Rent vs Own
- Severe rent burden
- 655.0
Population outlook (Harris County) Hauer SSP2
- Today (2025)
- 5,571,493 people
- By 2030
- 6,089,821 · +9.3%
- By 2040
- 7,142,806 · +28.2%
- By 2050
- 8,185,864 · +46.9%
- By 2075
- 10,574,329 · +89.8%
- By 2100
- 12,109,958 · +117.4%
Race, ethnicity, and origin ACS 2023
- Neighborhood character
- Predominantly Hispanic (88%)
- Race & ethnicity
- Hispanic / Latino 88% Two or more races 29% White 7% Black 3%
- Hispanic origin (detail)
- Mexican 81%
- Foreign-born
- 33% · Canada
- Languages at home
- 24% English-only · Spanish 76%
Political lean MEDSL · Harris
- 2024 margin
- Lean D (+5.5) · D 52.0% · R 46.4% · Other 1.6%
- 2008→2024 swing
- +3.9pp toward D · 2008: 1.6pp · 2024: 5.5pp
- All cycles
- 2024: D+5.5 2020: D+13.3 2016: D+12.4 2012: D+0.1 2008: D+1.6
Not yet ingested
- Civics
- —
Market trends
- HPI YoY
- ▲ 68.18%
- Current HPI
- 295.1198
- Rent YoY
- ▼ -2.93%
- Metro
- Houston-The Woodlands-Sugar Land, TX
- State GDP YoY
- ▲ 3.95%
- F500 in state
- 110
Industry mix (Fortune 500 HQ in TX)
| Industry | F500 HQs | Revenue |
|---|---|---|
| Energy | 16 | $1,198B |
|
||
| Technology | 5 | $198B |
|
||
| Engineering / Construction | 4 | $72B |
|
||
| Energy Services | 3 | $60B |
|
||
| Utilities | 3 | $41B |
|
||
| Healthcare | 2 | $330B |
|
||
Price history
1 event — show timeline
- 2025-12-15 Listed $225,000 HARMLS
Cash-flow waterfall
monthlySold comps — $/sqft
last 12 mo · ≤1 miLoading sold comps…