1640 Woodford Rd · Capitol View, SC
Flood risk 1/10 · Minimal
- FEMA flood zone
- X (unshaded)
- Chance of flooding over 30 yrs
- 0.0%
- Est. flood insurance / yr
- $507 – $1,088
Fire risk 3/10 · Minor
- Est. fire insurance / yr
- $783 – $1,453
Heat risk 6/10 · Moderate
- Hot days now (above 108°F)
- 7 days/yr
- Hot days in 30 yrs
- 16 days/yr
Wind risk 7/10 · Major
- Chance of severe wind over 30 yrs
- 75.0%
Air-quality risk 3/10 · Minor
- Unhealthy air days now
- 2 days/yr
- Unhealthy air days in 30 yrs
- 2 days/yr
Risk factors via First Street. Map © Google.
Why this score? — see what drove the D grade
The composite is a weighted blend of 9 inputs, each scored 0–100. Each bar is that input's sub-score; the figure is the points it added to the 100-point composite (weight × sub-score).
- Cash flow +16.1/30.0
- ARV discount +7.5/15.0
- DSCR +5.0/10.0
- 1% rule +4.4/10.0
- Rent growth +3.0/5.0
- Schools +2.6/10.0
- Livability +2.5/5.0
- Condition / age +2.5/5.0
- Appreciation +0.0/10.0
$179,900
🖨 Deal sheet (PDF) 📄 Offer letter ✓ Due diligence
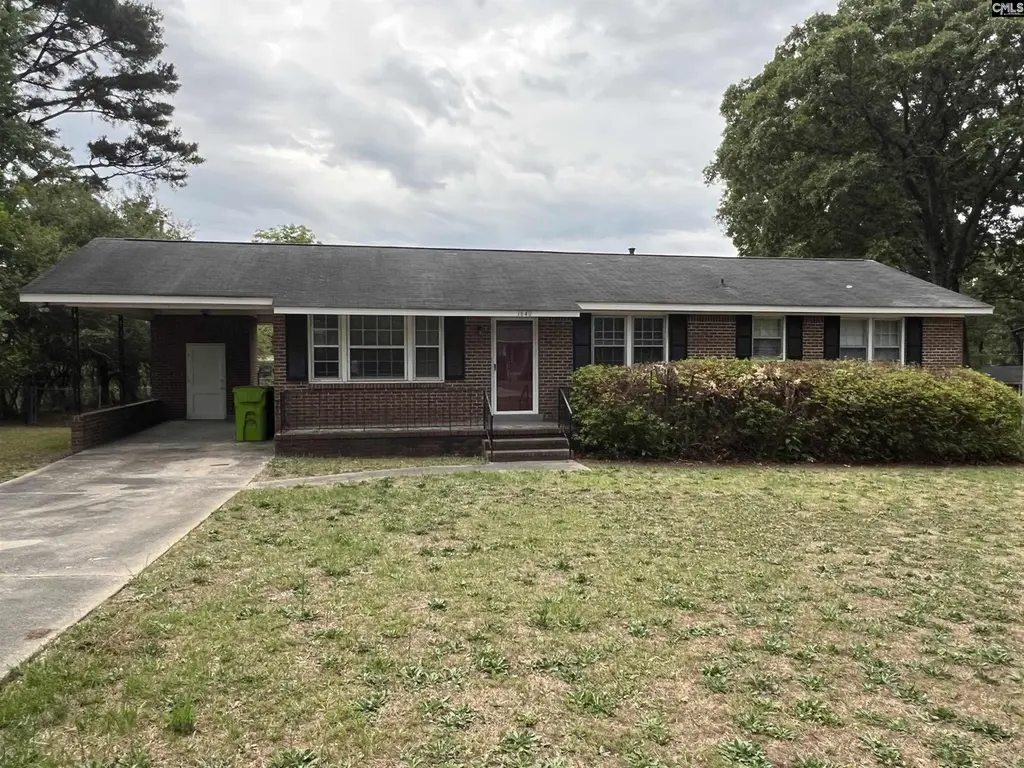
Listing remarks
Welcome to this charming 3-bedroom, 2-bathroom ranch in Hazelwood Acres! This move-in-ready home features updated flooring, and a functional layout. Situated on a generous 0.43-acre lot, the exterior offers a large fenced-in backyard and an attached carport. Conveniently located near Garners Ferry Road and downtown Columbia, this property combines quiet residential living with easy access to shopping and dining. Disclaimer: CMLS has not reviewed and, therefore, does not endorse vendors who may appear in listings.
Key facts
- Generous lot
- Attached carport
- Fenced-in backyard
Tags
Property features AI
Exterior
- Parking: Attached carport (main level); One garage space; One parking space
- Utilities: Public water; Public sewer
- Home design: Single-story home; House faces southwest
- Construction: Crawlspace foundation
- Exterior features: Brick exterior on all sides above foundation; Has pool; Paved road access
Interior
- Kitchen: Vinyl flooring in kitchen; Wood cabinetry; Built-in range; Dishwasher, Refrigerator
- Bedrooms: Master bedroom on the main level; Additional bedrooms on the main level
- Flooring: Vinyl flooring (kitchen)
- Bathrooms: Two full bathrooms
- Heating & cooling: Central heating; Central cooling
- Interior features: Ceiling fans in living and dining areas; Built-in range; Dishwasher, Refrigerator
Neighborhood map
What this means for you Summary
Snapshot
- This is a 3-bed/2.0-bath single-family listed at $180k.
Deal economics
- At list price, monthly cash flow is $92 ($1k/yr) — positive.
- The deal already cash-flows at list — no discount required.
- To meet the 1% rule (rent ≥ 1% of price), the offer needs to be $170k (5.7% below list).
- Recommended offer: $170k (5.7% below list) — sets the bar for 1% rule.
Location & tenants
- Location reads: area grade D — affects rentability + tenant quality, not the cash-flow math above.
- Richland 01 (urban): math 26% / reading 36% proficiency, ranked #54 of 80 in SC (top 68%) — families likely to look elsewhere, expect single-tenant / working-renter base with shorter leases; 64% free/reduced lunch — lower-income household profile, screen leases tightly.
- Zoned schools: Caughman Road Elementary (math 22% / reading 27%, grade F, #452 of 597 statewide, top 78%, 707 students, 100% FRL); Crayton Middle (math 48% / reading 64%, grade B-, #23 of 229 statewide, top 10%, 905 students, 100% FRL); Lower Richland High (math 5% / reading 64%, grade F, #185 of 196 statewide, top 94%, 1,244 students, 100% FRL) — zoned schools average 100% FRL vs 64% district-wide (36 pts higher); higher-poverty schools than district average — tighter screening recommended.
- Market conditions: Rents rising (+2.1%/yr); 298 active listings in the ZIP; 21 comparable units currently listed for rent nearby; rentals at typical pace (median 16d on market — plan ~3-4 weeks tenant-placement turnaround); 3,472 units permitted in Richland County in 2024 (1,096 in 5+ unit buildings).
- This rent runs 35% of the median local income ($59k/yr) — at the standard rent-burdened threshold; future hikes will face affordability resistance.
Forward outlook
- Local home prices are declining (-3.0%/yr); year-one equity from $1k of loan paydown is wiped out by about $5k of value loss. Plan a longer hold.
- Richland County population projected at +30% by 2050 — long-run rental-demand tailwind backs the buy-and-hold thesis.
Negotiation context
- It's been on market 16 days — a 2% lower offer ($177k) is reasonable based on typical stale-listing flexibility.
- Current owner paid $60k; list at $180k implies a 200% gain — meaningful room to come down on a strong offer.
Risks & watch-outs
- Climate carrying-cost: major wind risk, 75% chance of damaging wind over 30y; extreme-heat days projected 7→16/yr by 2055 (HVAC capex compounding) — expect insurance premiums to compound above CPI over the hold.
Questions for the listing agent
- Built in 1966 — when were the roof, HVAC, electrical panel, plumbing, and water heater last replaced?
- Is there a deadline driving the sale (1031 exchange, divorce, estate, relocation)? That informs how much negotiation room exists.
- The area grade is low — what's the realistic commute time and amenity access for the typical tenant pool here? Any planned neighborhood developments (good or bad) we should know about?
- What's the average days-on-market for RENTAL listings here right now (not sales)? A rising rental-DOM trend means longer vacancies and softer asking-rent achievability than the comps imply.
- What's the recent tenant-quality profile in this submarket — average credit score on applications, eviction rate, late-payment / NSF rate, and stable-employment percentage? A property-management company in the area should have these aggregated.
- How much new for-sale + rental construction is in the pipeline within 1–3 miles? Heavy new supply typically softens prices + rents 12–24 months out; constrained supply supports both.
Investment metrics
- 1% rule
- 0.94% ✗
- Cap rate
- 6.91%
- Cash-on-cash
- 2.20%
- DSCR
- 1.10
- GRM
- 8.8
CMA / ARV
No comps found within radius.
Projected returns pro-forma
-3.0% appreciation · 2.08% rent growth · sell at horizon
- IRR
- -13.8%
- Equity multiple
- 0.51×
- Total profit
- $-24,799
- Equity at exit
- $26,824
- IRR
- -6.5%
- Equity multiple
- 0.60×
- Total profit
- $-20,177
- Equity at exit
- $15,554
Cash invested: $50,372 (down + closing). Projections, not guarantees.
Landlord ↔ Tenant lean methodology
- Overall (STATE)
- 90 Strongly Landlord-Friendly
- State South Carolina
- 90 Strongly Landlord-Friendly · R+6
- County
- — inherits STATE
- City
- — inherits STATE
ZIP-level market 29209
- Rents YoY
- 2.1%
- Active inventory
- 298
- Price-to-rent
- 8.8×
Monthly cashflow live
- Estimated rent
- $1,697 high interval (Pro) →
- Mortgage (P&I)
- −$943
- Tax from tax record
- −$230 /mo · $2,760/yr
- Insurance
- −$75
- HOA
- −$0
- Vacancy / Maint / Mgmt
- −$356
- Net cashflow
- $92
Break-even live
Sensitivity live
| Price | -10% $194 | -5% $143 | +0% $92 | +5% $41 | +10% $-10 |
|---|---|---|---|---|---|
| Rent | -10% $-42 | -5% $25 | +0% $92 | +5% $159 | +10% $226 |
| Rate | -1.0pp $183 | -0.5pp $138 | base $92 | +0.5pp $46 | +1.0pp $-2 |
UW: 25.0% down · 7.5% · 30yr · 1.5% tax · 5.0% vac · 8.0% maint · 8.0% mgmt
Financing live
Cash to close
- Down payment
- $44,975
- Closing costs
- $5,397
- Reserves months
- —
- Total cash needed
- —
Loan-product check · same deal, 3 products live
Conventional
25% down · 7.5% · 30yr
- Down + closing
- —
- Monthly P&I
- —
- Monthly cashflow
- —
- DSCR
- —
- Eligible?
- —
Personal DTI + credit; lowest rate.
DSCR
20% down · 8.5% · 30yr
- Down + closing
- —
- Monthly P&I
- —
- Monthly cashflow
- —
- DSCR
- —
- Eligible?
- —
No personal income docs; deal must DSCR.
Hard money
10% down · 12.0% · 12mo
- Down + closing
- —
- Monthly P&I
- —
- Monthly cashflow
- —
- DSCR
- —
- Eligible?
- —
Short-term bridge; refi at stabilization.
Rent comps 21 comps
| Address | Beds | Baths | Sqft | Rent | $/sqft | DOM | Units | Dist |
|---|---|---|---|---|---|---|---|---|
| 1727 Sandra Dr Columbia, SC | 4.0 | 2.5 | 1750 | $1,900 | $1.09 | 13d | 1 | 0.15mi |
| 7116 Tama Rd Columbia, SC | 3.0 | 1.0–1.5 | 600 | $1,225 | $2.04 | 25d | 1 | 0.37mi |
| 164 Ashewood Commons Dr Columbia, SC | 2.0 | 2.0 | 1025 | $1,349 | $1.32 | 16d | 1 | 0.62mi |
| 1401 Elmtree Rd Apt B4 Columbia, SC | 2.0 | 2.0 | 1000 | $1,095 | $1.09 | 25d | 1 | 0.64mi |
| 7712 Burdell Dr Columbia, SC | 3.0 | 1.0 | 1025 | $1,750 | $1.71 | 25d | 1 | 0.66mi |
| 149 Moores Creek Dr Columbia, SC | 3.0 | 2.0 | 1600 | $2,069 | $1.29 | 16d | 1 | 0.70mi |
| 3 Ashley's Pl Unit 04 Columbia, SC | 2.0 | 1.5 | 1100 | $995 | $0.90 | 25d | 1 | 0.70mi |
| 150 Daphne Rd Columbia, SC | 3.0 | 2.0 | 1123 | $1,025 | $0.91 | 25d | 1 | 0.77mi |
| 1101 Hallbrook Dr Columbia, SC | 1.0–3.0 | 1.0–2.0 | 1050 | $1,229 | $1.17 | 16d | 1 | 0.82mi |
| 7648 Garners Ferry Rd Columbia, SC | 3.0 | 1.0–2.0 | 828 | $1,279 | $1.54 | 16d | 1 | 0.87mi |
| 7524 Marie St Columbia, SC | 3.0 | 1.0 | 1075 | $1,350 | $1.26 | 23d | 1 | 0.96mi |
| 7743 Garners Ferry Rd Columbia, SC | 1.0–3.0 | 1.0–2.5 | 1045 | $2,534 | $2.42 | 4d | 19 | 1.04mi |
| 514 Spindrift Ln Columbia, SC | 2.0 | 1.0–1.5 | 1032 | $1,212 | $1.17 | 5d | 1 | 1.22mi |
| 156 Top Forest Dr Columbia, SC | 3.0 | 2.5 | 1855 | $2,500 | $1.35 | 25d | 1 | 1.26mi |
| 600 Greenlawn Dr Columbia, SC | 1.0–3.0 | 1.0–2.0 | 1017 | $1,830 | $1.80 | 4d | 25 | 1.26mi |
| 820 Forest Park Rd Columbia, SC | 2.0 | 2.5 | 1300 | $1,600 | $1.23 | 16d | 1 | 1.29mi |
| 76 Springway Dr Columbia, SC | 3.0 | 2.5 | 1326 | $1,829 | $1.38 | 13d | 1 | 1.33mi |
| 320 Beacons Field Rd Columbia, SC | 3.0 | 2.5 | 1663 | $2,183 | $1.31 | 16d | 1 | 1.44mi |
| 448 Red Poll Way Columbia, SC | 4.0 | 2.5 | 1783 | $2,183 | $1.22 | 25d | 1 | 1.45mi |
| 425 Red Poll Way Columbia, SC | 4.0 | 2.5 | 1783 | $2,133 | $1.20 | 25d | 1 | 1.46mi |
| 409 Levington Ln Columbia, SC | 3.0 | 2.5 | 1732 | $1,995 | $1.15 | 25d | 1 | 1.50mi |
Listing history 11 events
-
2026-06-21days on market $179,900 Active 16 DOM
-
2026-06-18days on market $179,900 Active 13 DOM
-
2026-06-17days on market $179,900 Active 12 DOM
-
2026-06-16days on market $179,900 Active 11 DOM
-
2026-06-15days on market $179,900 Active 10 DOM
-
2026-06-14days on market $179,900 Active 8 DOM
-
2026-06-10days on market $179,900 Active 5 DOM
-
2026-06-09days on market $179,900 Active 4 DOM
-
2026-06-08days on market $179,900 Active 3 DOM
-
2026-06-07remarks 519-char remark
-
2026-06-07$179,900 Active 2 DOM
ⓘ Source: listings_history table (triggers on properties + properties_extension) + one-shot
backfill from property_details.listing_events for pre-trigger history.
Tax reassessment forecast SC · Resets to sale price
- Current annual tax
- $2,760 · $230/mo
- Projected year-2 tax
- $2,760 · $230/mo
- Expected delta
- $0/yr ($0/mo · 0.0%)
ⓘ Screening estimate from a state-policy table — verify with the county assessor before closing.
Climate risk First Street
- Flood 1/10 Low FEMA zone X (unshaded) · 0% chance over 30 yrs
- Wildfire 3/10 Moderate
- Heat 6/10 Major 7 d/yr ≥108°F today · 16 d/yr by 30 yrs out
- Wind 7/10 Severe 75% chance of damaging wind over 30 yrs
- Air quality 3/10 Moderate 2 unhealthy d/yr today · 2 by 30 yrs out
Nearby sold comps map
Loading sold comps map…
Walkable amenities ~0.75 mi
Loading nearby amenities…
Taxation est. · year 1
- Rental income
- $20,365
- − Mortgage interest
- −$10,077
- − Property taxes
- −$2,760
- − Insurance
- −$900
- − Repairs & maintenance
- −$1,629
- − Management
- −$1,629
- − Depreciation
- −$5,233
- Taxable loss
- −$1,863
- Est. tax savings @ 24.0%
- +$447
- After-tax cash flow
- $1,555/yr
For passive investors: Depreciation is non-cash, so a rental often shows a tax loss while cash-flowing — sheltering income. Rental losses are passive: they offset passive income freely, and up to $25,000/yr can offset ordinary (W-2) income if you actively participate and your MAGI is under $100k (phasing out to $0 by $150k); unused losses carry forward. On sale, claimed depreciation is recaptured at up to 25%, and gains may owe capital-gains tax (a 1031 exchange can defer both). Figures are a year-1 estimate at your 24.0% rate — not tax advice; consult a CPA.
Schools (NCES district)
- District
- Richland 01
- NCES district ID
- 4503360
- Math proficiency
- 26% ▼ -7.00%
- Reading proficiency
- 36% ▼ -5.00%
- Median HH income
- $38,931
- Composite
- 25.94/100
- National rank
- #7335
- State rank
- #54 of 80 in SC
Livability — Capitol View
No livability data for this city. (Only ~50 U.S. cities are tracked.)
Census & demographics
- Census place
- Capitol View, SC
- County
- Richland County · 389,530 people
- Metro
- Columbia, SC
- Population (ZIP)
- 38,041
- Household income
- $58,772
- Rent vs Own
- Severe rent burden
- 1716.0
Population outlook (Richland County) Hauer SSP2
- Today (2025)
- 459,667 people
- By 2030
- 487,524 · +6.1%
- By 2040
- 542,035 · +17.9%
- By 2050
- 595,371 · +29.5%
- By 2075
- 732,998 · +59.5%
- By 2100
- 820,415 · +78.5%
Race, ethnicity, and origin ACS 2023
- Neighborhood character
- Diverse neighborhood (Simpson 0.62)
- Race & ethnicity
- Black 48% White 39% Two or more races 6% Hispanic / Latino 6% Asian 2%
- Hispanic origin (detail)
- Mexican 3% Puerto Rican 2%
- Common ancestry
- Slovak 2% Serbian 2% Italian 1%
- Foreign-born
- 6% · Canada, Jamaica
- Languages at home
- 93% English-only · Spanish 3% Arabic 1% Other Indo-European 1%
Political lean MEDSL · Richland
- 2024 margin
- Solid D (+34.6) · D 66.4% · R 31.8% · Other 1.8%
- 2008→2024 swing
- +5.7pp toward D · 2008: 28.9pp · 2024: 34.6pp
- All cycles
- 2024: D+34.6 2020: D+38.3 2016: D+32.9 2012: D+33.3 2008: D+28.9
Not yet ingested
- Civics
- —
Market trends
- HPI YoY
- ▼ -142.10%
- Current HPI
- 205.5679
- Rent YoY
- ▲ 2.08%
- Metro
- Columbia, SC
- State GDP YoY
- ▲ 4.51%
- F500 in state
- 2
Industry mix (Fortune 500 HQ in SC)
| Industry | F500 HQs | Revenue |
|---|---|---|
| Packaging | 1 | $7B |
|
||
Price history
+199.8% since first listed2 events — show timeline
- 2026-06-05 Listed $179,900 Consolidated MLS
- 2018-02-08 Sold (Public Records) $60,000 Public Records
Property tax history
+11.7%/yrLatest (2025): $2,760 · +2.6% YoY. Source: county tax records.
Cash-flow waterfall
monthlySold comps — $/sqft
last 12 mo · ≤1 miLoading sold comps…