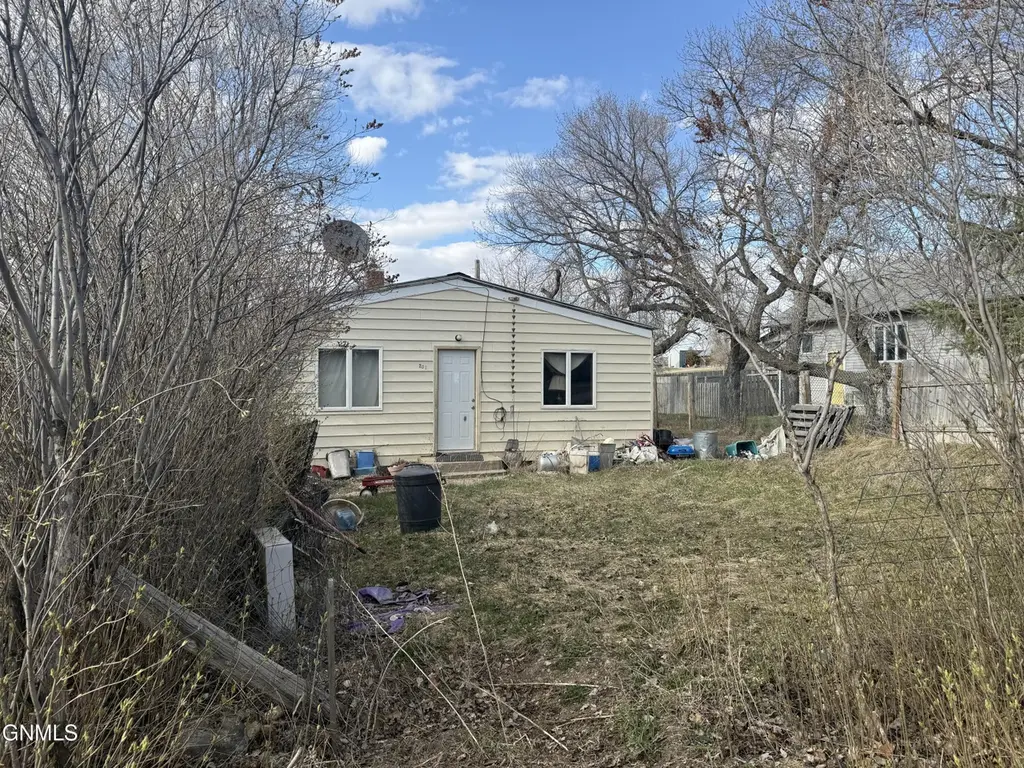
201 3rd Ave E · Westby, MT
Flood risk 1/10 · Minimal
- FEMA flood zone
- —
- Chance of flooding over 30 yrs
- 0.0%
- Est. flood insurance / yr
- —
Fire risk 4/10 · Minor
- Est. fire insurance / yr
- $918 – $1,706
Heat risk 2/10 · Minimal
- Hot days now (above 94°F)
- 7 days/yr
- Hot days in 30 yrs
- 13 days/yr
Wind risk 1/10 · Minimal
- Chance of severe wind over 30 yrs
- —
Air-quality risk 5/10 · Moderate
- Unhealthy air days now
- 8 days/yr
- Unhealthy air days in 30 yrs
- 8 days/yr
Risk factors via First Street. Map © Google.
Why this score? — see what drove the D+ grade
The composite is a weighted blend of 9 inputs, each scored 0–100. Each bar is that input's sub-score; the figure is the points it added to the 100-point composite (weight × sub-score).
- Cash flow +15.0/30.0
- ARV discount +7.5/15.0
- Appreciation +5.3/10.0
- 1% rule +5.0/10.0
- DSCR +5.0/10.0
- Schools +3.6/10.0
- Livability +3.4/5.0
- Rent growth +2.5/5.0
- Condition / age +2.5/5.0
$25,000
🖨 Deal sheet 📄 Offer letter ✓ Due diligence
Key facts
- 9,104 sq ft lot
- Built 1915
- Listed 22 days
Property features AI
Exterior
- Parking: On-site parking
- Utilities: Public water; Private sewer
- Home design: Single-family residence; Residential property
- Construction: Other construction materials
- Exterior features: Rectangular lot; Metal roof
Interior
- Bathrooms: One full bathroom
- Heating & cooling: No heating; No cooling
- Interior features: No built-in appliances listed; Concrete basement
Neighborhood map
What this means for you Summary
Snapshot
- This is a 2-bed/1.0-bath single-family listed at $25k.
Deal economics
- At list price, monthly cash flow is $731 ($9k/yr) — positive.
- The deal already cash-flows at list — no discount required.
- Meets the 1% rule at list price ($1k rent vs $25k).
- Recommended offer: $25k (1.5% below list) — sets the bar for market timing.
Location & tenants
- Location reads 68/100 on livability (#97 in MT) — a middle-class / working-renter tenant base. Strengths: cost of living A+, housing A+, employment B; Watch: health & safety D, crime D-, amenities F.
- Westby K-12 Schools (rural): math 40% / reading 40% proficiency, ranked #144 of 339 in MT (top 42%) — families likely to look elsewhere, expect single-tenant / working-renter base with shorter leases; only 19% free/reduced lunch — higher-income household profile.
- Market conditions: 3 active listings in the ZIP; 5 units permitted in Sheridan County in 2024 (0 in 5+ unit buildings).
Forward outlook
- In year one you build about $306 of equity ($173 loan paydown + $133 appreciation (0.5% local appreciation)).
- Sheridan County population projected at +62% by 2050 — long-run rental-demand tailwind backs the buy-and-hold thesis.
- At projected returns (0.5% appreciation + 3.0% rent growth), your $7k cash investment doubles in ~1 year — after that, you're playing with house money.
Negotiation context
- It's been on market 23 days — a 2% lower offer ($25k) is reasonable based on typical stale-listing flexibility.
Risks & watch-outs
- Watch-outs: built in 1915 — expect roof / HVAC / electrical / plumbing capex.
Questions for the listing agent
- Built in 1915 — when were the roof, HVAC, electrical panel, plumbing, and water heater last replaced?
- Is there a deadline driving the sale (1031 exchange, divorce, estate, relocation)? That informs how much negotiation room exists.
- Schools are B-rated — typically a magnet for longer-tenancy family renters. What's the average tenant stay here, and is there a school-zone premium baked into asking?
- Crime grade is D in this area — have there been break-ins, vandalism, or insurance claims at this property in the last 3 years? What carrier currently insures it and at what premium?
- The area grade is low — what's the realistic commute time and amenity access for the typical tenant pool here? Any planned neighborhood developments (good or bad) we should know about?
- What's the average days-on-market for RENTAL listings here right now (not sales)? A rising rental-DOM trend means longer vacancies and softer asking-rent achievability than the comps imply.
- What's the recent tenant-quality profile in this submarket — average credit score on applications, eviction rate, late-payment / NSF rate, and stable-employment percentage? A property-management company in the area should have these aggregated.
- How much new for-sale + rental construction is in the pipeline within 1–3 miles? Heavy new supply typically softens prices + rents 12–24 months out; constrained supply supports both.
Investment metrics
- 1% rule
- 4.58% ✓
- Cap rate
- 41.40%
- Cash-on-cash
- 125.38%
- DSCR
- 6.58
- GRM
- 1.8
CMA / ARV
- ARV (on-the-fly)
- $80,032
- Comps found
- 1
Show comp detail 1 sale within ~0.75 mi
| Address | Dist | Beds/Ba | Sqft | Sold | Price | $/sf | Match |
|---|---|---|---|---|---|---|---|
| 505 Kulass St | 0.12mi | 2/2.0 | 1,140 (-13%) | 6mo | $70,000 | $61 | 64 |
Match score weights: distance 35% · size 25% · config 20% · recency 20%. Top-matched comps best support the ARV.
Projected returns pro-forma
0.53% appreciation · 3.0% rent growth · sell at horizon
- IRR
- —
- Equity multiple
- 7.64×
- Total profit
- $46,498
- Equity at exit
- $7,929
- IRR
- —
- Equity multiple
- 15.94×
- Total profit
- $104,550
- Equity at exit
- $10,084
Cash invested: $7,000 (down + closing). Projections, not guarantees.
Landlord ↔ Tenant lean methodology
- Overall (STATE)
- 82 Strongly Landlord-Friendly
- State Montana
- 82 Strongly Landlord-Friendly · R+11
- County
- — inherits STATE
- City
- — inherits STATE
ZIP-level market 59275
- Home prices YoY
- 0.3%
- Active inventory
- 3
- Price-to-rent
- 1.8×
Monthly cashflow live
- Estimated rent
- $1,144 medium interval (Pro) →
- Mortgage (P&I)
- −$131
- Tax est. 1.5%
- −$31 /mo · $375/yr
- Insurance
- −$10
- HOA
- −$0
- Vacancy / Maint / Mgmt
- −$240
- Net cashflow
- $731
Break-even live
UW: 25.0% down · 7.5% · 30yr · 1.5% tax · 5.0% vac · 8.0% maint · 8.0% mgmt
Financing live
Cash to close
- Down payment
- $6,250
- Closing costs
- $750
- Reserves months
- —
- Total cash needed
- —
Loan-product check · same deal, 3 products live
Conventional
25% down · 7.5% · 30yr
- Down + closing
- —
- Monthly P&I
- —
- Monthly cashflow
- —
- DSCR
- —
- Eligible?
- —
Personal DTI + credit; lowest rate.
DSCR
20% down · 8.5% · 30yr
- Down + closing
- —
- Monthly P&I
- —
- Monthly cashflow
- —
- DSCR
- —
- Eligible?
- —
No personal income docs; deal must DSCR.
Hard money
10% down · 12.0% · 12mo
- Down + closing
- —
- Monthly P&I
- —
- Monthly cashflow
- —
- DSCR
- —
- Eligible?
- —
Short-term bridge; refi at stabilization.
Listing history 16 events
-
2026-06-18days on market $25,000 Active 23 DOM
-
2026-06-17days on market $25,000 Active 22 DOM
-
2026-06-16days on market $25,000 Active 21 DOM
-
2026-06-15days on market $25,000 Active 20 DOM
-
2026-06-13days on market $25,000 Active 18 DOM
-
2026-06-12days on market $25,000 Active 17 DOM
-
2026-06-09days on market $25,000 Active 14 DOM
-
2026-06-08days on market $25,000 Active 13 DOM
-
2026-06-07days on market $25,000 Active 12 DOM
-
2026-06-05days on market $25,000 Active 10 DOM
-
2026-06-04days on market $25,000 Active 8 DOM
-
2026-06-02days on market $25,000 Active 7 DOM
-
2026-06-01days on market $25,000 Active 6 DOM
-
2026-05-31days on market $25,000 Active 5 DOM
-
2026-05-26$25,000 Active
-
2004-07-14soldstatus
ⓘ Source: listings_history table (triggers on properties + properties_extension) + one-shot
backfill from property_details.listing_events for pre-trigger history.
Climate risk First Street
- Flood 1/10 Low 0% chance over 30 yrs
- Wildfire 4/10 Moderate
- Heat 2/10 Low 7 d/yr ≥94°F today · 13 d/yr by 30 yrs out
- Wind 1/10 Low
- Air quality 5/10 Major 8 unhealthy d/yr today · 8 by 30 yrs out
Nearby sold comps map
Loading sold comps map…
Walkable amenities ~0.75 mi
Loading nearby amenities…
Taxation est. · year 1
- Rental income
- $13,734
- − Mortgage interest
- −$1,400
- − Property taxes
- −$375
- − Insurance
- −$125
- − Repairs & maintenance
- −$1,099
- − Management
- −$1,099
- − Depreciation
- −$727
- Taxable income
- $8,909
- Est. tax owed @ 24.0%
- −$2,138
- After-tax cash flow
- $6,638/yr
For passive investors: Depreciation is non-cash, so a rental often shows a tax loss while cash-flowing — sheltering income. Rental losses are passive: they offset passive income freely, and up to $25,000/yr can offset ordinary (W-2) income if you actively participate and your MAGI is under $100k (phasing out to $0 by $150k); unused losses carry forward. On sale, claimed depreciation is recaptured at up to 25%, and gains may owe capital-gains tax (a 1031 exchange can defer both). Figures are a year-1 estimate at your 24.0% rate — not tax advice; consult a CPA.
Schools (NCES district)
- District
- Westby K-12 Schools
- NCES district ID
- 3027730
- Math proficiency
- 40% ▲ 10.00%
- Reading proficiency
- 40% ▼ -20.00%
- Median HH income
- $45,043
- Composite
- 36.45/100
- National rank
- #9332
- State rank
- #144 of 339 in MT
Livability — Westby
- Score
- 68/100
- State rank
- #97
- US rank
- #9986
Category grades
Schools grade is shown separately in the Schools card above.
Census & demographics
- Census place
- Westby, MT
- Population (ZIP)
- 567
Population outlook (Sheridan County) Hauer SSP2
- Today (2025)
- 4,481 people
- By 2030
- 4,951 · +10.5%
- By 2040
- 6,013 · +34.2%
- By 2050
- 7,266 · +62.2%
- By 2075
- 10,842 · +142.0%
- By 2100
- 13,272 · +196.2%
Race, ethnicity, and origin ACS 2023
- Neighborhood character
- Predominantly White (99%)
- Race & ethnicity
- White 99%
- Common ancestry
- Portuguese 24% Scottish 7% Slovak 6%
- Foreign-born
- 1%
Political lean MEDSL · Sheridan
- 2024 margin
- Solid R (+42.5) · D 26.6% · R 69.1% · Other 4.3%
- 2008→2024 swing
- -40.8pp toward R · 2008: -1.7pp · 2024: -42.5pp
- All cycles
- 2024: R+42.5 2020: R+40.8 2016: R+41.7 2012: R+28.2 2008: R+1.7
Not yet ingested
- Civics
- —
Market trends
- HPI YoY
- ▲ 0.53%
- Current HPI
- 160.6487
- Rent YoY
- —
- Metro
- —
- State GDP YoY
- ▲ 3.41%
- F500 in state
- 2
Industry mix (Fortune 500 HQ in MT)
| Industry | F500 HQs | Revenue |
|---|---|---|
| Technology / Analytics | 1 | $2B |
|
||
Price history
2 events — show timeline
- 2026-05-26 Listed $25,000 GNMLS
- 2004-07-14 Sold (Public Records) — Public Records
Property tax history
+20.4%/yrLatest (2025): $2,039 · +18.5% YoY. Source: county tax records.
Cash-flow waterfall
monthlySold comps — $/sqft
last 12 mo · ≤1 miLoading sold comps…