11001 Charleston Rd · Hometown, WV
Flood risk 7/10 · Major
- FEMA flood zone
- X (unshaded)
- Chance of flooding over 30 yrs
- 0.76%
- Est. flood insurance / yr
- $507 – $1,088
Fire risk 3/10 · Minor
- Est. fire insurance / yr
- $787 – $1,461
Heat risk 5/10 · Moderate
- Hot days now (above 101°F)
- 7 days/yr
- Hot days in 30 yrs
- 21 days/yr
Wind risk 2/10 · Minimal
- Chance of severe wind over 30 yrs
- 1.0%
Air-quality risk 1/10 · Minimal
- Unhealthy air days now
- 0 days/yr
- Unhealthy air days in 30 yrs
- 0 days/yr
Risk factors via First Street. Map © Google.
Why this score? — see what drove the C grade
The composite is a weighted blend of 9 inputs, each scored 0–100. Each bar is that input's sub-score; the figure is the points it added to the 100-point composite (weight × sub-score).
- Cash flow +20.5/30.0
- ARV discount +7.5/15.0
- DSCR +6.5/10.0
- 1% rule +5.4/10.0
- Appreciation +5.2/10.0
- Schools +3.9/10.0
- Livability +3.2/5.0
- Rent growth +2.5/5.0
- Condition / age +2.5/5.0
$140,000
🖨 Deal sheet 📄 Offer letter ✓ Due diligence
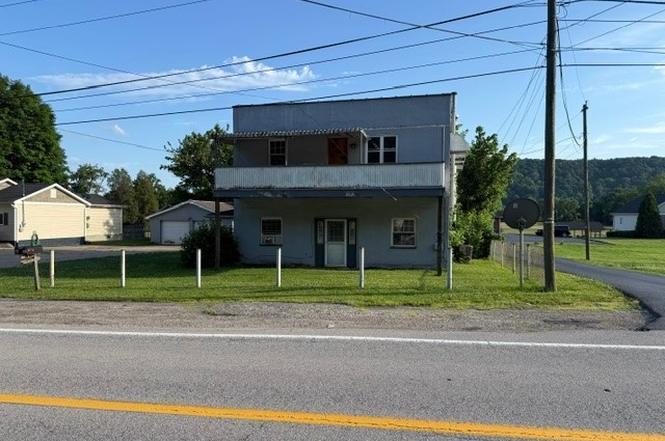
Listing remarks
This duplex is a nice two-story building in a great area. Upstairs is a 3 bed, 1 bath renting for $750.00, monthly and the downstairs is a 2 bed, 1 bath renting for $600.00, monthly. This property also has a two-car garage currently rented for $100.00 monthly.
Key facts
- 7,841 sq ft lot
- 2 garage spots
- Built 1945
Property features AI
Exterior
- Parking: Detached 2-car garage
- Security: Smoke detectors
- Utilities: Public water; Public sewer
- Home design: Single family residence; Two-story
- Construction: Block construction; Flat roof
- Exterior features: Fenced yard; Storage
Interior
- Kitchen: Electric range; Microwave; Refrigerator
- Flooring: Laminate; Vinyl
- Bathrooms: 2 full bathrooms
- Heating & cooling: Forced air heating; Coal heating; Wood heating; Window unit air conditioning
- Interior features: Eat-in kitchen; Insulated windows; Fireplace (1)
Neighborhood map
What this means for you Summary
Snapshot
- This is a 5-bed/2.0-bath single-family listed at $140k.
Deal economics
- At list price, monthly cash flow is $117 ($1k/yr) — positive.
- The deal already cash-flows at list — no discount required.
- Meets the 1% rule at list price ($1k rent vs $140k).
- Recommended offer: $127k (9.0% below list) — sets the bar for market timing.
Location & tenants
- Location reads 63/100 on livability (#157 in WV) — a middle-class / working-renter tenant base. Strengths: cost of living A+, housing A+, crime B; Watch: amenities F, commute F, employment F.
- Putnam County Schools (suburban): math 40% / reading 50% proficiency, ranked #2 of 55 in WV (top 4%) — families likely to look elsewhere, expect single-tenant / working-renter base with shorter leases.
- Zoned schools: Hometown Elementary (math 24% / reading 24%, grade F, #287 of 377 statewide, top 85%, 52 students, 0% FRL); Poca High School (math 17% / reading 47%, grade F, #55 of 110 statewide, top 59%, 446 students, 0% FRL) — zoned schools average 0% FRL vs 33% district-wide (33 pts lower); this property's tenant base skews higher-income than the district average.
- Zoned-school proficiency averages 28% at this address vs 45% district-wide (-17 pts) — the specific schools serving this property underperform the Putnam County Schools average; the district grade overstates school quality for this exact location.
- Market conditions: 10 active listings in the ZIP; 111 units permitted in Putnam County in 2024 (0 in 5+ unit buildings).
Forward outlook
- In year one you build about $2k of equity ($968 loan paydown + $686 appreciation (0.5% local appreciation)).
- At projected returns (0.5% appreciation + 3.0% rent growth), your $39k cash investment doubles in ~9 years — after that, you're playing with house money.
Negotiation context
- It's been on market 116 days — a 9% lower offer ($127k) is reasonable based on typical stale-listing flexibility.
Risks & watch-outs
- Watch-outs: flood insurance adds $66/mo; built in 1945 — expect roof / HVAC / electrical / plumbing capex.
- Climate carrying-cost: major flood risk; extreme-heat days projected 7→21/yr by 2055 (HVAC capex compounding) — expect insurance premiums to compound above CPI over the hold.
Questions for the listing agent
- It's been on market 116 days. Have you received any prior offers? Is the seller open to a 9% concession, seller financing, or rate buy-down credit?
- Built in 1945 — when were the roof, HVAC, electrical panel, plumbing, and water heater last replaced?
- What's the actual annual flood-insurance premium (NFIP or private), and is the property in a SFHA with mandatory coverage?
- Why hasn't it sold? Are there any deal-killer items the seller is aware of (foundation, flood, title, zoning, code violations)?
- Is there a deadline driving the sale (1031 exchange, divorce, estate, relocation)? That informs how much negotiation room exists.
- Schools are F-rated, which usually means shorter tenancies and higher turnover. Who's the typical renter profile here, and what's been the actual vacancy rate?
- What's the average days-on-market for RENTAL listings here right now (not sales)? A rising rental-DOM trend means longer vacancies and softer asking-rent achievability than the comps imply.
- What's the recent tenant-quality profile in this submarket — average credit score on applications, eviction rate, late-payment / NSF rate, and stable-employment percentage? A property-management company in the area should have these aggregated.
- How much new for-sale + rental construction is in the pipeline within 1–3 miles? Heavy new supply typically softens prices + rents 12–24 months out; constrained supply supports both.
Investment metrics
- 1% rule
- 1.04% ✓
- Cap rate
- 7.87%
- Cash-on-cash
- 5.63%
- DSCR
- 1.25
- GRM
- 8.0
CMA / ARV
- ARV (on-the-fly)
- $364,800
- Comps found
- 3
Show comp detail 3 sales within ~0.75 mi
| Address | Dist | Beds/Ba | Sqft | Sold | Price | $/sf | Match |
|---|---|---|---|---|---|---|---|
| 1 Hampton Rd | 0.57mi | 4/2.5 (-1) | 2,450 (+2%) | 5mo | $345,000 | $141 | 59 |
| 7 Waters Edge Rd | 0.51mi | 4/2.5 (-1) | 2,317 (-4%) | 15mo | $355,000 | $153 | 51 |
| 128 Westland Ests | 0.74mi | 4/3.5 (-1) | 2,559 (+7%) | 9mo | $389,000 | $152 | 36 |
Match score weights: distance 35% · size 25% · config 20% · recency 20%. Top-matched comps best support the ARV.
Projected returns pro-forma
0.49% appreciation · 3.0% rent growth · sell at horizon
- IRR
- 3.5%
- Equity multiple
- 1.17×
- Total profit
- $6,701
- Equity at exit
- $44,116
- IRR
- 8.4%
- Equity multiple
- 1.97×
- Total profit
- $37,843
- Equity at exit
- $55,880
Cash invested: $39,200 (down + closing). Projections, not guarantees.
Landlord ↔ Tenant lean methodology
- Overall (STATE)
- 83 Strongly Landlord-Friendly
- State West Virginia
- 83 Strongly Landlord-Friendly · R+22
- County
- — inherits STATE
- City
- — inherits STATE
ZIP-level market 25168
- Home prices YoY
- 0.3%
- Active inventory
- 10
- Price-to-rent
- 8.0×
Monthly cashflow live
- Estimated rent
- $1,457 medium interval (Pro) →
- Mortgage (P&I)
- −$734
- Tax est. 1.5%
- −$175 /mo · $2,100/yr
- Insurance
- −$58
- Flood insurance flood zone
- −$66 /mo · $798/yr
- HOA
- −$0
- Vacancy / Maint / Mgmt
- −$306
- Net cashflow
- $117
Break-even live
UW: 25.0% down · 7.5% · 30yr · 1.5% tax · 5.0% vac · 8.0% maint · 8.0% mgmt
Financing live
Cash to close
- Down payment
- $35,000
- Closing costs
- $4,200
- Reserves months
- —
- Total cash needed
- —
Loan-product check · same deal, 3 products live
Conventional
25% down · 7.5% · 30yr
- Down + closing
- —
- Monthly P&I
- —
- Monthly cashflow
- —
- DSCR
- —
- Eligible?
- —
Personal DTI + credit; lowest rate.
DSCR
20% down · 8.5% · 30yr
- Down + closing
- —
- Monthly P&I
- —
- Monthly cashflow
- —
- DSCR
- —
- Eligible?
- —
No personal income docs; deal must DSCR.
Hard money
10% down · 12.0% · 12mo
- Down + closing
- —
- Monthly P&I
- —
- Monthly cashflow
- —
- DSCR
- —
- Eligible?
- —
Short-term bridge; refi at stabilization.
Listing history 16 events
-
2026-06-19days on market $140,000 Active 116 DOM
-
2026-06-18days on market $140,000 Active 115 DOM
-
2026-06-17days on market $140,000 Active 114 DOM
-
2026-06-16days on market $140,000 Active 113 DOM
-
2026-06-15days on market $140,000 Active 112 DOM
-
2026-06-14days on market $140,000 Active 110 DOM
-
2026-06-12days on market $140,000 Active 109 DOM
-
2026-06-09days on market $140,000 Active 106 DOM
-
2026-06-08days on market $140,000 Active 105 DOM
-
2026-06-07pricedays on market $140,000 Active 104 DOM
-
2026-06-03days on market $155,000 Active 100 DOM
-
2026-06-02days on market $155,000 Active 99 DOM
-
2026-06-01days on market $155,000 Active 98 DOM
-
2026-05-31days on market $155,000 Active 97 DOM
-
2026-05-30days on market $155,000 Active 96 DOM
-
2026-02-23$155,000 Active
ⓘ Source: listings_history table (triggers on properties + properties_extension) + one-shot
backfill from property_details.listing_events for pre-trigger history.
Climate risk First Street
- Flood 7/10 Severe FEMA zone X (unshaded) · 76% chance over 30 yrs
- Wildfire 3/10 Moderate
- Heat 5/10 Major 7 d/yr ≥101°F today · 21 d/yr by 30 yrs out
- Wind 2/10 Low 100% chance of damaging wind over 30 yrs
- Air quality 1/10 Low 0 unhealthy d/yr today · 0 by 30 yrs out
Nearby sold comps map
Loading sold comps map…
Walkable amenities ~0.75 mi
Loading nearby amenities…
Taxation est. · year 1
- Rental income
- $17,489
- − Mortgage interest
- −$7,842
- − Property taxes
- −$2,100
- − Insurance
- −$1,498
- − Repairs & maintenance
- −$1,399
- − Management
- −$1,399
- − Depreciation
- −$4,073
- Taxable loss
- −$822
- Est. tax savings @ 24.0%
- +$197
- After-tax cash flow
- $1,606/yr
For passive investors: Depreciation is non-cash, so a rental often shows a tax loss while cash-flowing — sheltering income. Rental losses are passive: they offset passive income freely, and up to $25,000/yr can offset ordinary (W-2) income if you actively participate and your MAGI is under $100k (phasing out to $0 by $150k); unused losses carry forward. On sale, claimed depreciation is recaptured at up to 25%, and gains may owe capital-gains tax (a 1031 exchange can defer both). Figures are a year-1 estimate at your 24.0% rate — not tax advice; consult a CPA.
Schools (NCES district)
- District
- Putnam County Schools
- NCES district ID
- 5401200
- Math proficiency
- 40% ▼ -13.00%
- Reading proficiency
- 50% ▼ -6.00%
- Median HH income
- $54,783
- Composite
- 39.06/100
- National rank
- #4060
- State rank
- #2 of 55 in WV
Livability — Hometown
- Score
- 63/100
- State rank
- #157
- US rank
- #14988
Category grades
Schools grade is shown separately in the Schools card above.
Census & demographics
- City population
- 699
- Population (ZIP)
- 2,827
Population outlook (Putnam County) Hauer SSP2
- Today (2025)
- 58,915 people
- By 2030
- 59,400 · +0.8%
- By 2040
- 59,444 · +0.9%
- By 2050
- 58,510 · -0.7%
- By 2075
- 54,603 · -7.3%
- By 2100
- 46,202 · -21.6%
Race, ethnicity, and origin ACS 2023
- Neighborhood character
- Predominantly White (95%)
- Race & ethnicity
- White 95% Two or more races 5%
- Common ancestry
- Slovak 3% Romanian 3% Lithuanian 1%
Political lean MEDSL · Putnam
- 2024 margin
- Solid R (+46.3) · D 25.9% · R 72.2% · Other 1.9%
- 2008→2024 swing
- -22.8pp toward R · 2008: -23.5pp · 2024: -46.3pp
- All cycles
- 2024: R+46.3 2020: R+42.6 2016: R+47.8 2012: R+37.1 2008: R+23.5
Not yet ingested
- Civics
- —
Market trends
- HPI YoY
- ▲ 0.49%
- Current HPI
- 138.6799
- Rent YoY
- —
- Metro
- —
- State GDP YoY
- —
- F500 in state
- 0
Price history
1 event — show timeline
- 2026-02-23 Listed $155,000 KVBOR
Cash-flow waterfall
monthlySold comps — $/sqft
last 12 mo · ≤1 miLoading sold comps…