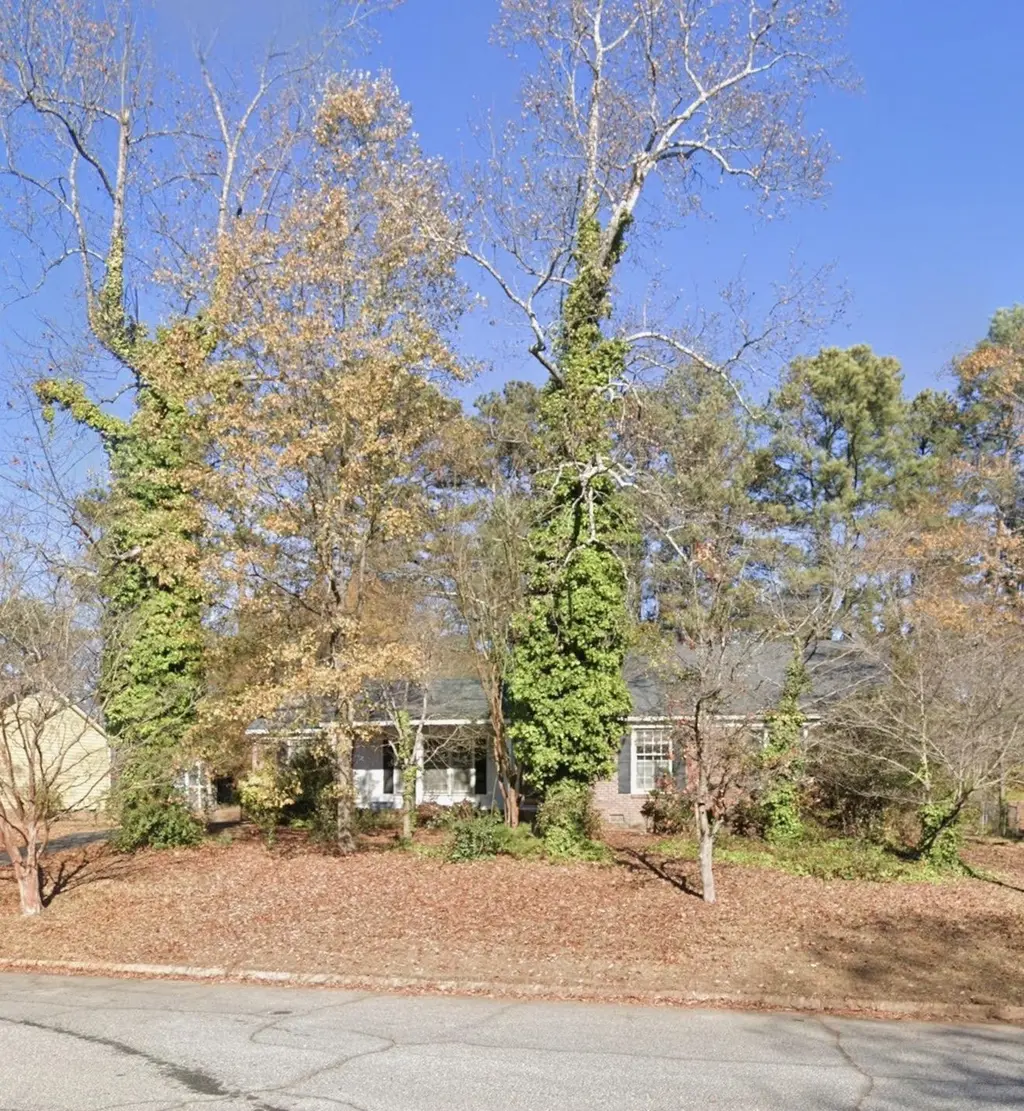
108 Barclay Downs Dr · Spartanburg, SC
Flood risk 1/10 · Minimal
- FEMA flood zone
- X (unshaded)
- Chance of flooding over 30 yrs
- 0.0%
- Est. flood insurance / yr
- $507 – $1,088
Fire risk 1/10 · Minimal
- Est. fire insurance / yr
- $783 – $1,453
Heat risk 6/10 · Moderate
- Hot days now (above 105°F)
- 7 days/yr
- Hot days in 30 yrs
- 16 days/yr
Wind risk 2/10 · Minimal
- Chance of severe wind over 30 yrs
- 2.0%
Air-quality risk 4/10 · Minor
- Unhealthy air days now
- 4 days/yr
- Unhealthy air days in 30 yrs
- 5 days/yr
Risk factors via First Street. Map © Google.
Why this score? — see what drove the C+ grade
The composite is a weighted blend of 9 inputs, each scored 0–100. Each bar is that input's sub-score; the figure is the points it added to the 100-point composite (weight × sub-score).
- Cash flow +22.2/30.0
- ARV discount +15.0/15.0
- DSCR +7.1/10.0
- 1% rule +5.0/10.0
- Livability +3.8/5.0
- Schools +3.2/10.0
- Condition / age +2.5/5.0
- Rent growth +1.8/5.0
- Appreciation +0.0/10.0
$165,000
🖨 Deal sheet 📄 Offer letter ✓ Due diligence
Listing remarks
Nestled in a prime Spartanburg location, this 3-bedroom, 2-bath home offers incredible potential for the savvy buyer. The spacious layout features two separate living rooms, providing ample space for entertainment or a home office. Perfectly situated near city amenities, this property is a fantastic opportunity to customize your dream space. Please note: due to the home's current condition, purchase requires either a cash offer or a conventional loan. Schedule your tour today!
Key facts
- Home office
- 0.33 acre lot
- Built 1971
Tags
Property features AI
Finance
- Other: Property taxes approximately $1,230 annually
Exterior
- Home design: Single-family residence; Residential property
- Construction: Built with brick veneer
- Exterior features: Brick veneer exterior; Subdivision: Camelot; Directions: John B. White Sr Blvd or Hwy 29 to Camelot Drive; turn onto Barclay Downs Drive—house on the right
Interior
- Bathrooms: 2 full bathrooms
- Interior features: One-level living
Neighborhood map
What this means for you Summary
Snapshot
- This is a 4-bed/2.0-bath single-family listed at $165k.
Deal economics
- At list price, monthly cash flow is $268 ($3k/yr) — positive.
- The deal already cash-flows at list — no discount required.
- Meets the 1% rule at list price ($2k rent vs $165k).
- Recommended offer: $163k (1.5% below list) — sets the bar for market timing.
- Cap rate 8.2% vs local median 3.9% in Spartanburg — top-decile yield for the area; either an underpriced asset or a hidden risk that comps aren't pricing in. Stress-test before assuming the spread holds.
Location & tenants
- Location reads 76/100 on livability (#24 in SC, #3,679 nationally) — a middle-class / working-renter tenant base. Strengths: amenities A+, commute A+, cost of living A+; Watch: crime F, employment F.
- Spartanburg 06 (suburban): math 33% / reading 42% proficiency, ranked #35 of 80 in SC (top 44%) — families likely to look elsewhere, expect single-tenant / working-renter base with shorter leases.
- Zoned schools: R. P. Dawkins Middle (math 38% / reading 44%, grade F, #72 of 229 statewide, top 32%, 862 students, 76% FRL); Dorman High (math 46% / reading 78%, grade B-, #99 of 196 statewide, top 53%, 3,808 students, 75% FRL) — zoned schools average 76% FRL vs 48% district-wide (27 pts higher); higher-poverty schools than district average — tighter screening recommended.
- Zoned-school proficiency averages 52% at this address vs 38% district-wide (+14 pts) — the actual schools serving this property are materially stronger than the Spartanburg 06 average implies; a family-tenant draw the district grade alone would hide.
- Market conditions: Rents soft (-2.6%/yr); 466 active listings in the ZIP; 12 comparable units currently listed for rent nearby; rentals at typical pace (median 21d on market — plan ~3-4 weeks tenant-placement turnaround); 3,129 units permitted in Spartanburg County in 2024 (40 in 5+ unit buildings).
- This rent runs 34% of the median local income ($58k/yr) — at the standard rent-burdened threshold; future hikes will face affordability resistance.
Forward outlook
- Local home prices are declining (-3.0%/yr); year-one equity from $1k of loan paydown is wiped out by about $5k of value loss. Plan a longer hold.
- Spartanburg County population projected at +18% by 2050 — long-run rental-demand tailwind backs the buy-and-hold thesis.
Negotiation context
- It's been on market 23 days — a 2% lower offer ($163k) is reasonable based on typical stale-listing flexibility.
- Current owner paid $90k; list at $165k implies a 84% gain — meaningful room to come down on a strong offer.
Risks & watch-outs
- Climate carrying-cost: extreme-heat days projected 7→16/yr by 2055 (HVAC capex compounding) — expect insurance premiums to compound above CPI over the hold.
Questions for the listing agent
- Built in 1971 — when were the roof, HVAC, electrical panel, plumbing, and water heater last replaced?
- Is there a deadline driving the sale (1031 exchange, divorce, estate, relocation)? That informs how much negotiation room exists.
- Schools are D-rated, which usually means shorter tenancies and higher turnover. Who's the typical renter profile here, and what's been the actual vacancy rate?
- Crime grade is F in this area — have there been break-ins, vandalism, or insurance claims at this property in the last 3 years? What carrier currently insures it and at what premium?
- What's the average days-on-market for RENTAL listings here right now (not sales)? A rising rental-DOM trend means longer vacancies and softer asking-rent achievability than the comps imply.
- What's the recent tenant-quality profile in this submarket — average credit score on applications, eviction rate, late-payment / NSF rate, and stable-employment percentage? A property-management company in the area should have these aggregated.
- How much new for-sale + rental construction is in the pipeline within 1–3 miles? Heavy new supply typically softens prices + rents 12–24 months out; constrained supply supports both.
Investment metrics
- 1% rule
- 1.00% ✓
- Cap rate
- 8.24%
- Cash-on-cash
- 6.97%
- DSCR
- 1.31
- GRM
- 8.3
CMA / ARV
- ARV (on-the-fly)
- $250,560
- Comps found
- 12
Show comp detail 12 sales within ~0.75 mi
| Address | Dist | Beds/Ba | Sqft | Sold | Price | $/sf | Match |
|---|---|---|---|---|---|---|---|
| 322 Seven Oaks Ln | 0.29mi | 4/2.0 | 1,919 (+10%) | 7mo | $260,000 | $135 | 64 |
| 219 Seven Oaks Ln | 0.53mi | 3/2.0 (-1) | 1,657 (-5%) | 2mo | $247,000 | $149 | 61 |
| 109 Pawnee Dr | 0.57mi | 3/1.5 (-1) | 1,795 (+3%) | 0mo | $240,000 | $134 | 61 |
| 211 Saint Matthews St | 0.43mi | 3/2.0 (-1) | 1,655 (-5%) | 11mo | $239,000 | $144 | 58 |
| 103 Windy Rush Rd | 0.66mi | 3/2.0 (-1) | 1,676 (-4%) | 0mo | $249,000 | $149 | 58 |
| 208 Saint Matthews Ln | 0.41mi | 3/2.0 (-1) | 1,500 (-14%) | 6mo | $234,900 | $157 | 48 |
| 209 Heather Dr | 0.37mi | 3/2.5 (-1) | 1,560 (-10%) | 15mo | $185,000 | $119 | 46 |
| 201 Sheffield Dr | 0.43mi | 3/2.5 (-1) | 1,523 (-12%) | 13mo | $140,000 | $92 | 41 |
| 123 Stribling Cir | 0.71mi | 3/2.0 (-1) | 1,911 (+10%) | 10mo | $390,000 | $204 | 37 |
| 109 Driftway Pl | 0.69mi | 3/2.0 (-1) | 1,522 (-12%) | 10mo | $254,000 | $167 | 34 |
| 150 Cornelius Rd. Rd | 0.68mi | 3/2.0 (-1) | 1,982 (+14%) | 11mo | $285,000 | $144 | 31 |
| 162 Cornelius Rd | 0.73mi | 5/2.0 (+1) | 1,962 (+13%) | 15mo | $263,000 | $134 | 27 |
Match score weights: distance 35% · size 25% · config 20% · recency 20%. Top-matched comps best support the ARV.
Projected returns pro-forma
-3.0% appreciation · 0.0% rent growth · sell at horizon
- IRR
- -8.8%
- Equity multiple
- 0.69×
- Total profit
- $-14,536
- Equity at exit
- $24,602
- IRR
- -3.5%
- Equity multiple
- 0.79×
- Total profit
- $-9,530
- Equity at exit
- $14,266
Cash invested: $46,200 (down + closing). Projections, not guarantees.
Landlord ↔ Tenant lean methodology
- Overall (STATE)
- 90 Strongly Landlord-Friendly
- State South Carolina
- 90 Strongly Landlord-Friendly · R+6
- County
- — inherits STATE
- City
- — inherits STATE
ZIP-level market 29301
- Home prices YoY
- -25.3%
- Rents YoY
- -2.6%
- Active inventory
- 466
- Price-to-rent
- 8.3×
Monthly cashflow live
- Estimated rent
- $1,652 high interval (Pro) →
- Mortgage (P&I)
- −$865
- Tax from tax record
- −$103 /mo · $1,236/yr
- Insurance
- −$69
- HOA
- −$0
- Vacancy / Maint / Mgmt
- −$347
- Net cashflow
- $268
Break-even live
UW: 25.0% down · 7.5% · 30yr · 1.5% tax · 5.0% vac · 8.0% maint · 8.0% mgmt
Financing live
Cash to close
- Down payment
- $41,250
- Closing costs
- $4,950
- Reserves months
- —
- Total cash needed
- —
Loan-product check · same deal, 3 products live
Conventional
25% down · 7.5% · 30yr
- Down + closing
- —
- Monthly P&I
- —
- Monthly cashflow
- —
- DSCR
- —
- Eligible?
- —
Personal DTI + credit; lowest rate.
DSCR
20% down · 8.5% · 30yr
- Down + closing
- —
- Monthly P&I
- —
- Monthly cashflow
- —
- DSCR
- —
- Eligible?
- —
No personal income docs; deal must DSCR.
Hard money
10% down · 12.0% · 12mo
- Down + closing
- —
- Monthly P&I
- —
- Monthly cashflow
- —
- DSCR
- —
- Eligible?
- —
Short-term bridge; refi at stabilization.
Rent comps 12 comps
| Address | Beds | Baths | Sqft | Rent | $/sqft | DOM | Units | Dist |
|---|---|---|---|---|---|---|---|---|
| 1480 Wo Ezell Blvd Spartanburg, SC | 2.0–3.0 | 1.0–2.0 | 1050 | $1,224 | $1.17 | 13d | 4 | 0.27mi |
| 416 W Parima Ct Spartanburg, SC | 3.0 | 2.5 | 1616 | $1,800 | $1.11 | 21d | 1 | 0.30mi |
| 201 Powell Mill Rd Spartanburg, SC | 1.0–3.0 | 1.0–2.0 | 1426 | $1,345 | $0.94 | 13d | 23 | 0.44mi |
| 311 Weststone Walk Spartanburg, SC | 3.0 | 2.5 | 1501 | $1,695 | $1.13 | 21d | 1 | 0.81mi |
| 110 Southport Rd Spartanburg, SC | 1.0–3.0 | 1.0–2.0 | 1044 | $1,673 | $1.60 | 13d | 18 | 1.03mi |
| 1451 Darrowby Way Spartanburg, SC | 3.0 | 2.5 | 1670 | $1,850 | $1.11 | 21d | 1 | 1.11mi |
| 30 Beverly Hills Dr Spartanburg, SC | 3.0 | 2.5 | 1368 | $1,575 | $1.15 | 21d | 1 | 1.21mi |
| 32 Beverly Hills Spartanburg, SC | 3.0 | 2.5 | 1368 | $1,425 | $1.04 | 13d | 1 | 1.22mi |
| 235 Vanderbilt Rd Spartanburg, SC | 3.0 | 2.5 | 1300 | $1,844 | $1.42 | 21d | 1 | 1.24mi |
| 142 Harmony Dr Spartanburg, SC | 4.0 | 2.0 | 1221 | $1,595 | $1.31 | 13d | 1 | 1.26mi |
| 267 Vanderbilt Rd Spartanburg, SC | 3.0 | 2.5 | 1300 | $1,795 | $1.38 | 21d | 1 | 1.31mi |
| 275 Vanderbilt Spartanburg, SC | 3.0 | 2.5 | 1300 | $1,495 | $1.15 | 13d | 1 | 1.32mi |
Listing history 18 events
-
2026-06-18days on market $165,000 Active 23 DOM
-
2026-06-17days on market $165,000 Active 22 DOM
-
2026-06-16price $165,000 Active 21 DOM
-
2026-06-16days on market $180,000 Active 21 DOM
-
2026-06-15days on market $180,000 Active 20 DOM
-
2026-06-14days on market $180,000 Active 18 DOM
-
2026-06-13days on market $180,000 Active 17 DOM
-
2026-06-10days on market $180,000 Active 15 DOM
-
2026-06-09days on market $180,000 Active 14 DOM
-
2026-06-08days on market $180,000 Active 13 DOM
-
2026-06-07days on market $180,000 Active 12 DOM
-
2026-06-02days on market $180,000 Active 7 DOM
-
2026-06-01days on market $180,000 Active 6 DOM
-
2026-05-31days on market $180,000 Active 5 DOM
-
2026-05-30days on market $180,000 Active 4 DOM
-
2026-05-26$180,000 Active
-
1993-12-01soldstatus $89,900
-
1991-08-01soldstatus $75,000
ⓘ Source: listings_history table (triggers on properties + properties_extension) + one-shot
backfill from property_details.listing_events for pre-trigger history.
Tax reassessment forecast SC · Resets to sale price
- Current annual tax
- $1,236 · $103/mo
- Projected year-2 tax
- $1,236 · $103/mo
- Expected delta
- $0/yr ($0/mo · 0.0%)
ⓘ Screening estimate from a state-policy table — verify with the county assessor before closing.
Climate risk First Street
- Flood 1/10 Low FEMA zone X (unshaded) · 0% chance over 30 yrs
- Wildfire 1/10 Low
- Heat 6/10 Major 7 d/yr ≥105°F today · 16 d/yr by 30 yrs out
- Wind 2/10 Low 2% chance of damaging wind over 30 yrs
- Air quality 4/10 Moderate 4 unhealthy d/yr today · 5 by 30 yrs out
Nearby sold comps map
Loading sold comps map…
Walkable amenities ~0.75 mi
Loading nearby amenities…
Taxation est. · year 1
- Rental income
- $19,826
- − Mortgage interest
- −$9,243
- − Property taxes
- −$1,236
- − Insurance
- −$825
- − Repairs & maintenance
- −$1,586
- − Management
- −$1,586
- − Depreciation
- −$4,800
- Taxable income
- $550
- Est. tax owed @ 24.0%
- −$132
- After-tax cash flow
- $3,086/yr
For passive investors: Depreciation is non-cash, so a rental often shows a tax loss while cash-flowing — sheltering income. Rental losses are passive: they offset passive income freely, and up to $25,000/yr can offset ordinary (W-2) income if you actively participate and your MAGI is under $100k (phasing out to $0 by $150k); unused losses carry forward. On sale, claimed depreciation is recaptured at up to 25%, and gains may owe capital-gains tax (a 1031 exchange can defer both). Figures are a year-1 estimate at your 24.0% rate — not tax advice; consult a CPA.
Schools (NCES district)
- District
- Spartanburg 06
- NCES district ID
- 4503630
- Math proficiency
- 33% ▼ -8.00%
- Reading proficiency
- 42% ▼ -2.00%
- Median HH income
- $46,110
- Composite
- 32.02/100
- National rank
- #5827
- State rank
- #35 of 80 in SC
Livability — Spartanburg
- Score
- 76/100
- State rank
- #24
- US rank
- #3679
Category grades
Schools grade is shown separately in the Schools card above.
Census & demographics
- Census place
- Spartanburg, SC
- County
- Spartanburg County · 258,607 people
- City population
- 120,406
- Metro
- Spartanburg, SC
- Population (ZIP)
- 36,278
- Household income
- $57,805
- Rent vs Own
- Severe rent burden
- 1331.0
Population outlook (Spartanburg County) Hauer SSP2
- Today (2025)
- 325,495 people
- By 2030
- 338,800 · +4.1%
- By 2040
- 363,471 · +11.7%
- By 2050
- 384,156 · +18.0%
- By 2075
- 430,137 · +32.1%
- By 2100
- 442,733 · +36.0%
Race, ethnicity, and origin ACS 2023
- Neighborhood character
- Diverse neighborhood (Simpson 0.67)
- Race & ethnicity
- White 45% Black 32% Hispanic / Latino 13% Two or more races 9% Asian 5%
- Hispanic origin (detail)
- Mexican 7% Puerto Rican 2%
- Common ancestry
- Slovak 2% Lithuanian 1% Italian 1%
- Foreign-born
- 12% · Canada, China, Vietnam
- Languages at home
- 83% English-only · Spanish 10% Other Indo-European 3% Other Asian/Pacific 1%
Political lean MEDSL · Spartanburg
- 2024 margin
- Solid R (+33.6) · D 32.6% · R 66.2% · Other 1.2%
- 2008→2024 swing
- -12.0pp toward R · 2008: -21.6pp · 2024: -33.6pp
- All cycles
- 2024: R+33.6 2020: R+27.3 2016: R+30.0 2012: R+23.1 2008: R+21.6
Not yet ingested
- Civics
- —
Market trends
- HPI YoY
- ▼ -77.19%
- Current HPI
- 228.4172
- Rent YoY
- ▼ -2.64%
- Metro
- Spartanburg, SC
- State GDP YoY
- ▲ 4.51%
- F500 in state
- 2
Industry mix (Fortune 500 HQ in SC)
| Industry | F500 HQs | Revenue |
|---|---|---|
| Packaging | 1 | $7B |
|
||
Price history
+140.0% since first listed3 events — show timeline
- 2026-05-26 Listed $180,000 SPMLS
- 1993-12-01 Sold (Public Records) $89,900 Public Records
- 1991-08-01 Sold (Public Records) $75,000 Public Records
Property tax history
-0.5%/yrLatest (2025): $1,236 · +0.8% YoY. Source: county tax records.
Cash-flow waterfall
monthlySold comps — $/sqft
last 12 mo · ≤1 miLoading sold comps…