117 E 9 St · Scotland Neck, NC
Flood risk 1/10 · Minimal
- FEMA flood zone
- X (unshaded)
- Chance of flooding over 30 yrs
- 0.0%
- Est. flood insurance / yr
- $507 – $1,088
Fire risk 3/10 · Minor
- Est. fire insurance / yr
- $906 – $1,684
Heat risk 8/10 · Major
- Hot days now (above 108°F)
- 7 days/yr
- Hot days in 30 yrs
- 17 days/yr
Wind risk 7/10 · Major
- Chance of severe wind over 30 yrs
- 75.0%
Air-quality risk 2/10 · Minimal
- Unhealthy air days now
- 0 days/yr
- Unhealthy air days in 30 yrs
- 1 days/yr
Risk factors via First Street. Map © Google.
Why this score? — see what drove the F grade
The composite is a weighted blend of 9 inputs, each scored 0–100. Each bar is that input's sub-score; the figure is the points it added to the 100-point composite (weight × sub-score).
- Cash flow +7.8/30.0
- ARV discount +7.5/15.0
- Appreciation +6.7/10.0
- Livability +2.9/5.0
- Rent growth +2.5/5.0
- Condition / age +2.5/5.0
- DSCR +1.9/10.0
- 1% rule +1.5/10.0
- Schools +1.2/10.0
$170,000
🖨 Deal sheet 📄 Offer letter ✓ Due diligence
Listing remarks
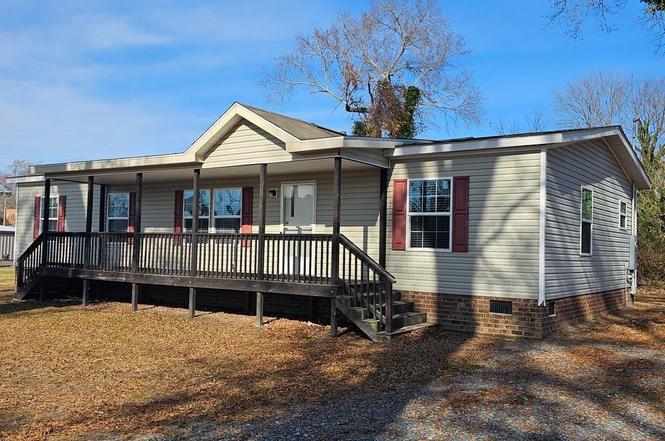
Welcome home to this 2017 one-owner doublewide offering 4 bedrooms and 2 full baths, situated on a large corner lot in the heart of Scotland Neck. This home is move-in ready with low maintenance, featuring a brand-new roof and gutters (2025)—a major recent upgrade that adds value and reduces future expenses. Inside, enjoy a cozy wood-burning fireplace, perfect for cool evenings, while outside a long, welcoming porch provides the ideal spot for morning coffee, rocking chairs, or visiting with neighbors. The seller has only occupied the home since 2024, and it shows pride of ownership throughout. The property includes two nice outbuildings, perfect for storage, hobbies, or a workshop. E
Key facts
- Large corner lot
- Brand new roof
- Long welcoming porch
Tags
Property features AI
Exterior
- Parking: Has carport
- Utilities: Public water; Public sewer
- Home design: Residential property; Residential/Vacation subtype; Double wide mobile home; One level
- Construction: Vinyl siding; Block foundation; Other foundation
- Exterior features: Front porch; Has a view; Paved road access
Interior
- Kitchen: Electric oven; Electric range; Refrigerator; Dishwasher
- Bedrooms: Total rooms: 7
- Bathrooms: 2 full bathrooms
- Heating & cooling: Central air conditioning; Electric heating
- Interior features: Fireplace in living room (wood-burning); Other interior features
Neighborhood map
What this means for you Summary
Snapshot
- This is a 3-bed/2.0-bath manufactured listed at $170k.
Deal economics
- At list price, monthly cash flow is $-190 ($-2k/yr) — negative.
- To cash-flow at today's rent, offer at most $137k (19.7% below list).
- To meet the 1% rule (rent ≥ 1% of price), the offer needs to be $111k (34.9% below list).
- Recommended offer: $111k (34.9% below list) — sets the bar for 1% rule.
Location & tenants
- Location reads 58/100 on livability (#566 in NC) — a working-class tenant base; expect higher turnover. Strengths: cost of living A+, health & safety A, crime A-; Watch: housing D, amenities F, commute F.
- Halifax County Schools (rural): math 6% / reading 24% proficiency, ranked #177 of 178 in NC (top 99%) — low school quality limits family demand, transient renter base, plan for 1-2y turnover; 82% free/reduced lunch — lower-income household profile, screen leases tightly.
- Zoned schools: Scotland Neck Elementary Leadership Acad (math 2% / reading 17%, grade F, #1,385 of 1,410 statewide, top 99%, 149 students, 98% FRL); Halifax County Early College High (math 75% / reading 70%, grade B+, #106 of 535 statewide, top 20%, 128 students, 98% FRL) — zoned schools average 98% FRL vs 82% district-wide (16 pts higher); higher-poverty schools than district average — tighter screening recommended.
- Zoned-school proficiency averages 41% at this address vs 15% district-wide (+26 pts) — the actual schools serving this property are materially stronger than the Halifax County Schools average implies; a family-tenant draw the district grade alone would hide.
- Market conditions: 22 active listings in the ZIP; 55 units permitted in Halifax County in 2024 (0 in 5+ unit buildings).
Forward outlook
- In year one you build about $7k of equity ($1k loan paydown + $6k appreciation (3.5% local appreciation)).
- Halifax County population projected at -27% by 2050 — secular population decline; favor cash flow + early exit over multi-decade hold.
- By year 5, paydown + projected appreciation supports a ~$31k cash-out refi (75% LTV) — recoverable capital for the next deal without selling this one.
Negotiation context
- It's been on market 148 days — a 12% lower offer ($150k) is reasonable based on typical stale-listing flexibility.
- 2 sale attempts since 3y ago; this cycle's ask is 3% above the opening price — seller raised mid-cycle; expect resistance to lowballs.
Risks & watch-outs
- Climate carrying-cost: major wind risk, 75% chance of damaging wind over 30y; extreme-heat days projected 7→17/yr by 2055 (HVAC capex compounding) — expect insurance premiums to compound above CPI over the hold.
Questions for the listing agent
- What do current leases actually rent for vs. the listed asking? Can we see a recent rent roll and the last 12 months of T-12 income?
- It's been on market 148 days. Have you received any prior offers? Is the seller open to a 35% concession, seller financing, or rate buy-down credit?
- Why hasn't it sold? Are there any deal-killer items the seller is aware of (foundation, flood, title, zoning, code violations)?
- Is there a deadline driving the sale (1031 exchange, divorce, estate, relocation)? That informs how much negotiation room exists.
- Schools are F-rated, which usually means shorter tenancies and higher turnover. Who's the typical renter profile here, and what's been the actual vacancy rate?
- The area grade is low — what's the realistic commute time and amenity access for the typical tenant pool here? Any planned neighborhood developments (good or bad) we should know about?
- What's the average days-on-market for RENTAL listings here right now (not sales)? A rising rental-DOM trend means longer vacancies and softer asking-rent achievability than the comps imply.
- What's the recent tenant-quality profile in this submarket — average credit score on applications, eviction rate, late-payment / NSF rate, and stable-employment percentage? A property-management company in the area should have these aggregated.
- How much new for-sale + rental construction is in the pipeline within 1–3 miles? Heavy new supply typically softens prices + rents 12–24 months out; constrained supply supports both.
Investment metrics
- 1% rule
- 0.65% ✗
- Cap rate
- 4.95%
- Cash-on-cash
- -4.78%
- DSCR
- 0.79
- GRM
- 12.8
CMA / ARV
No comps found within radius.
Projected returns pro-forma
3.5% appreciation · 3.0% rent growth · sell at horizon
- IRR
- 4.6%
- Equity multiple
- 1.27×
- Total profit
- $12,858
- Equity at exit
- $81,234
- IRR
- 7.5%
- Equity multiple
- 2.20×
- Total profit
- $57,188
- Equity at exit
- $129,055
Cash invested: $47,600 (down + closing). Projections, not guarantees.
Landlord ↔ Tenant lean methodology
- Overall (STATE)
- 85 Strongly Landlord-Friendly
- State North Carolina
- 85 Strongly Landlord-Friendly · R+3
- County
- — inherits STATE
- City
- — inherits STATE
ZIP-level market 27874
- Home prices YoY
- 2.0%
- Active inventory
- 22
- Price-to-rent
- 12.8×
Monthly cashflow live
- Estimated rent
- $1,107 medium interval (Pro) →
- Mortgage (P&I)
- −$891
- Tax from tax record
- −$102 /mo · $1,221/yr
- Insurance
- −$71
- HOA
- −$0
- Vacancy / Maint / Mgmt
- −$232
- Net cashflow
- $-190
Break-even live
UW: 25.0% down · 7.5% · 30yr · 1.5% tax · 5.0% vac · 8.0% maint · 8.0% mgmt
Financing live
Cash to close
- Down payment
- $42,500
- Closing costs
- $5,100
- Reserves months
- —
- Total cash needed
- —
Loan-product check · same deal, 3 products live
Conventional
25% down · 7.5% · 30yr
- Down + closing
- —
- Monthly P&I
- —
- Monthly cashflow
- —
- DSCR
- —
- Eligible?
- —
Personal DTI + credit; lowest rate.
DSCR
20% down · 8.5% · 30yr
- Down + closing
- —
- Monthly P&I
- —
- Monthly cashflow
- —
- DSCR
- —
- Eligible?
- —
No personal income docs; deal must DSCR.
Hard money
10% down · 12.0% · 12mo
- Down + closing
- —
- Monthly P&I
- —
- Monthly cashflow
- —
- DSCR
- —
- Eligible?
- —
Short-term bridge; refi at stabilization.
Listing history 18 events
-
2026-06-19days on market $170,000 Active 148 DOM
-
2026-06-18days on market $170,000 Active 147 DOM
-
2026-06-17days on market $170,000 Active 146 DOM
-
2026-06-16days on market $170,000 Active 145 DOM
-
2026-06-15days on market $170,000 Active 144 DOM
-
2026-06-14days on market $170,000 Active 142 DOM
-
2026-06-12days on market $170,000 Active 141 DOM
-
2026-06-09days on market $170,000 Active 138 DOM
-
2026-06-08days on market $170,000 Active 137 DOM
-
2026-06-07days on market $170,000 Active 136 DOM
-
2026-06-07days on market $170,000 Active 135 DOM
-
2026-06-02days on market $170,000 Active 131 DOM
-
2026-06-01days on market $170,000 Active 130 DOM
-
2026-05-31days on market $170,000 Active 129 DOM
-
2026-05-30days on market $170,000 Active 128 DOM
-
2026-01-22price $170,000
-
2026-01-22$165,000 Active
-
2023-12-09$134,900 Active
ⓘ Source: listings_history table (triggers on properties + properties_extension) + one-shot
backfill from property_details.listing_events for pre-trigger history.
Tax reassessment forecast NC · Resets to sale price
- Current annual tax
- $1,221 · $102/mo
- Projected year-2 tax
- $1,394 · $116/mo
- Expected delta
- +$173/yr (+$14/mo · 14.1%)
ⓘ Screening estimate from a state-policy table — verify with the county assessor before closing.
Climate risk First Street
- Flood 1/10 Low FEMA zone X (unshaded) · 0% chance over 30 yrs
- Wildfire 3/10 Moderate
- Heat 8/10 Severe 7 d/yr ≥108°F today · 17 d/yr by 30 yrs out
- Wind 7/10 Severe 75% chance of damaging wind over 30 yrs
- Air quality 2/10 Low 0 unhealthy d/yr today · 1 by 30 yrs out
Nearby sold comps map
Loading sold comps map…
Walkable amenities ~0.75 mi
Loading nearby amenities…
Taxation est. · year 1
- Rental income
- $13,284
- − Mortgage interest
- −$9,523
- − Property taxes
- −$1,221
- − Insurance
- −$850
- − Repairs & maintenance
- −$1,063
- − Management
- −$1,063
- − Depreciation
- −$4,945
- Taxable loss
- −$5,381
- Est. tax savings @ 24.0%
- +$1,292
- After-tax cash flow
- $-984/yr
For passive investors: Depreciation is non-cash, so a rental often shows a tax loss while cash-flowing — sheltering income. Rental losses are passive: they offset passive income freely, and up to $25,000/yr can offset ordinary (W-2) income if you actively participate and your MAGI is under $100k (phasing out to $0 by $150k); unused losses carry forward. On sale, claimed depreciation is recaptured at up to 25%, and gains may owe capital-gains tax (a 1031 exchange can defer both). Figures are a year-1 estimate at your 24.0% rate — not tax advice; consult a CPA.
Schools (NCES district)
- District
- Halifax County Schools
- NCES district ID
- 3701950
- Math proficiency
- 6% ▼ -11.00%
- Reading proficiency
- 24% ▼ -1.00%
- Median HH income
- $29,104
- Composite
- 11.7/100
- National rank
- #9690
- State rank
- #177 of 178 in NC
Livability — Scotland Neck
- Score
- 58/100
- State rank
- #566
- US rank
- #20832
Category grades
Schools grade is shown separately in the Schools card above.
Census & demographics
- Census place
- Scotland Neck, NC
- City population
- 3,677
- Population (ZIP)
- 3,677
Population outlook (Halifax County) Hauer SSP2
- Today (2025)
- 47,976 people
- By 2030
- 45,450 · -5.3%
- By 2040
- 39,980 · -16.7%
- By 2050
- 34,863 · -27.3%
- By 2075
- 25,577 · -46.7%
- By 2100
- 18,365 · -61.7%
Race, ethnicity, and origin ACS 2023
- Neighborhood character
- Predominantly Black (74%)
- Race & ethnicity
- Black 74% White 25%
- Common ancestry
- Slovak 2% Italian 2% Romanian 1%
- Foreign-born
- 1% · Canada
- Languages at home
- 99% English-only · German/W. Germanic 1%
Political lean MEDSL · Halifax
- 2024 margin
- D (+17.7) · D 58.5% · R 40.9%
- 2008→2024 swing
- -10.6pp toward R · 2008: 28.2pp · 2024: 17.7pp
- All cycles
- 2024: D+17.7 2020: D+21.2 2016: D+26.9 2012: D+32.0 2008: D+28.2
Not yet ingested
- Civics
- —
Market trends
- HPI YoY
- ▲ 3.50%
- Current HPI
- 180.5586
- Rent YoY
- —
- Metro
- —
- State GDP YoY
- ▲ 3.28%
- F500 in state
- 26
Industry mix (Fortune 500 HQ in NC)
| Industry | F500 HQs | Revenue |
|---|---|---|
| Financial Services | 2 | $213B |
|
||
| Retail | 2 | $95B |
|
||
| Industrial Conglomerate | 1 | $38B |
|
||
| Metals / Steel | 1 | $35B |
|
||
| Utilities | 1 | $30B |
|
||
| Industrial Machinery | 1 | $19B |
|
||
Price history
+26.0% since first listed3 events — show timeline
- 2026-01-22 Price Changed $170,000 RVLG
- 2026-01-22 Listed $165,000 RVLG
- 2023-12-09 Listed $134,900 RVLG
Property tax history
+55.1%/yrLatest (2024): $1,221 · +8.1% YoY. Source: county tax records.
Cash-flow waterfall
monthlySold comps — $/sqft
last 12 mo · ≤1 miLoading sold comps…