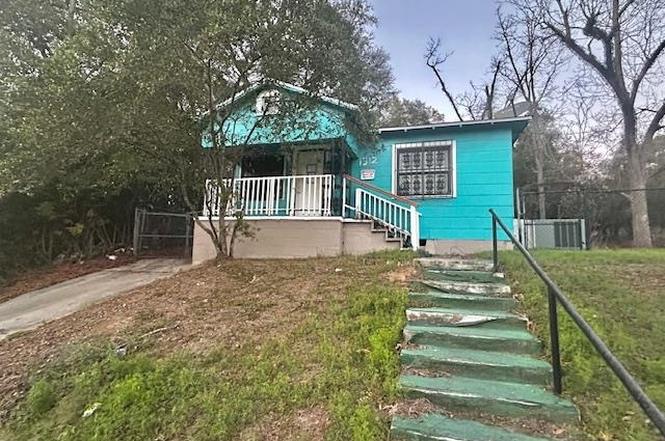
1312 Alabama St · Tallahassee, FL
Flood risk 1/10 · Minimal
- FEMA flood zone
- X (unshaded)
- Chance of flooding over 30 yrs
- 0.0%
- Est. flood insurance / yr
- $507 – $1,088
Fire risk 1/10 · Minimal
- Est. fire insurance / yr
- $947 – $1,759
Heat risk 8/10 · Major
- Hot days now (above 108°F)
- 7 days/yr
- Hot days in 30 yrs
- 20 days/yr
Wind risk 9/10 · Severe
- Chance of severe wind over 30 yrs
- 99.0%
Air-quality risk 5/10 · Moderate
- Unhealthy air days now
- 7 days/yr
- Unhealthy air days in 30 yrs
- 7 days/yr
Risk factors via First Street. Map © Google.
Why this score? — see what drove the B grade
The composite is a weighted blend of 9 inputs, each scored 0–100. Each bar is that input's sub-score; the figure is the points it added to the 100-point composite (weight × sub-score).
- Cash flow +30.0/30.0
- 1% rule +10.0/10.0
- DSCR +10.0/10.0
- ARV discount +7.5/15.0
- Schools +4.3/10.0
- Livability +4.3/5.0
- Rent growth +3.7/5.0
- Condition / age +2.5/5.0
- Appreciation +0.0/10.0
$59,900
🖨 Deal sheet 📄 Offer letter ✓ Due diligence
Listing remarks
Great opportunity for a first-time buyer or investor on a generous lot in a convenient in-town location. Directly across the street, a new community grocery store is planned as part of the ongoing Griffin Heights neighborhood investment, adding long-term value and everyday convenience. Close to universities, restaurants, schools, and parks. A rare find in today’s market with strong potential. Cash only. Sold as-is with right to inspect.
Key facts
- Close to parks
- Close to restaurants
- Close to schools
Tags
Property features AI
Finance
- Financial info: Property is listed for sale
Exterior
- Parking: Driveway
- Home design: Single-story home
- Exterior features: Paved public road access
Interior
- Kitchen: Kitchen — 7 x 8
- Bedrooms: Bedroom 2 — 11 x 10
- Flooring: Carpet
- Bathrooms: 1 full bathroom
- Interior features: Carpet flooring; Additional unspecified interior feature
Neighborhood map
What this means for you Summary
Snapshot
- This is a 2-bed/1.0-bath single-family listed at $60k.
Deal economics
- At list price, monthly cash flow is $577 ($7k/yr) — positive.
- The deal already cash-flows at list — no discount required.
- Meets the 1% rule at list price ($1k rent vs $60k).
- Recommended offer: $53k (12.0% below list) — sets the bar for market timing.
- Cap rate 17.9% vs local median 4.2% in Tallahassee — top-decile yield for the area; either an underpriced asset or a hidden risk that comps aren't pricing in. Stress-test before assuming the spread holds.
Location & tenants
- Location reads 86/100 on livability (#19 in FL, #429 nationally) — a professional / high-income tenant draw. Strengths: amenities A+, commute A+, health & safety A+; Watch: employment D.
- Leon (urban): math 48% / reading 53% proficiency, ranked #33 of 73 in FL (top 45%) — acceptable for families but not a draw, mixed tenant base, ~2y average lease.
- Market conditions: Rents rising fast (+4.7%/yr); 142 active listings in the ZIP; 34 comparable units currently listed for rent nearby; rentals at typical pace (median 21d on market — plan ~3-4 weeks tenant-placement turnaround); lower-income renter base — watch delinquency; 1,765 units permitted in Leon County in 2024 (975 in 5+ unit buildings).
- This rent runs 45% of the median local income ($32k/yr) — at the standard rent-burdened threshold; future hikes will face affordability resistance.
Forward outlook
- Local home prices are declining (-3.0%/yr); year-one equity from $414 of loan paydown is wiped out by about $2k of value loss. Plan a longer hold.
- Leon County population projected at +23% by 2050 — long-run rental-demand tailwind backs the buy-and-hold thesis.
- At projected returns (-3.0% appreciation + 4.7% rent growth), your $17k cash investment doubles in ~3 years — after that, you're playing with house money.
Negotiation context
- It's been on market 139 days — a 12% lower offer ($53k) is reasonable based on typical stale-listing flexibility.
Risks & watch-outs
- Watch-outs: built in 1956 — expect roof / HVAC / electrical / plumbing capex.
- Climate carrying-cost: severe wind risk, 99% chance of damaging wind over 30y; extreme-heat days projected 7→20/yr by 2055 (HVAC capex compounding) — expect insurance premiums to compound above CPI over the hold.
Questions for the listing agent
- It's been on market 139 days. Have you received any prior offers? Is the seller open to a 12% concession, seller financing, or rate buy-down credit?
- Built in 1956 — when were the roof, HVAC, electrical panel, plumbing, and water heater last replaced?
- Why hasn't it sold? Are there any deal-killer items the seller is aware of (foundation, flood, title, zoning, code violations)?
- Is there a deadline driving the sale (1031 exchange, divorce, estate, relocation)? That informs how much negotiation room exists.
- Schools are B-rated — typically a magnet for longer-tenancy family renters. What's the average tenant stay here, and is there a school-zone premium baked into asking?
- What's the average days-on-market for RENTAL listings here right now (not sales)? A rising rental-DOM trend means longer vacancies and softer asking-rent achievability than the comps imply.
- What's the recent tenant-quality profile in this submarket — average credit score on applications, eviction rate, late-payment / NSF rate, and stable-employment percentage? A property-management company in the area should have these aggregated.
- How much new for-sale + rental construction is in the pipeline within 1–3 miles? Heavy new supply typically softens prices + rents 12–24 months out; constrained supply supports both.
Investment metrics
- 1% rule
- 2.02% ✓
- Cap rate
- 17.85%
- Cash-on-cash
- 41.28%
- DSCR
- 2.84
- GRM
- 4.1
CMA / ARV
- ARV (on-the-fly)
- $125,184
- Comps found
- 5
Show comp detail 5 sales within ~0.75 mi
| Address | Dist | Beds/Ba | Sqft | Sold | Price | $/sf | Match |
|---|---|---|---|---|---|---|---|
| 1124 Abraham St | 0.20mi | 2/1.0 | 758 (-1%) | 23mo | $141,000 | $186 | 70 |
| 1326 Volusia St | 0.13mi | 3/2.0 (+1) | 836 (+9%) | 17mo | $136,250 | $163 | 56 |
| 1233 Volusia St | 0.12mi | 3/2.0 (+1) | 868 (+13%) | 15mo | $125,000 | $144 | 51 |
| 658 W 5th Ave | 0.69mi | 2/1.0 | 825 (+7%) | 21mo | $90,000 | $109 | 38 |
| 812 W Georgia St | 0.71mi | 3/3.0 (+1) | 788 (+3%) | 18mo | $150,000 | $190 | 34 |
Match score weights: distance 35% · size 25% · config 20% · recency 20%. Top-matched comps best support the ARV.
Projected returns pro-forma
-3.0% appreciation · 4.69% rent growth · sell at horizon
- IRR
- 39.7%
- Equity multiple
- 2.74×
- Total profit
- $29,132
- Equity at exit
- $8,931
- IRR
- 46.8%
- Equity multiple
- 5.86×
- Total profit
- $81,571
- Equity at exit
- $5,179
Cash invested: $16,772 (down + closing). Projections, not guarantees.
Landlord ↔ Tenant lean methodology
- Overall (STATE)
- 87 Strongly Landlord-Friendly
- State Florida
- 87 Strongly Landlord-Friendly · R+3
- County
- — inherits STATE
- City
- — inherits STATE
ZIP-level market 32304
- Home prices YoY
- -21.2%
- Rents YoY
- 4.7%
- Active inventory
- 142
- Price-to-rent
- 4.1×
Monthly cashflow live
- Estimated rent
- $1,212 high interval (Pro) →
- Mortgage (P&I)
- −$314
- Tax from tax record
- −$41 /mo · $493/yr
- Insurance
- −$25
- HOA
- −$0
- Vacancy / Maint / Mgmt
- −$254
- Net cashflow
- $577
Break-even live
UW: 25.0% down · 7.5% · 30yr · 1.5% tax · 5.0% vac · 8.0% maint · 8.0% mgmt
Financing live
Cash to close
- Down payment
- $14,975
- Closing costs
- $1,797
- Reserves months
- —
- Total cash needed
- —
Loan-product check · same deal, 3 products live
Conventional
25% down · 7.5% · 30yr
- Down + closing
- —
- Monthly P&I
- —
- Monthly cashflow
- —
- DSCR
- —
- Eligible?
- —
Personal DTI + credit; lowest rate.
DSCR
20% down · 8.5% · 30yr
- Down + closing
- —
- Monthly P&I
- —
- Monthly cashflow
- —
- DSCR
- —
- Eligible?
- —
No personal income docs; deal must DSCR.
Hard money
10% down · 12.0% · 12mo
- Down + closing
- —
- Monthly P&I
- —
- Monthly cashflow
- —
- DSCR
- —
- Eligible?
- —
Short-term bridge; refi at stabilization.
Rent comps 34 comps
| Address | Beds | Baths | Sqft | Rent | $/sqft | DOM | Units | Dist |
|---|---|---|---|---|---|---|---|---|
| 1410 Nylic St Unit B Tallahassee, FL | 2.0 | 1.0 | 550 | $900 | $1.64 | 13d | 1 | 0.32mi |
| 836 Richmond St Unit 10 Tallahassee, FL | 1.0 | 1.0 | 540 | $875 | $1.62 | 21d | 1 | 0.34mi |
| 836 Richmond St Unit 10 Tallahassee, FL | 1.0 | 1.0 | 540 | $875 | $1.62 | 13d | 1 | 0.34mi |
| 810 Wadsworth St Tallahassee, FL | 1.0 | 1.0 | 600 | $1,123 | $1.87 | 13d | 2 | 0.38mi |
| 916 N Woodward Ave #1 Tallahassee, FL | 2.0 | 1.0 | 794 | $1,000 | $1.26 | 13d | 1 | 0.41mi |
| 1325 W Tharpe St Tallahassee, FL | 1.0–3.0 | 1.0–4.0 | 937 | $1,511 | $1.61 | 13d | 21 | 0.45mi |
| 1108 Greentree Ct Tallahassee, FL | 2.0 | 2.0 | 888 | $1,275 | $1.44 | 21d | 1 | 0.48mi |
| 1111 High Rd Tallahassee, FL | 2.0–3.0 | 2.0 | 1000 | $1,409 | $1.41 | 13d | 11 | 0.53mi |
| 2020 Continental Ave Tallahassee, FL | 1.0–2.0 | 1.0–1.5 | 850 | $1,300 | $1.53 | 21d | 3 | 0.62mi |
| 1001 Ocala Rd Tallahassee, FL | 4.0 | 1.0–2.0 | 899 | $584 | $0.65 | 21d | 6 | 0.75mi |
| 322 Conradi St Tallahassee, FL | 3.0 | 2.0 | 1100 | $1,950 | $1.77 | 21d | 4 | 0.76mi |
| 2060 Continental Ave Tallahassee, FL | 1.0–3.0 | 1.0–2.5 | 1121 | $1,052 | $0.94 | 13d | 26 | 0.77mi |
| 1303 Ocala Rd Tallahassee, FL | 1.0–4.0 | 1.0–2.0 | 1121 | $1,320 | $1.18 | 13d | 48 | 0.81mi |
| 1360 Ocala Rd Tallahassee, FL | 2.0 | 1.0 | 800 | $1,000 | $1.25 | 21d | 1 | 0.89mi |
| 1812 W Tharpe St Unit D Tallahassee, FL | 1.0 | 1.0 | 650 | $950 | $1.46 | 21d | 1 | 0.94mi |
| 1380 Ocala Rd Tallahassee, FL | 1.0 | 1.0 | 700 | $975 | $1.39 | 21d | 1 | 0.99mi |
| 1916 Nannette Dr Unit 1916 Tallahassee, FL | 2.0 | 1.0 | 1000 | $1,100 | $1.10 | 13d | 1 | 1.04mi |
| 1935 Dawsey St Unit 1935-2 Tallahassee, FL | 2.0 | 1.0 | 875 | $975 | $1.11 | 13d | 1 | 1.12mi |
| 412 W Brevard St Unit 412 Tallahassee, FL | 3.0 | 2.0 | 900 | $800 | $0.89 | 21d | 1 | 1.18mi |
| 2301 Old Bainbridge Rd Tallahassee, FL | 2.0–3.0 | 1.0–2.0 | 1084 | $1,200 | $1.11 | 21d | 1 | 1.18mi |
| 718 N Bronough St Tallahassee, FL | 2.0 | 1.0 | 798 | $1,100 | $1.38 | 21d | 1 | 1.24mi |
| 220 Atkinson Dr Unit D Tallahassee, FL | 2.0 | 1.0 | 928 | $1,100 | $1.19 | 21d | 1 | 1.24mi |
| 2309 Old Bainbridge Rd Tallahassee, FL | 1.0–2.0 | 1.0–2.0 | 798 | $1,420 | $1.78 | 13d | 10 | 1.28mi |
| 120 W 4th Ave Unit 1/2 Tallahassee, FL | 1.0 | 1.0 | 672 | $1,300 | $1.93 | 21d | 1 | 1.28mi |
| 1854 Belle Vue Way Tallahassee, FL | 2.0–4.0 | 1.0–2.0 | 1100 | $1,235 | $1.12 | 21d | 1 | 1.35mi |
| 1447 Stone Rd Tallahassee, FL | 1.0–3.0 | 1.0–2.0 | 890 | $1,360 | $1.53 | 21d | 1 | 1.37mi |
| 2350 Horne Ave Unit 2 Tallahassee, FL | 2.0 | 2.0 | 800 | $995 | $1.24 | 21d | 1 | 1.39mi |
| 2349 Horne Ave Unit C Tallahassee, FL | 2.0 | 1.0 | 680 | $1,100 | $1.62 | 13d | 1 | 1.40mi |
| 301 S Lipona Rd #24 Tallahassee, FL | 2.0 | 1.5 | 896 | $1,350 | $1.51 | 21d | 1 | 1.40mi |
| 2353 W Mission Rd Tallahassee, FL | 2.0–3.0 | 2.0–2.5 | 1012 | $1,250 | $1.23 | 13d | 11 | 1.41mi |
| 1210 Stone Rd Tallahassee, FL | 2.0 | 2.0 | 1008 | $1,200 | $1.19 | 21d | 1 | 1.41mi |
| 1818 Sylvan Ct Unit D Tallahassee, FL | 2.0 | 1.0 | 850 | $1,200 | $1.41 | 13d | 1 | 1.43mi |
| 394 Prince St Unit 394-PRI Tallahassee, FL | 1.0 | 1.0 | 600 | $1,250 | $2.08 | 21d | 1 | 1.45mi |
| 833 W Gaines St Tallahassee, FL | 2.0 | 2.0 | 1080 | $2,350 | $2.18 | 13d | 2 | 1.47mi |
Listing history 17 events
-
2026-06-18pricedays on market $59,900 Active 139 DOM
-
2026-06-17days on market $65,000 Active 138 DOM
-
2026-06-16days on market $65,000 Active 137 DOM
-
2026-06-15days on market $65,000 Active 136 DOM
-
2026-06-14days on market $65,000 Active 134 DOM
-
2026-06-10days on market $65,000 Active 131 DOM
-
2026-06-09days on market $65,000 Active 130 DOM
-
2026-06-08days on market $65,000 Active 129 DOM
-
2026-06-07days on market $65,000 Active 128 DOM
-
2026-06-05days on market $65,000 Active 125 DOM
-
2026-06-03days on market $65,000 Active 124 DOM
-
2026-06-02days on market $65,000 Active 123 DOM
-
2026-06-01days on market $65,000 Active 122 DOM
-
2026-05-31days on market $65,000 Active 121 DOM
-
2026-05-30days on market $65,000 Active 120 DOM
-
2026-05-03price $65,000
-
2026-01-30$69,900 Active
ⓘ Source: listings_history table (triggers on properties + properties_extension) + one-shot
backfill from property_details.listing_events for pre-trigger history.
Tax reassessment forecast FL · Resets to sale price
- Current annual tax
- $493 · $41/mo
- Projected year-2 tax
- $497 · $41/mo
- Expected delta
- +$4/yr ($0/mo · 0.8%)
ⓘ Screening estimate from a state-policy table — verify with the county assessor before closing.
Climate risk First Street
- Flood 1/10 Low FEMA zone X (unshaded) · 0% chance over 30 yrs
- Wildfire 1/10 Low
- Heat 8/10 Severe 7 d/yr ≥108°F today · 20 d/yr by 30 yrs out
- Wind 9/10 Extreme 99% chance of damaging wind over 30 yrs
- Air quality 5/10 Major 7 unhealthy d/yr today · 7 by 30 yrs out
Nearby sold comps map
Loading sold comps map…
Walkable amenities ~0.75 mi
Loading nearby amenities…
Taxation est. · year 1
- Rental income
- $14,538
- − Mortgage interest
- −$3,355
- − Property taxes
- −$493
- − Insurance
- −$300
- − Repairs & maintenance
- −$1,163
- − Management
- −$1,163
- − Depreciation
- −$1,743
- Taxable income
- $6,322
- Est. tax owed @ 24.0%
- −$1,517
- After-tax cash flow
- $5,406/yr
For passive investors: Depreciation is non-cash, so a rental often shows a tax loss while cash-flowing — sheltering income. Rental losses are passive: they offset passive income freely, and up to $25,000/yr can offset ordinary (W-2) income if you actively participate and your MAGI is under $100k (phasing out to $0 by $150k); unused losses carry forward. On sale, claimed depreciation is recaptured at up to 25%, and gains may owe capital-gains tax (a 1031 exchange can defer both). Figures are a year-1 estimate at your 24.0% rate — not tax advice; consult a CPA.
Schools (NCES district)
- District
- Leon
- NCES district ID
- 1201110
- Math proficiency
- 48% ▼ -13.00%
- Reading proficiency
- 53% ▼ -5.00%
- Median HH income
- $46,339
- Composite
- 42.84/100
- National rank
- #3131
- State rank
- #33 of 73 in FL
Livability — Tallahassee
- Score
- 86/100
- State rank
- #19
- US rank
- #429
Category grades
Schools grade is shown separately in the Schools card above.
Census & demographics
- Census place
- Tallahassee, FL
- County
- Leon County · 294,472 people
- City population
- 294,472
- Metro
- Tallahassee, FL
- Population (ZIP)
- 51,673
- Household income
- $32,348
- Rent vs Own
- Severe rent burden
- 6995.0
Population outlook (Leon County) Hauer SSP2
- Today (2025)
- 315,507 people
- By 2030
- 330,677 · +4.8%
- By 2040
- 358,465 · +13.6%
- By 2050
- 386,804 · +22.6%
- By 2075
- 465,480 · +47.5%
- By 2100
- 519,959 · +64.8%
Race, ethnicity, and origin ACS 2023
- Neighborhood character
- Diverse neighborhood (Simpson 0.65)
- Race & ethnicity
- White 45% Black 36% Hispanic / Latino 10% Two or more races 7% Asian 4%
- Hispanic origin (detail)
- Mexican 2% Puerto Rican 2% Cuban 2%
- Common ancestry
- Romanian 2% Lithuanian 1% Italian 1%
- Foreign-born
- 8% · Canada, China
- Languages at home
- 86% English-only · Spanish 7% Other Indo-European 2% French/Haitian/Cajun 1%
Political lean MEDSL · Leon
- 2024 margin
- Strong D (+21.8) · D 60.3% · R 38.5% · Other 1.2%
- 2008→2024 swing
- -2.5pp toward R · 2008: 24.3pp · 2024: 21.8pp
- All cycles
- 2024: D+21.8 2020: D+28.3 2016: D+25.1 2012: D+23.6 2008: D+24.3
Not yet ingested
- Civics
- —
Market trends
- HPI YoY
- ▼ -72.04%
- Current HPI
- 267.8426
- Rent YoY
- ▲ 4.69%
- Metro
- Tallahassee, FL
- State GDP YoY
- ▲ 3.28%
- F500 in state
- 36
Industry mix (Fortune 500 HQ in FL)
| Industry | F500 HQs | Revenue |
|---|---|---|
| Industrial Technology | 2 | $29B |
|
||
| Insurance | 2 | $17B |
|
||
| Retail | 1 | $60B |
|
||
| Technology Distribution | 1 | $58B |
|
||
| Homebuilding | 1 | $35B |
|
||
| Technology Manufacturing | 1 | $35B |
|
||
Price history
-7.0% since first listed2 events — show timeline
- 2026-05-03 Price Changed $65,000 CATRS
- 2026-01-30 Listed $69,900 CATRS
Property tax history
+33.8%/yrLatest (2025): $493 · +1.5% YoY. Source: county tax records.
Cash-flow waterfall
monthlySold comps — $/sqft
last 12 mo · ≤1 miLoading sold comps…