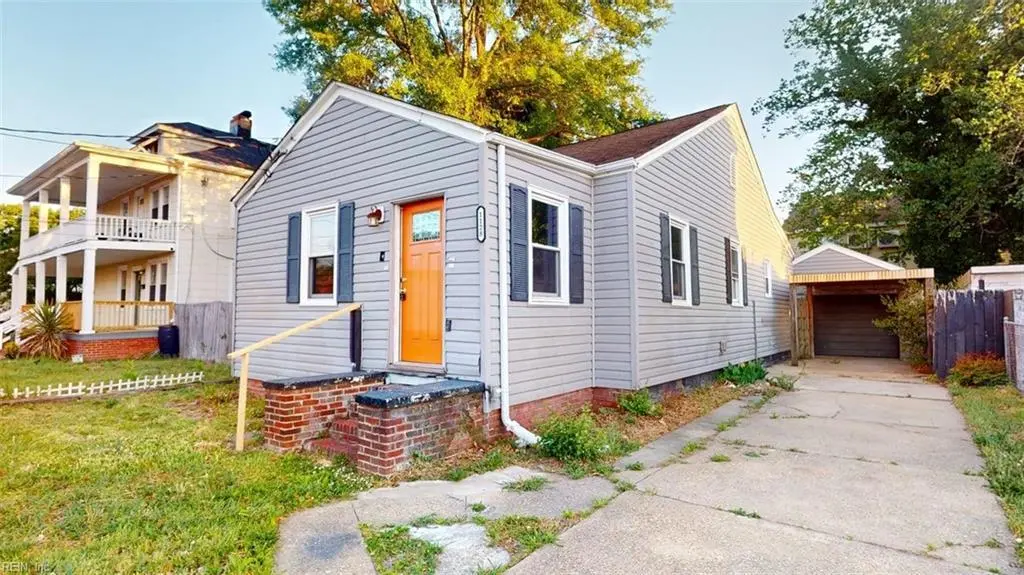
1128 Hugo St · Norfolk, VA
Flood risk 1/10 · Minimal
- FEMA flood zone
- X (unshaded)
- Chance of flooding over 30 yrs
- 0.0%
- Est. flood insurance / yr
- $507 – $1,088
Fire risk 1/10 · Minimal
- Est. fire insurance / yr
- $666 – $1,236
Heat risk 9/10 · Severe
- Hot days now (above 105°F)
- 7 days/yr
- Hot days in 30 yrs
- 16 days/yr
Wind risk 8/10 · Major
- Chance of severe wind over 30 yrs
- 80.0%
Air-quality risk 3/10 · Minor
- Unhealthy air days now
- 2 days/yr
- Unhealthy air days in 30 yrs
- 3 days/yr
Risk factors via First Street. Map © Google.
Why this score? — see what drove the D grade
The composite is a weighted blend of 9 inputs, each scored 0–100. Each bar is that input's sub-score; the figure is the points it added to the 100-point composite (weight × sub-score).
- ARV discount +13.9/15.0
- Cash flow +8.9/30.0
- Livability +4.2/5.0
- Schools +3.5/10.0
- Rent growth +3.4/5.0
- DSCR +2.5/10.0
- Condition / age +2.5/5.0
- 1% rule +2.3/10.0
- Appreciation +0.0/10.0
$208,000
🖨 Deal sheet (PDF) 📄 Offer letter ✓ Due diligence
Listing remarks
Charming 2-bedroom 1.5 bath with spacious kitchen, naturally lit living room, and dining area. The detached garage offers great hobby space. Located in a well-established Norfolk Garden neighborhood known for its convenient access to local amenities, schools, shopping, dining, and major commuter routes, including easy access to downtown Norfolk, military bases, beaches, parks, and entertainment destinations. HUD Case# 544-323103 IE (Insured Escrow). Seller makes no representations or warranties as to property condition. HUD Homes are Sold “As-Is”. Built prior to 1978, lead based paint may potentially exist. Equal Housing Opportunity. Seller may contribute up to 3% for buyer&rsqu
Key facts
- Spacious kitchen
- Detached garage
- 3,484 sq ft lot
Tags
Property features AI
Finance
- Other: Neighborhood: WARWICK LAWNS
- HOA & community: No HOA (N/A)
Exterior
- Parking: Detached 1-car garage; Driveway parking; Garage approximately 320 sq. ft.
- Utilities: City/County water; City/County sewer; Electric water heater; Central air; Heat pump
- Home design: Detached bungalow; Single-story; Crawlspace foundation; Simple ownership
- Construction: Vinyl exterior siding; Asphalt shingle roof; Crawlspace foundation
- Exterior features: Vinyl siding; Partial wood fence; Has fence; Asphalt shingle roof; Lot dimensions approximately 65 x 120
Interior
- Kitchen: Electric range
- Bedrooms: No ensuite bedrooms
- Flooring: Vinyl flooring; Wood flooring
- Bathrooms: One full bathroom; One half bathroom
- Heating & cooling: Heat pump heating; Central air conditioning
- Interior features: Vinyl and wood flooring; Bedroom and full bathroom on the first floor; Five total rooms
- Laundry & utility: Washer hookup; Dryer hookup; Electric water heater
Neighborhood map
What this means for you Summary
Snapshot
- This is a 2-bed/1.5-bath single-family listed at $208k.
Deal economics
- At list price, monthly cash flow is $-166 ($-2k/yr) — negative.
- To cash-flow at today's rent, offer at most $179k (14.1% below list).
- To meet the 1% rule (rent ≥ 1% of price), the offer needs to be $152k (27.1% below list).
- Recommended offer: $152k (27.1% below list) — sets the bar for 1% rule.
- Cap rate 5.3% vs local median 4.0% in Norfolk — top-decile yield for the area; either an underpriced asset or a hidden risk that comps aren't pricing in. Stress-test before assuming the spread holds.
Location & tenants
- Location reads 83/100 on livability (#43 in VA, #1,026 nationally) — a professional / high-income tenant draw. Strengths: amenities A+, commute A+, health & safety A+; Watch: employment C-, crime F.
- Norfolk City Public School District (urban): math 27% / reading 56% proficiency, ranked #118 of 131 in VA (top 90%) — families likely to look elsewhere, expect single-tenant / working-renter base with shorter leases.
- Zoned schools: Norview Elementary (math 17% / reading 47%, grade F, #992 of 1,108 statewide, top 90%, 395 students, 98% FRL); Norview High (math 33% / reading 85%, grade C+, #256 of 319 statewide, top 81%, 1,915 students, 97% FRL) — zoned schools average 98% FRL vs 59% district-wide (39 pts higher); higher-poverty schools than district average — tighter screening recommended.
- Market conditions: Rents rising (+3.4%/yr); 134 active listings in the ZIP; 40 comparable units currently listed for rent nearby; rentals at typical pace (median 22d on market — plan ~3-4 weeks tenant-placement turnaround); 438 units permitted in Norfolk city in 2024 (273 in 5+ unit buildings).
Forward outlook
- Local home prices are declining (-3.0%/yr); year-one equity from $1k of loan paydown is wiped out by about $6k of value loss. Plan a longer hold.
Negotiation context
- It's been on market 54 days — a 3% lower offer ($202k) is reasonable based on typical stale-listing flexibility.
- 3 sale attempts since 11y ago with the ask held roughly flat each time — persistent listings suggest the price (not the market) is what's stuck; bring a comps-based counter.
Risks & watch-outs
- Watch-outs: built in 1935 — expect roof / HVAC / electrical / plumbing capex.
- Climate carrying-cost: severe wind risk, 80% chance of damaging wind over 30y; extreme-heat days projected 7→16/yr by 2055 (HVAC capex compounding) — expect insurance premiums to compound above CPI over the hold.
Questions for the listing agent
- What do current leases actually rent for vs. the listed asking? Can we see a recent rent roll and the last 12 months of T-12 income?
- It's been on market 54 days. Have you received any prior offers? Is the seller open to a 27% concession, seller financing, or rate buy-down credit?
- Built in 1935 — when were the roof, HVAC, electrical panel, plumbing, and water heater last replaced?
- Is there a deadline driving the sale (1031 exchange, divorce, estate, relocation)? That informs how much negotiation room exists.
- Schools are A-rated — typically a magnet for longer-tenancy family renters. What's the average tenant stay here, and is there a school-zone premium baked into asking?
- Crime grade is F in this area — have there been break-ins, vandalism, or insurance claims at this property in the last 3 years? What carrier currently insures it and at what premium?
- The area grade is low — what's the realistic commute time and amenity access for the typical tenant pool here? Any planned neighborhood developments (good or bad) we should know about?
- What's the average days-on-market for RENTAL listings here right now (not sales)? A rising rental-DOM trend means longer vacancies and softer asking-rent achievability than the comps imply.
- What's the recent tenant-quality profile in this submarket — average credit score on applications, eviction rate, late-payment / NSF rate, and stable-employment percentage? A property-management company in the area should have these aggregated.
- How much new for-sale + rental construction is in the pipeline within 1–3 miles? Heavy new supply typically softens prices + rents 12–24 months out; constrained supply supports both.
Investment metrics
- 1% rule
- 0.73% ✗
- Cap rate
- 5.33%
- Cash-on-cash
- -3.43%
- DSCR
- 0.85
- GRM
- 11.4
CMA / ARV
- ARV (median comp)
- $242,547
- List price
- $208,000
- Delta
- -14.24%
- Verdict
- UNDERPRICED
- Comps
- 20 within 1.0 mi
Show comp detail 12 sales within ~0.75 mi
| Address | Dist | Beds/Ba | Sqft | Sold | Price | $/sf | Match |
|---|---|---|---|---|---|---|---|
| 6131 Alexander St | 0.19mi | 3/2.0 (+1) | 1,032 (+0%) | 3mo | $231,610 | $224 | 81 |
| 3814 Essex Cir | 0.24mi | 2/1.0 | 1,008 (-2%) | 7mo | $260,000 | $258 | 78 |
| 1280 Strand St | 0.35mi | 3/2.0 (+1) | 1,050 (+2%) | 0mo | $300,000 | $286 | 73 |
| 6400 Clare Rd | 0.42mi | 3/1.0 (+1) | 1,069 (+4%) | 6mo | $210,000 | $196 | 61 |
| 6376 Palem Rd | 0.38mi | 3/1.0 (+1) | 944 (-8%) | 1mo | $160,000 | $169 | 61 |
| 6346 Edward St | 0.60mi | 3/2.0 (+1) | 1,024 (-0%) | 6mo | $210,000 | $205 | 59 |
| 3607 Hyde Cir | 0.34mi | 3/2.0 (+1) | 1,136 (+11%) | 1mo | $305,000 | $268 | 59 |
| 964 Quail St | 0.55mi | 3/1.0 (+1) | 974 (-5%) | 3mo | $150,200 | $154 | 56 |
| 3308 Hyde Cir | 0.59mi | 2/1.0 | 919 (-10%) | 7mo | $210,000 | $229 | 47 |
| 3858 Wake Cir | 0.64mi | 3/2.0 (+1) | 1,128 (+10%) | 1mo | $280,000 | $248 | 46 |
| 4507 Kennebeck Ave | 0.73mi | 3/2.0 (+1) | 1,109 (+8%) | 6mo | $305,000 | $275 | 40 |
| 1037 Philpotts Rd | 0.56mi | 3/2.0 (+1) | 1,163 (+13%) | 7mo | $285,000 | $245 | 39 |
Match score weights: distance 35% · size 25% · config 20% · recency 20%. Top-matched comps best support the ARV.
Projected returns pro-forma
-3.0% appreciation · 3.42% rent growth · sell at horizon
- IRR
- -21.6%
- Equity multiple
- 0.25×
- Total profit
- $-43,673
- Equity at exit
- $31,013
- IRR
- -14.5%
- Equity multiple
- 0.16×
- Total profit
- $-49,092
- Equity at exit
- $17,984
Cash invested: $58,240 (down + closing). Projections, not guarantees.
Landlord ↔ Tenant lean methodology
- Overall (STATE)
- 55 Moderately Landlord-Leaning
- State Virginia
- 55 Moderately Landlord-Leaning · D+2
- County
- — inherits STATE
- City
- — inherits STATE
ZIP-level market 23513
- Home prices YoY
- -9.3%
- Rents YoY
- 3.4%
- Active inventory
- 134
- Price-to-rent
- 11.4×
Monthly cashflow live
- Estimated rent
- $1,516 high interval (Pro) →
- Mortgage (P&I)
- −$1,091
- Tax from tax record
- −$187 /mo · $2,241/yr
- Insurance
- −$87
- HOA
- −$0
- Vacancy / Maint / Mgmt
- −$318
- Net cashflow
- $-166
Break-even live
Sensitivity live
| Price | -10% $-49 | -5% $-107 | +0% $-166 | +5% $-225 | +10% $-284 |
|---|---|---|---|---|---|
| Rent | -10% $-286 | -5% $-226 | +0% $-166 | +5% $-106 | +10% $-46 |
| Rate | -1.0pp $-62 | -0.5pp $-113 | base $-166 | +0.5pp $-220 | +1.0pp $-275 |
UW: 25.0% down · 7.5% · 30yr · 1.5% tax · 5.0% vac · 8.0% maint · 8.0% mgmt
Financing live
Cash to close
- Down payment
- $52,000
- Closing costs
- $6,240
- Reserves months
- —
- Total cash needed
- —
Loan-product check · same deal, 3 products live
Conventional
25% down · 7.5% · 30yr
- Down + closing
- —
- Monthly P&I
- —
- Monthly cashflow
- —
- DSCR
- —
- Eligible?
- —
Personal DTI + credit; lowest rate.
DSCR
20% down · 8.5% · 30yr
- Down + closing
- —
- Monthly P&I
- —
- Monthly cashflow
- —
- DSCR
- —
- Eligible?
- —
No personal income docs; deal must DSCR.
Hard money
10% down · 12.0% · 12mo
- Down + closing
- —
- Monthly P&I
- —
- Monthly cashflow
- —
- DSCR
- —
- Eligible?
- —
Short-term bridge; refi at stabilization.
Rent comps 40 comps
| Address | Beds | Baths | Sqft | Rent | $/sqft | DOM | Units | Dist |
|---|---|---|---|---|---|---|---|---|
| 6228 Chesapeake Blvd Unit G Norfolk, VA | 2.0 | 1.0 | 885 | $925 | $1.05 | 44d | 1 | 0.19mi |
| 1232 Norview Ave Unit NOR1232R-EA Norfolk, VA | 3.0 | 2.0 | 1106 | $1,600 | $1.45 | 44d | 1 | 0.20mi |
| 6234 Chesapeake Blvd Norfolk, VA | 2.0 | 1.0 | 986 | $925 | $0.94 | 18d | 1 | 0.20mi |
| 6225 Alexander St Unit F Norfolk, VA | 2.0 | 1.0 | 750 | $1,499 | $2.00 | 21d | 1 | 0.21mi |
| 6225 Alexander St Norfolk, VA | 2.0 | 1.0 | 750 | $1,299 | $1.73 | 44d | 1 | 0.21mi |
| 6241 Alexander St Unit F Norfolk, VA | 2.0 | 1.0 | 704 | $895 | $1.27 | 13d | 1 | 0.21mi |
| 3820 Essex Cir Unit A Norfolk, VA | 2.0 | 1.0 | 1000 | $2,200 | $2.20 | 22d | 1 | 0.21mi |
| 3820 Essex Cir Unit B 1 Norfolk, VA | 2.0 | 1.0 | 900 | $1,700 | $1.89 | 22d | 1 | 0.21mi |
| 3820 Essex Cir #1 Norfolk, VA | 2.0 | 1.0 | 1000 | $2,250 | $2.25 | 18d | 1 | 0.21mi |
| 6249 Alexander St Unit C Norfolk, VA | 2.0 | 1.0 | 817 | $1,195 | $1.46 | 24d | 1 | 0.23mi |
| 6249 Alexander St Unit C Norfolk, VA | 2.0 | 1.0 | 817 | $1,195 | $1.46 | 18d | 1 | 0.23mi |
| 6249 Alexander St Unit F Norfolk, VA | 2.0 | 1.0 | 817 | $1,195 | $1.46 | 5d | 1 | 0.23mi |
| 3819 Pamlico Cir Norfolk, VA | 3.0 | 1.0 | 1250 | $2,000 | $1.60 | 13d | 1 | 0.28mi |
| 6340 Sewells Point Rd Apt communities Norfolk, VA | 2.0 | 1.0 | 750 | $1,099 | $1.47 | 22d | 1 | 0.32mi |
| 6343 Chesapeake Blvd Apt communities Norfolk, VA | 2.0 | 1.0 | 750 | $1,099 | $1.47 | 22d | 1 | 0.32mi |
| 4802 Norvella Ave Unit 1 Norfolk, VA | 2.0 | 1.0 | 800 | $1,050 | $1.31 | 8d | 1 | 0.35mi |
| 4566 Hampshire Ave Unit A Norfolk, VA | 2.0 | 1.0 | 870 | $1,350 | $1.55 | 44d | 1 | 0.42mi |
| 6201 Geneva Way Unit B Norfolk, VA | 2.0 | 1.5 | 1200 | $1,500 | $1.25 | 44d | 1 | 0.50mi |
| 3801 Chatham Cir Unit 2 Norfolk, VA | 2.0 | 1.0 | 1100 | $1,350 | $1.23 | 8d | 1 | 0.57mi |
| 3872 Wake Cir Unit A Norfolk, VA | 2.0 | 1.0 | 750 | $1,395 | $1.86 | 44d | 1 | 0.61mi |
| 3872 Wake Cir Unit A Norfolk, VA | 2.0 | 1.0 | 750 | $1,395 | $1.86 | 4d | 1 | 0.61mi |
| 6451 Edward St Norfolk, VA | 3.0 | 2.5 | 1400 | $2,000 | $1.43 | 8d | 1 | 0.64mi |
| 3305 Herbert St Norfolk, VA | 2.0 | 1.0 | 1215 | $1,750 | $1.44 | 13d | 1 | 0.72mi |
| 3477 E Bonner Dr Norfolk, VA | 3.0 | 1.0 | 1304 | $2,000 | $1.53 | 24d | 1 | 0.86mi |
| 6450 Crescent Way Norfolk, VA | 1.0–3.0 | 1.0–2.0 | 1128 | $2,069 | $1.83 | 3d | 23 | 0.89mi |
| 5404 Douglas St Norfolk, VA | 3.0 | 1.0 | 981 | $1,950 | $1.99 | 44d | 1 | 0.90mi |
| 3044 Sewells Point Rd Norfolk, VA | 2.0 | 1.0 | 830 | $1,134 | $1.37 | 2d | 1 | 0.90mi |
| 4745 Lind St Unit A Norfolk, VA | 2.0 | 1.0 | 1000 | $1,600 | $1.60 | 44d | 1 | 1.01mi |
| 4745 Lind St Unit B Norfolk, VA | 2.0 | 1.0 | 752 | $1,350 | $1.80 | 3d | 1 | 1.01mi |
| 739 Waukesha Ave Norfolk, VA | 2.0 | 1.0 | 860 | $1,800 | $2.09 | 24d | 1 | 1.02mi |
| 6115 Tidewater Dr Norfolk, VA | 1.0–2.0 | 1.0–2.0 | 956 | $2,274 | $2.38 | 3d | 8 | 1.04mi |
| 1721 Norview Ave Norfolk, VA | 1.0 | 1.0 | 800 | $1,150 | $1.44 | 44d | 1 | 1.05mi |
| 3475 Azalea Garden Rd Norfolk, VA | 1.0 | 1.0 | 700 | $995 | $1.42 | 44d | 1 | 1.06mi |
| 3521 Brest Ave Norfolk, VA | 3.0 | 2.0 | 1234 | $2,300 | $1.86 | 44d | 1 | 1.11mi |
| 6975 Bonnot Dr Norfolk, VA | 3.0 | 1.5 | 1188 | $1,700 | $1.43 | 44d | 1 | 1.15mi |
| 7108 Gregory Dr Norfolk, VA | 2.0 | 1.0 | 720 | $1,400 | $1.94 | 44d | 1 | 1.16mi |
| 837 Tifton St Norfolk, VA | 3.0 | 2.0 | 1072 | $2,300 | $2.15 | 24d | 1 | 1.18mi |
| 2640 Azalea Garden Rd Norfolk, VA | 3.0 | 1.5 | 1100 | $2,150 | $1.95 | 5d | 1 | 1.21mi |
| 7128 Gregory Dr Norfolk, VA | 2.0 | 1.0 | 720 | $1,800 | $2.50 | 44d | 1 | 1.21mi |
| 3400 Lafayette Blvd #2 Norfolk, VA | 2.0 | 1.0 | 800 | $1,350 | $1.69 | 4d | 1 | 1.22mi |
Listing history 24 events
-
2026-06-21days on market $208,000 Active 54 DOM
-
2026-06-18days on market $208,000 Active 51 DOM
-
2026-06-17days on market $208,000 Active 50 DOM
-
2026-06-16days on market $208,000 Active 49 DOM
-
2026-06-15days on market $208,000 Active 48 DOM
-
2026-06-13days on market $208,000 Active 46 DOM
-
2026-06-09days on market $208,000 Active 42 DOM
-
2026-06-08days on market $208,000 Active 41 DOM
-
2026-06-07days on market $208,000 Active 40 DOM
-
2026-06-03days on market $208,000 Active 36 DOM
-
2026-06-02days on market $208,000 Active 35 DOM
-
2026-06-01days on market $208,000 Active 34 DOM
-
2026-05-31days on market $208,000 Active 33 DOM
-
2026-04-27$208,000 Active 1005-char remark
-
2021-08-11soldstatus $185,000
-
2021-07-07status Under Contract
-
2021-06-08price $185,000
-
2021-05-21$197,000 Active
-
2015-09-03status Under Contract
-
2015-08-14$72,950 Active
-
2014-06-09price $121,000 Active
-
2005-04-18soldstatus $133,000
-
2004-09-03soldstatus $65,000
-
1997-10-01soldstatus $37,000
ⓘ Source: listings_history table (triggers on properties + properties_extension) + one-shot
backfill from property_details.listing_events for pre-trigger history.
Tax reassessment forecast VA · Resets to sale price
- Current annual tax
- $2,241 · $187/mo
- Projected year-2 tax
- $2,241 · $187/mo
- Expected delta
- $0/yr ($0/mo · 0.0%)
ⓘ Screening estimate from a state-policy table — verify with the county assessor before closing.
Climate risk First Street
- Flood 1/10 Low FEMA zone X (unshaded) · 0% chance over 30 yrs
- Wildfire 1/10 Low
- Heat 9/10 Extreme 7 d/yr ≥105°F today · 16 d/yr by 30 yrs out
- Wind 8/10 Severe 80% chance of damaging wind over 30 yrs
- Air quality 3/10 Moderate 2 unhealthy d/yr today · 3 by 30 yrs out
Nearby sold comps map
Loading sold comps map…
Walkable amenities ~0.75 mi
Loading nearby amenities…
Taxation est. · year 1
- Rental income
- $18,196
- − Mortgage interest
- −$11,651
- − Property taxes
- −$2,241
- − Insurance
- −$1,040
- − Repairs & maintenance
- −$1,456
- − Management
- −$1,456
- − Depreciation
- −$6,051
- Taxable loss
- −$5,698
- Est. tax savings @ 24.0%
- +$1,368
- After-tax cash flow
- $-628/yr
For passive investors: Depreciation is non-cash, so a rental often shows a tax loss while cash-flowing — sheltering income. Rental losses are passive: they offset passive income freely, and up to $25,000/yr can offset ordinary (W-2) income if you actively participate and your MAGI is under $100k (phasing out to $0 by $150k); unused losses carry forward. On sale, claimed depreciation is recaptured at up to 25%, and gains may owe capital-gains tax (a 1031 exchange can defer both). Figures are a year-1 estimate at your 24.0% rate — not tax advice; consult a CPA.
Schools (NCES district)
- District
- Norfolk City Public School District
- NCES district ID
- 5102670
- Math proficiency
- 27% ▼ -44.00%
- Reading proficiency
- 56% ▼ -10.00%
- Median HH income
- $44,358
- Composite
- 35.08/100
- National rank
- #5026
- State rank
- #118 of 131 in VA
Livability — Norfolk
- Score
- 83/100
- State rank
- #43
- US rank
- #1026
Category grades
Schools grade is shown separately in the Schools card above.
Census & demographics
- Census place
- Norfolk, VA
- County
- Norfolk City · 214,042 people
- City population
- 214,042
- Metro
- Virginia Beach-Norfolk-Newport News, VA-NC
- Population (ZIP)
- 28,628
- Household income
- $68,380
- Rent vs Own
- Severe rent burden
- 1342.0
Population outlook (Norfolk County) Hauer SSP2
- Today (2025)
- 249,032 people
- By 2030
- 252,347 · +1.3%
- By 2040
- 253,644 · +1.9%
- By 2050
- 251,913 · +1.2%
- By 2075
- 245,281 · -1.5%
- By 2100
- 219,548 · -11.8%
Race, ethnicity, and origin ACS 2023
- Neighborhood character
- Diverse neighborhood (Simpson 0.63)
- Race & ethnicity
- Black 55% White 23% Hispanic / Latino 11% Two or more races 7% Asian 5%
- Hispanic origin (detail)
- Mexican 4% Puerto Rican 3%
- Common ancestry
- Romanian 1% Slovak 1% Lithuanian 0%
- Foreign-born
- 10% · Canada
- Languages at home
- 87% English-only · Spanish 6% Tagalog/Filipino 4% French/Haitian/Cajun 1%
Political lean MEDSL · Norfolk
- 2024 margin
- Solid D (+41.5) · D 70.0% · R 28.5% · Other 1.6%
- 2008→2024 swing
- -1.4pp toward R · 2008: 43.0pp · 2024: 41.5pp
- All cycles
- 2024: D+41.5 2020: D+45.6 2016: D+42.0 2012: D+44.0 2008: D+43.0
Not yet ingested
- Civics
- —
Market trends
- HPI YoY
- ▼ -33.67%
- Current HPI
- 329.2241
- Rent YoY
- ▲ 3.42%
- Metro
- Virginia Beach-Norfolk-Newport News, VA-NC
- State GDP YoY
- ▲ 2.40%
- F500 in state
- 50
Industry mix (Fortune 500 HQ in VA)
| Industry | F500 HQs | Revenue |
|---|---|---|
| Aerospace / Defense | 4 | $236B |
|
||
| Technology / Defense | 3 | $32B |
|
||
| Financial Services | 2 | $176B |
|
||
| Utilities | 2 | $27B |
|
||
| Insurance | 2 | $25B |
|
||
| Technology | 2 | $15B |
|
||
Price history
+462.2% since first listed11 events — show timeline
- 2026-04-27 Listed $208,000 REINMLS
- 2021-08-11 Sold (Public Records) $185,000 Public Records
- 2021-07-07 Pending — REINMLS
- 2021-06-08 Price Changed $185,000 REINMLS
- 2021-05-21 Listed $197,000 REINMLS
- 2015-09-03 Pending — REINMLS
- 2015-08-14 Listed $72,950 REINMLS
- 2014-06-09 Price Changed $121,000 REINMLS
- 2005-04-18 Sold (Public Records) $133,000 Public Records
- 2004-09-03 Sold (Public Records) $65,000 Public Records
- 1997-10-01 Sold (Public Records) $37,000 Public Records
Property tax history
+4.1%/yrLatest (2025): $2,241 · +6.1% YoY. Source: county tax records.
Cash-flow waterfall
monthlySold comps — $/sqft
last 12 mo · ≤1 miLoading sold comps…