 8-Plex
405 N 2nd E · Mountain Home, ID
Flood risk No data
- FEMA flood zone
- —
- Chance of flooding over 30 yrs
- —
- Est. flood insurance / yr
- —
Fire risk No data
- Est. fire insurance / yr
- —
Heat risk No data
- Hot days now (above threshold)
- —
- Hot days in 30 yrs
- —
Wind risk No data
- Chance of severe wind over 30 yrs
- —
Air-quality risk No data
- Unhealthy air days now
- —
- Unhealthy air days in 30 yrs
- —
Risk factors via First Street. Map © Google.
Why this score? — see what drove the B grade
The composite is a weighted blend of 9 inputs, each scored 0–100. Each bar is that input's sub-score; the figure is the points it added to the 100-point composite (weight × sub-score).
- Cash flow +30.0/30.0
- 1% rule +10.0/10.0
- DSCR +10.0/10.0
- ARV discount +7.5/15.0
- Rent growth +4.1/5.0
- Livability +3.8/5.0
- Schools +3.1/10.0
- Condition / age +2.5/5.0
- Appreciation +0.0/10.0
$715,000
🖨 Deal sheet 📄 Offer letter ✓ Due diligence
Multi-family units
County records classify this as Multi-Family (5+ Unit). Listing-text estimate: 8 units. confirmed
5+ unit building — per-unit beds/baths from public records are typically unavailable; the breakdown below (if shown) is an estimate from the listing text.
Listing remarks
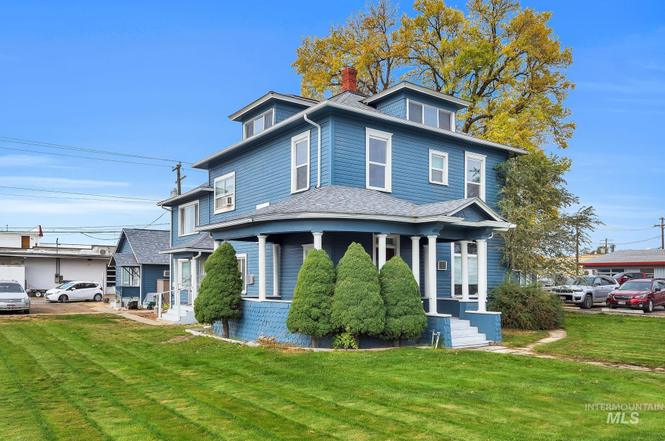
Iconic 8-unit rental property in the center of Mountain Home! The location is prime and the property has excellent rental history. Vacant units rent within days. The property includes the large house in front and also the cottage rental unit in the back. New boiler in December 2025. New roof and exterior paint in 2020, new electrical meter and main service panel in 2020. Most windows were replaced in 2020. Units 1, 3, 6, 7, & 8 are updated. Units 4 and 5 are long-term tenants. Professionally managed. Listing Agent is part-owner in property. Located across the street from the newly renovated Towne Center Apartments (formerly motel), a block from Albertson's, just east of the Railroad P
Key facts
- Cottage rental unit
- New boiler
- Large house
Tags
Property features AI
Finance
- HOA & community: Association fees apply
Exterior
- Parking: Six total parking spaces
- Utilities: City water service; Sewer connected
- Home design: Apartment building; Zoned C2; Currently used as a 5+ unit property
- Construction: Frame construction with wood siding; Originally built in 1895
- Exterior features: Composition roof
Interior
- Kitchen: All units include stove/range; All units include refrigerator
- Bedrooms: Seven total bedrooms across the property
- Flooring: Vinyl flooring
- Bathrooms: Eight total bathrooms across the property
- Heating & cooling: Natural gas heating; Additional (other) heating; Some units have wall/window air conditioning
- Interior features: Apartment property with multiple units; Some units have wall/window air conditioning; Natural gas heating and other heating types; Disposal available (not in individual units)
- Laundry & utility: Washer/dryer hookups available (not provided in units)
Neighborhood map
What this means for you Summary
Snapshot
- This is a 8 × 7-bed/8.0-bath units multifamily listed at $715k.
Deal economics
- At list price, monthly cash flow is $13k ($151k/yr) — positive. Per door: $2k/mo.
- The deal already cash-flows at list — no discount required.
- Meets the 1% rule at list price ($21k rent vs $715k).
- Recommended offer: $629k (12.0% below list) — sets the bar for market timing.
- Cap rate 27.4% vs local median 3.1% in Mountain Home — top-decile yield for the area; either an underpriced asset or a hidden risk that comps aren't pricing in. Stress-test before assuming the spread holds.
Location & tenants
- Location reads 76/100 on livability (#26 in ID, #3,741 nationally) — a middle-class / working-renter tenant base. Strengths: cost of living A+, housing A+, health & safety A+; Watch: employment D, amenities F, commute F.
- Mountain Home District (town): math 28% / reading 44% proficiency, ranked #78 of 92 in ID (top 85%) — families likely to look elsewhere, expect single-tenant / working-renter base with shorter leases.
- Zoned schools: Mountain Home Sr High School (math 21% / reading 44%, grade F, #117 of 169 statewide, top 70%, 960 students, 33% FRL).
- Market conditions: Rents rising fast (+6.2%/yr); 347 active listings in the ZIP; 129 units permitted in Elmore County in 2024 (0 in 5+ unit buildings).
- At $21,325/mo this rent would consume 401% of the median local household income ($64k/yr) (locally 317% of renters already pay >50% of income on rent) — very limited rent-growth headroom before tenants either downsize or default.
Forward outlook
- Local home prices are declining (-3.0%/yr); year-one equity from $5k of loan paydown is wiped out by about $21k of value loss. Plan a longer hold.
- Elmore County population projected at -35% by 2050 — secular population decline; favor cash flow + early exit over multi-decade hold.
- At projected returns (-3.0% appreciation + 6.2% rent growth), your $200k cash investment doubles in ~2 years — after that, you're playing with house money.
Negotiation context
- It's been on market 141 days — a 12% lower offer ($629k) is reasonable based on typical stale-listing flexibility.
- 18 sale attempts since 17y ago; this cycle's ask has dropped $45k (6%) from the opening price — seller is motivated, your offer sets the floor, not the list.
Risks & watch-outs
- Watch-outs: built in 1895 — expect roof / HVAC / electrical / plumbing capex.
Questions for the listing agent
- It's been on market 141 days. Have you received any prior offers? Is the seller open to a 12% concession, seller financing, or rate buy-down credit?
- Can we see the unit-by-unit rent roll, current vacancy, and any below-market leases? What's the average tenancy length?
- What capital expenditures (roof, boiler, parking lot, exteriors) have been made in the last 5 years, and what's planned in the next 2?
- Built in 1895 — when were the roof, HVAC, electrical panel, plumbing, and water heater last replaced?
- Why hasn't it sold? Are there any deal-killer items the seller is aware of (foundation, flood, title, zoning, code violations)?
- Is there a deadline driving the sale (1031 exchange, divorce, estate, relocation)? That informs how much negotiation room exists.
- What's the average days-on-market for RENTAL listings here right now (not sales)? A rising rental-DOM trend means longer vacancies and softer asking-rent achievability than the comps imply.
- What's the recent tenant-quality profile in this submarket — average credit score on applications, eviction rate, late-payment / NSF rate, and stable-employment percentage? A property-management company in the area should have these aggregated.
- How much new apartment / multifamily construction is in the pipeline within 1–3 miles? Heavy new supply (>2% of stock underway) typically softens rents 12–24 months out; light construction supports rent growth.
Investment metrics
- 1% rule
- 2.98% ✓
- Cap rate
- 27.45%
- Cash-on-cash
- 75.55%
- DSCR
- 4.36
- GRM
- 2.8
CMA / ARV
No comps found within radius.
Projected returns pro-forma
-3.0% appreciation · 6.23% rent growth · sell at horizon
- IRR
- 78.9%
- Equity multiple
- 4.79×
- Total profit
- $758,309
- Equity at exit
- $106,609
- IRR
- 83.2%
- Equity multiple
- 11.03×
- Total profit
- $2,007,283
- Equity at exit
- $61,820
Cash invested: $200,200 (down + closing). Projections, not guarantees.
Landlord ↔ Tenant lean methodology
- Overall (STATE)
- 91 Strongly Landlord-Friendly
- State Idaho
- 91 Strongly Landlord-Friendly · R+18
- County
- — inherits STATE
- City
- — inherits STATE
ZIP-level market 83647
- Home prices YoY
- -31.4%
- Rents YoY
- 6.2%
- Active inventory
- 347
- Price-to-rent
- 22.4×
Monthly cashflow live
- Estimated rent
- $21,325 medium interval (Pro) →
- Mortgage (P&I)
- −$3,750
- Tax from tax record
- −$196 /mo · $2,348/yr
- Insurance
- −$298
- HOA
- −$0
- Vacancy / Maint / Mgmt
- −$4,478
- Net cashflow
- $12,604
Break-even live
8-unit breakdown (identical units grouped — click to expand)
| Units | Beds | Baths | Est. rent |
|---|---|---|---|
| 8× units | 7 | 8 | $21,328 |
| #1 | 7 | 8 | $2,666 |
| #2 | 7 | 8 | $2,666 |
| #3 | 7 | 8 | $2,666 |
| #4 | 7 | 8 | $2,666 |
| #5 | 7 | 8 | $2,666 |
| #6 | 7 | 8 | $2,666 |
| #7 | 7 | 8 | $2,666 |
| #8 | 7 | 8 | $2,666 |
| Total (8 units) | $21,325 | ||
UW: 25.0% down · 7.5% · 30yr · 1.5% tax · 5.0% vac · 8.0% maint · 8.0% mgmt
Financing live
Cash to close
- Down payment
- $178,750
- Closing costs
- $21,450
- Reserves months
- —
- Total cash needed
- —
Loan-product check · same deal, 3 products live
Conventional
25% down · 7.5% · 30yr
- Down + closing
- —
- Monthly P&I
- —
- Monthly cashflow
- —
- DSCR
- —
- Eligible?
- —
Personal DTI + credit; lowest rate.
DSCR
20% down · 8.5% · 30yr
- Down + closing
- —
- Monthly P&I
- —
- Monthly cashflow
- —
- DSCR
- —
- Eligible?
- —
No personal income docs; deal must DSCR.
Hard money
10% down · 12.0% · 12mo
- Down + closing
- —
- Monthly P&I
- —
- Monthly cashflow
- —
- DSCR
- —
- Eligible?
- —
Short-term bridge; refi at stabilization.
Listing history 50 events
-
2026-06-19days on market $715,000 Active 141 DOM
-
2026-06-18days on market $715,000 Active 140 DOM
-
2026-06-17days on market $715,000 Active 139 DOM
-
2026-06-16days on market $715,000 Active 138 DOM
-
2026-06-15days on market $715,000 Active 137 DOM
-
2026-06-14days on market $715,000 Active 135 DOM
-
2026-06-12days on market $715,000 Active 134 DOM
-
2026-06-09pricedays on market $715,000 Active 131 DOM
-
2026-06-08days on market $730,000 Active 130 DOM
-
2026-06-07days on market $730,000 Active 129 DOM
-
2026-06-07days on market $730,000 Active 128 DOM
-
2026-06-04days on market $730,000 Active 125 DOM
-
2026-06-02days on market $730,000 Active 124 DOM
-
2026-06-01days on market $730,000 Active 123 DOM
-
2026-05-31days on market $730,000 Active 122 DOM
-
2026-05-31days on market $730,000 Active 121 DOM
-
2026-04-30price $730,000
-
2026-01-29$760,000 Active
-
2025-11-12historical
-
2025-10-05historical $900
-
2025-09-18$900
-
2025-07-25historical $900
-
2025-06-19$900
-
2025-05-28price $749,000
-
2025-02-14status Active
-
2025-02-05status Pending
-
2024-10-28$760,000 Active
-
2024-08-07historical $900
-
2024-07-30$900
-
2024-07-18historical $800
-
2024-07-02$800
-
2024-04-13historical $700
-
2024-04-10$700
-
2024-04-10historical $895
-
2024-03-13$895
-
2023-12-20historical $900
-
2023-11-10$900
-
2020-06-16soldstatus Sold
-
2020-06-16soldstatus
-
2020-04-21status Pending
-
2020-04-12price $215,000
-
2020-04-11status Active
-
2020-03-11price $203,000
-
2020-02-11status Pending
-
2020-01-24status Active
-
2019-10-26status Pending
-
2019-10-23price $248,000
-
2019-10-13price $267,000
-
2019-10-02price $279,000
-
2019-09-21price $289,000
ⓘ Source: listings_history table (triggers on properties + properties_extension) + one-shot
backfill from property_details.listing_events for pre-trigger history.
Tax reassessment forecast ID · Resets to sale price
- Current annual tax
- $2,348 · $196/mo
- Projected year-2 tax
- $4,934 · $411/mo
- Expected delta
- +$2,586/yr (+$215/mo · 110.1%)
ⓘ Screening estimate from a state-policy table — verify with the county assessor before closing.
Nearby sold comps map
Loading sold comps map…
Walkable amenities ~0.75 mi
Loading nearby amenities…
Taxation est. · year 1
- Rental income
- $255,900
- − Mortgage interest
- −$40,051
- − Property taxes
- −$2,348
- − Insurance
- −$3,575
- − Repairs & maintenance
- −$20,472
- − Management
- −$20,472
- − Depreciation
- −$20,800
- Taxable income
- $148,182
- Est. tax owed @ 24.0%
- −$35,564
- After-tax cash flow
- $115,680/yr
For passive investors: Depreciation is non-cash, so a rental often shows a tax loss while cash-flowing — sheltering income. Rental losses are passive: they offset passive income freely, and up to $25,000/yr can offset ordinary (W-2) income if you actively participate and your MAGI is under $100k (phasing out to $0 by $150k); unused losses carry forward. On sale, claimed depreciation is recaptured at up to 25%, and gains may owe capital-gains tax (a 1031 exchange can defer both). Figures are a year-1 estimate at your 24.0% rate — not tax advice; consult a CPA.
Schools (NCES district)
- District
- Mountain Home District
- NCES district ID
- 1602250
- Math proficiency
- 28% ▼ -5.00%
- Reading proficiency
- 44% ▲ 1.00%
- Median HH income
- $44,262
- Composite
- 30.57/100
- National rank
- #6203
- State rank
- #78 of 92 in ID
Livability — Mountain Home
- Score
- 76/100
- State rank
- #26
- US rank
- #3741
Category grades
Schools grade is shown separately in the Schools card above.
Census & demographics
- Census place
- Mountain Home, ID
- County
- Elmore County · 22,952 people
- City population
- 22,952
- Metro
- Mountain Home, ID
- Population (ZIP)
- 22,952
- Household income
- $63,760
- Rent vs Own
- Severe rent burden
- 317.0
Population outlook (Elmore County) Hauer SSP2
- Today (2025)
- 22,644 people
- By 2030
- 21,112 · -6.8%
- By 2040
- 17,768 · -21.5%
- By 2050
- 14,629 · -35.4%
- By 2075
- 9,144 · -59.6%
- By 2100
- 6,006 · -73.5%
Race, ethnicity, and origin ACS 2023
- Neighborhood character
- Predominantly White (72%)
- Race & ethnicity
- White 72% Hispanic / Latino 18% Two or more races 13% Asian 3% Black 2% Native American 1%
- Hispanic origin (detail)
- Mexican 15%
- Common ancestry
- Portuguese 4% Lithuanian 3% Scotch-Irish 3%
- Foreign-born
- 10% · Canada
- Languages at home
- 85% English-only · Spanish 10% Russian/Polish/Slavic 2% Chinese 1%
Political lean MEDSL · Elmore
- 2024 margin
- Solid R (+48.5) · D 24.5% · R 73.0% · Other 2.5%
- 2008→2024 swing
- -12.1pp toward R · 2008: -36.4pp · 2024: -48.5pp
- All cycles
- 2024: R+48.5 2020: R+45.5 2016: R+47.0 2012: R+33.9 2008: R+36.4
Not yet ingested
- Civics
- —
Market trends
- HPI YoY
- ▼ -108.42%
- Current HPI
- 236.3087
- Rent YoY
- ▲ 6.23%
- Metro
- Mountain Home, ID
- State GDP YoY
- ▲ 4.51%
- F500 in state
- 6
Industry mix (Fortune 500 HQ in ID)
| Industry | F500 HQs | Revenue |
|---|---|---|
| Retail | 1 | $79B |
|
||
| Technology | 1 | $25B |
|
||
| Food / Agriculture | 1 | $6B |
|
||
Price history
+386.7% since first listed42 events — show timeline
- 2026-04-30 Price Changed $730,000 IMLS
- 2026-01-29 Listed $760,000 IMLS
- 2025-11-12 Listing Removed — IMLS
- 2025-10-05 Rental Removed $900 APPFOLIO
- 2025-09-18 Listed for Rent $900 APPFOLIO
- 2025-07-25 Rental Removed $900 APPFOLIO
- 2025-06-19 Listed for Rent $900 APPFOLIO
- 2025-05-28 Price Changed $749,000 IMLS
- 2025-02-14 Relisted — IMLS
- 2025-02-05 Pending — IMLS
- 2024-10-28 Listed $760,000 IMLS
- 2024-08-07 Rental Removed $900 RENT.
- 2024-07-30 Listed for Rent $900 RENT.
- 2024-07-18 Rental Removed $800 APPFOLIO
- 2024-07-02 Listed for Rent $800 APPFOLIO
- 2024-04-13 Rental Removed $700 APPFOLIO
- 2024-04-10 Listed for Rent $700 APPFOLIO
- 2024-04-10 Rental Removed $895 APPFOLIO
- 2024-03-13 Listed for Rent $895 APPFOLIO
- 2023-12-20 Rental Removed $900 APPFOLIO
- 2023-11-10 Listed for Rent $900 APPFOLIO
- 2020-06-16 Sold (Public Records) — Public Records
- 2020-06-16 Sold (MLS) — IMLS
- 2020-04-21 Pending — IMLS
- 2020-04-12 Price Changed $215,000 IMLS
- 2020-04-11 Relisted — IMLS
- 2020-03-11 Price Changed $203,000 IMLS
- 2020-02-11 Pending — IMLS
- 2020-01-24 Relisted — IMLS
- 2019-10-26 Pending — IMLS
- 2019-10-23 Price Changed $248,000 IMLS
- 2019-10-13 Price Changed $267,000 IMLS
- 2019-10-02 Price Changed $279,000 IMLS
- 2019-09-21 Price Changed $289,000 IMLS
- 2019-09-20 Relisted — IMLS
- 2019-09-14 Pending — IMLS
- 2019-09-11 Listed $309,000 IMLS
- 2016-02-12 Listed $169,900 IMLS
- 2013-04-29 Sold (Public Records) — Public Records
- 2010-11-15 Listed $108,000 IMLS
- 2010-11-15 Listed $108,000 IMLS
- 2009-05-12 Listed $150,000 IMLS
Cash-flow waterfall
monthlySold comps — $/sqft
last 12 mo · ≤1 miLoading sold comps…