 Multi-family
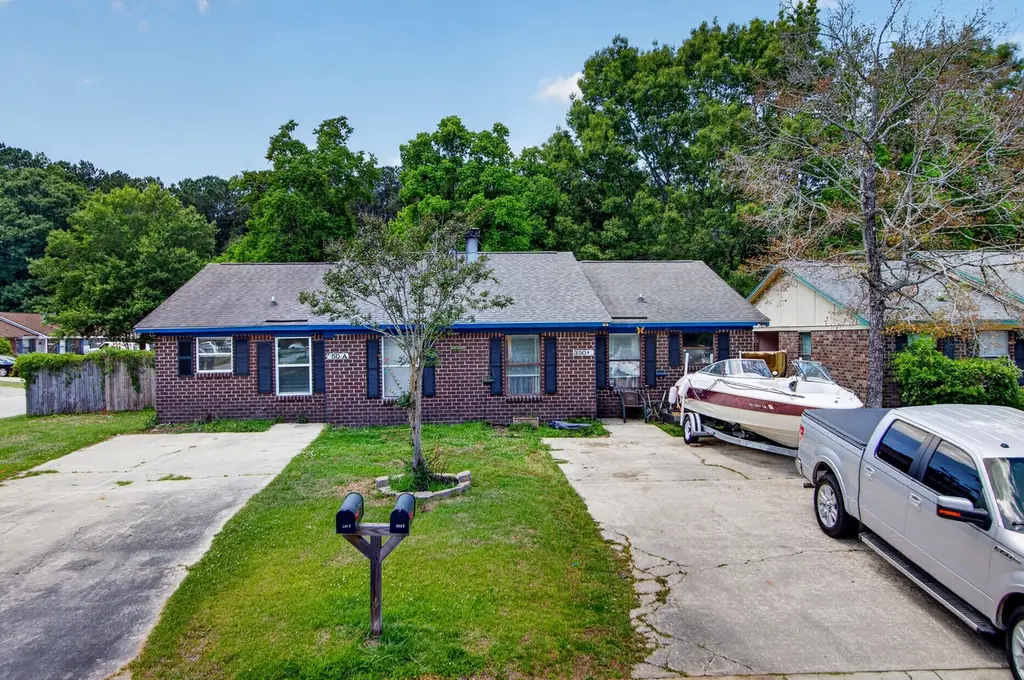
350 Dorchester Manor Blvd Unit A · North Charleston, SC
Flood risk 1/10 · Minimal
- FEMA flood zone
- X (unshaded)
- Chance of flooding over 30 yrs
- 0.0%
- Est. flood insurance / yr
- $507 – $1,088
Fire risk 3/10 · Minor
- Est. fire insurance / yr
- $783 – $1,453
Heat risk 9/10 · Severe
- Hot days now (above 107°F)
- 7 days/yr
- Hot days in 30 yrs
- 18 days/yr
Wind risk 8/10 · Major
- Chance of severe wind over 30 yrs
- 99.0%
Air-quality risk 2/10 · Minimal
- Unhealthy air days now
- 2 days/yr
- Unhealthy air days in 30 yrs
- 2 days/yr
Risk factors via First Street. Map © Google.
Why this score? — see what drove the C grade
The composite is a weighted blend of 9 inputs, each scored 0–100. Each bar is that input's sub-score; the figure is the points it added to the 100-point composite (weight × sub-score).
- Cash flow +19.7/30.0
- ARV discount +13.5/15.0
- DSCR +6.2/10.0
- 1% rule +4.6/10.0
- Schools +4.1/10.0
- Livability +3.3/5.0
- Rent growth +3.0/5.0
- Condition / age +2.5/5.0
- Appreciation +0.0/10.0
$335,000
🖨 Deal sheet 📄 Offer letter ✓ Due diligence
Multi-family units
County records classify this as Multi-Family (2-4 Unit). Listing-text estimate: 1 unit. estimate disagrees with records
Listing remarks
Excellent investment opportunity or owner-occupant purchase with income potential! This well-maintained duplex features two identical 2-bedroom, 2-bathroom units, offering a functional layout and desirable location close to shopping, dining, major employers, and convenient highway access. One unit is currently vacant, providing the perfect opportunity for an owner-occupant or investor to set market rent immediately. Inside, you'll find a spacious living room anchored by a cozy wood-burning fireplace, creating a warm and inviting gathering space. The kitchen is conveniently located just off the living area and offers abundant counter space and cabinetry for storage and meal preparation. Both
Key facts
- Desirable location
- Functional layout
- Spacious living room
Tags
Property features AI
Exterior
- Parking: Off-street parking
- Utilities: Public sewer; Dominion Energy service
- Home design: Single-family detached home; One level; Located in Dorchester Manor subdivision
- Exterior features: Lot between 0 and 0.5 acre; No other structures
Interior
- Bedrooms: 4 bedrooms
- Bathrooms: 4 bathrooms
- Heating & cooling: Heat pump
- Interior features: Family room; One fireplace
Neighborhood map
What this means for you Summary
Snapshot
- This is a 4-bed/4.0-bath multifamily listed at $335k.
Deal economics
- At list price, monthly cash flow is $395 ($5k/yr) — positive.
- The deal already cash-flows at list — no discount required.
- To meet the 1% rule (rent ≥ 1% of price), the offer needs to be $322k (3.9% below list).
- Recommended offer: $322k (3.9% below list) — sets the bar for 1% rule.
- Cap rate 7.7% vs local median 4.0% in North Charleston — top-decile yield for the area; either an underpriced asset or a hidden risk that comps aren't pricing in. Stress-test before assuming the spread holds.
Location & tenants
- Location reads 66/100 on livability (#122 in SC) — a middle-class / working-renter tenant base. Strengths: housing A+, health & safety A+, cost of living A; Watch: employment C-, crime F, amenities F.
- Dorchester 02 (suburban): math 40% / reading 55% proficiency, ranked #12 of 80 in SC (top 15%) — families likely to look elsewhere, expect single-tenant / working-renter base with shorter leases.
- Zoned schools: Eagle Nest Elementary (math 36% / reading 37%, grade F, #328 of 597 statewide, top 55%, 680 students, 82% FRL); River Oaks Middle (math 14% / reading 32%, grade F, #171 of 229 statewide, top 76%, 849 students, 84% FRL); Fort Dorchester High (math 58% / reading 88%, grade B+, #44 of 196 statewide, top 23%, 2,312 students, 62% FRL) — zoned schools average 76% FRL vs 36% district-wide (40 pts higher); higher-poverty schools than district average — tighter screening recommended.
- Market conditions: Rents rising (+1.8%/yr); 129 active listings in the ZIP; 19 comparable units currently listed for rent nearby; rentals at typical pace (median 14d on market — plan ~3-4 weeks tenant-placement turnaround); 1,199 units permitted in Dorchester County in 2024 (0 in 5+ unit buildings).
- At $3,219/mo this rent would consume 53% of the median local household income ($73k/yr) (locally 738% of renters already pay >50% of income on rent) — very limited rent-growth headroom before tenants either downsize or default.
Forward outlook
- Local home prices are declining (-3.0%/yr); year-one equity from $2k of loan paydown is wiped out by about $10k of value loss. Plan a longer hold.
- Dorchester County population projected at +43% by 2050 — long-run rental-demand tailwind backs the buy-and-hold thesis.
Negotiation context
- Only 2 days on market — expect competitive offers; lowballing is unlikely to land.
Risks & watch-outs
- Climate carrying-cost: severe wind risk, 99% chance of damaging wind over 30y; extreme-heat days projected 7→18/yr by 2055 (HVAC capex compounding) — expect insurance premiums to compound above CPI over the hold.
Questions for the listing agent
- Is there a deadline driving the sale (1031 exchange, divorce, estate, relocation)? That informs how much negotiation room exists.
- Crime grade is F in this area — have there been break-ins, vandalism, or insurance claims at this property in the last 3 years? What carrier currently insures it and at what premium?
- What's the average days-on-market for RENTAL listings here right now (not sales)? A rising rental-DOM trend means longer vacancies and softer asking-rent achievability than the comps imply.
- What's the recent tenant-quality profile in this submarket — average credit score on applications, eviction rate, late-payment / NSF rate, and stable-employment percentage? A property-management company in the area should have these aggregated.
- How much new apartment / multifamily construction is in the pipeline within 1–3 miles? Heavy new supply (>2% of stock underway) typically softens rents 12–24 months out; light construction supports rent growth.
Investment metrics
- 1% rule
- 0.96% ✗
- Cap rate
- 7.71%
- Cash-on-cash
- 5.06%
- DSCR
- 1.22
- GRM
- 8.7
CMA / ARV
- ARV (on-the-fly)
- $386,313
- Comps found
- 5
Show comp detail 5 sales within ~0.75 mi
| Address | Dist | Beds/Ba | Sqft | Sold | Price | $/sf | Match |
|---|---|---|---|---|---|---|---|
| 127 Cedar Grove Dr Unit A&B | 0.07mi | 4/4.0 | 2,112 (0%) | 1mo | $395,000 | $187 | 96 |
| 182 Dorchester Manor Blvd Unit A&B | 0.08mi | 4/4.0 | 2,112 (0%) | 6mo | $385,000 | $182 | 91 |
| 117 Cedar Grove Dr Unit A&B | 0.12mi | 4/4.0 | 2,110 (-0%) | 16mo | $337,500 | $160 | 81 |
| 119 Cedar Grove Dr Unit A & B | 0.11mi | 4/4.0 | 1,916 (-9%) | 6mo | $350,000 | $183 | 74 |
| 109 Cedar Grove Dr | 0.17mi | 4/4.0 | 1,916 (-9%) | 23mo | $399,000 | $208 | 58 |
Match score weights: distance 35% · size 25% · config 20% · recency 20%. Top-matched comps best support the ARV.
Projected returns pro-forma
-3.0% appreciation · 1.83% rent growth · sell at horizon
- IRR
- -9.7%
- Equity multiple
- 0.65×
- Total profit
- $-32,915
- Equity at exit
- $49,950
- IRR
- -1.9%
- Equity multiple
- 0.88×
- Total profit
- $-11,487
- Equity at exit
- $28,965
Cash invested: $93,800 (down + closing). Projections, not guarantees.
Landlord ↔ Tenant lean methodology
- Overall (STATE)
- 90 Strongly Landlord-Friendly
- State South Carolina
- 90 Strongly Landlord-Friendly · R+6
- County
- — inherits STATE
- City
- — inherits STATE
ZIP-level market 29420
- Home prices YoY
- -14.6%
- Rents YoY
- 1.8%
- Active inventory
- 129
- Price-to-rent
- 17.3×
Monthly cashflow live
- Estimated rent
- $3,219 high interval (Pro) →
- Mortgage (P&I)
- −$1,757
- Tax from tax record
- −$251 /mo · $3,018/yr
- Insurance
- −$140
- HOA
- −$0
- Vacancy / Maint / Mgmt
- −$676
- Net cashflow
- $395
Break-even live
2-unit breakdown (identical units grouped — click to expand)
| Units | Beds | Baths | Est. rent |
|---|---|---|---|
| 2× units | 2 | 2 | $3,218 |
| #1 | 2 | 2 | $1,609 |
| #2 | 2 | 2 | $1,609 |
| Total (2 units) | $3,219 | ||
UW: 25.0% down · 7.5% · 30yr · 1.5% tax · 5.0% vac · 8.0% maint · 8.0% mgmt
Financing live
Cash to close
- Down payment
- $83,750
- Closing costs
- $10,050
- Reserves months
- —
- Total cash needed
- —
Loan-product check · same deal, 3 products live
Conventional
25% down · 7.5% · 30yr
- Down + closing
- —
- Monthly P&I
- —
- Monthly cashflow
- —
- DSCR
- —
- Eligible?
- —
Personal DTI + credit; lowest rate.
DSCR
20% down · 8.5% · 30yr
- Down + closing
- —
- Monthly P&I
- —
- Monthly cashflow
- —
- DSCR
- —
- Eligible?
- —
No personal income docs; deal must DSCR.
Hard money
10% down · 12.0% · 12mo
- Down + closing
- —
- Monthly P&I
- —
- Monthly cashflow
- —
- DSCR
- —
- Eligible?
- —
Short-term bridge; refi at stabilization.
Rent comps 19 comps
| Address | Beds | Baths | Sqft | Rent | $/sqft | DOM | Units | Dist |
|---|---|---|---|---|---|---|---|---|
| 8486 William Moultrie Dr North Charleston, SC | 3.0 | 2.0 | 1454 | $2,300 | $1.58 | 2d | 1 | 0.59mi |
| 8712 Grassy Oak Trl North Charleston, SC | 3.0 | 2.5 | 1600 | $2,250 | $1.41 | 14d | 1 | 0.75mi |
| 8670 Grassy Oak Trl North Charleston, SC | 3.0 | 2.5 | 1522 | $1,925 | $1.26 | 23d | 1 | 0.81mi |
| 8040 Reagan Way North Charleston, SC | 3.0 | 2.5 | 1796 | $2,650 | $1.48 | 2d | 1 | 0.94mi |
| 8010 Triggerfish Way North Charleston, SC | 3.0 | 2.5 | 1805 | $2,250 | $1.25 | 11d | 1 | 0.95mi |
| 8988 Cat Tail Pond Rd Summerville, SC | 3.0 | 2.5 | 1790 | $2,300 | $1.28 | 23d | 1 | 0.98mi |
| 8350 Sentry Cir North Charleston, SC | 4.0 | 2.5 | 2594 | $2,725 | $1.05 | 23d | 1 | 0.99mi |
| 4105 Quincy Adams Ln North Charleston, SC | 3.0 | 2.5 | 1890 | $2,150 | $1.14 | 14d | 1 | 0.99mi |
| 8968 Cat Tail Pond Rd Summerville, SC | 3.0 | 2.5 | 1677 | $2,450 | $1.46 | 14d | 1 | 1.04mi |
| 8117 Honeysuckle Lake Dr North Charleston, SC | 2.0–3.0 | 1.5 | 1250 | $1,550 | $1.24 | 23d | 1 | 1.19mi |
| 8800 Dorchester Rd #603 North Charleston, SC | 3.0 | 2.0 | 1644 | $2,700 | $1.64 | 11d | 1 | 1.26mi |
| 9162 Maple Grove Dr Summerville, SC | 4.0 | 3.0 | 1708 | $2,325 | $1.36 | 19d | 1 | 1.32mi |
| 9162 Maple Grove Dr Unit 1 Summerville, SC | 4.0 | 2.5 | 1708 | $2,325 | $1.36 | 23d | 1 | 1.33mi |
| 8800 Dorchester Rd North Charleston, SC | 3.0 | 2.0–2.5 | 1735 | $2,474 | $1.43 | 23d | 2 | 1.36mi |
| 4821 Oak Leaf Rd Summerville, SC | 4.0 | 2.0 | 1752 | $2,199 | $1.26 | 14d | 1 | 1.36mi |
| 5410 Barnsley Dr North Charleston, SC | 4.0 | 2.5 | 2302 | $2,899 | $1.26 | 2d | 1 | 1.41mi |
| 7853 Lumberton Rd North Charleston, SC | 3.0 | 2.5 | 2063 | $2,450 | $1.19 | 14d | 1 | 1.41mi |
| 8850 Dorchester Rd North Charleston, SC | 1.0–3.0 | 1.0–2.0 | 1287 | $2,143 | $1.67 | 10d | 15 | 1.42mi |
| 5419 Blufton Ct North Charleston, SC | 3.0 | 2.0 | 1775 | $2,250 | $1.27 | 23d | 1 | 1.47mi |
Listing history 3 events
-
2026-06-03days on market $335,000 Active 2 DOM
-
2026-06-02remarks 699-char remark
-
2026-06-02$335,000 Active 1 DOM
ⓘ Source: listings_history table (triggers on properties + properties_extension) + one-shot
backfill from property_details.listing_events for pre-trigger history.
Tax reassessment forecast SC · Resets to sale price
- Current annual tax
- $3,018 · $251/mo
- Projected year-2 tax
- $3,018 · $251/mo
- Expected delta
- $0/yr ($0/mo · 0.0%)
ⓘ Screening estimate from a state-policy table — verify with the county assessor before closing.
Climate risk First Street
- Flood 1/10 Low FEMA zone X (unshaded) · 0% chance over 30 yrs
- Wildfire 3/10 Moderate
- Heat 9/10 Extreme 7 d/yr ≥107°F today · 18 d/yr by 30 yrs out
- Wind 8/10 Severe 99% chance of damaging wind over 30 yrs
- Air quality 2/10 Low 2 unhealthy d/yr today · 2 by 30 yrs out
Nearby sold comps map
Loading sold comps map…
Walkable amenities ~0.75 mi
Loading nearby amenities…
Taxation est. · year 1
- Rental income
- $38,628
- − Mortgage interest
- −$18,765
- − Property taxes
- −$3,018
- − Insurance
- −$1,675
- − Repairs & maintenance
- −$3,090
- − Management
- −$3,090
- − Depreciation
- −$9,745
- Taxable loss
- −$756
- Est. tax savings @ 24.0%
- +$181
- After-tax cash flow
- $4,924/yr
For passive investors: Depreciation is non-cash, so a rental often shows a tax loss while cash-flowing — sheltering income. Rental losses are passive: they offset passive income freely, and up to $25,000/yr can offset ordinary (W-2) income if you actively participate and your MAGI is under $100k (phasing out to $0 by $150k); unused losses carry forward. On sale, claimed depreciation is recaptured at up to 25%, and gains may owe capital-gains tax (a 1031 exchange can defer both). Figures are a year-1 estimate at your 24.0% rate — not tax advice; consult a CPA.
Schools (NCES district)
- District
- Dorchester 02
- NCES district ID
- 4502010
- Math proficiency
- 40% ▼ -13.00%
- Reading proficiency
- 55% ▼ -4.00%
- Median HH income
- $57,937
- Composite
- 41.41/100
- National rank
- #3475
- State rank
- #12 of 80 in SC
Livability — North Charleston
- Score
- 66/100
- State rank
- #122
- US rank
- #12222
Category grades
Schools grade is shown separately in the Schools card above.
Census & demographics
- County
- Dorchester County · 182,866 people
- City population
- 108,266
- Metro
- Charleston-North Charleston, SC
- Population (ZIP)
- 23,959
- Household income
- $72,661
- Rent vs Own
- Severe rent burden
- 738.0
Population outlook (Dorchester County) Hauer SSP2
- Today (2025)
- 186,982 people
- By 2030
- 203,967 · +9.1%
- By 2040
- 237,160 · +26.8%
- By 2050
- 267,479 · +43.1%
- By 2075
- 333,025 · +78.1%
- By 2100
- 366,560 · +96.0%
Race, ethnicity, and origin ACS 2023
- Neighborhood character
- Diverse neighborhood (Simpson 0.66)
- Race & ethnicity
- White 41% Black 39% Hispanic / Latino 11% Asian 5% Two or more races 3%
- Hispanic origin (detail)
- Mexican 6% Puerto Rican 1%
- Common ancestry
- Slovak 2% Italian 2% Lithuanian 1%
- Foreign-born
- 10% · Canada, China, Vietnam
- Languages at home
- 86% English-only · Spanish 10% Chinese 1% Other Asian/Pacific 1%
Political lean MEDSL · Dorchester
- 2024 margin
- R (+14.6) · D 41.8% · R 56.4% · Other 1.9%
- 2008→2024 swing
- +0.9pp no change · 2008: -15.5pp · 2024: -14.6pp
- All cycles
- 2024: R+14.6 2020: R+10.5 2016: R+17.5 2012: R+16.0 2008: R+15.5
Not yet ingested
- Civics
- —
Market trends
- HPI YoY
- ▼ -46.51%
- Current HPI
- 271.2116
- Rent YoY
- ▲ 1.83%
- Metro
- Charleston-North Charleston, SC
- State GDP YoY
- ▲ 4.51%
- F500 in state
- 2
Industry mix (Fortune 500 HQ in SC)
| Industry | F500 HQs | Revenue |
|---|---|---|
| Packaging | 1 | $7B |
|
||
Price history
1 event — show timeline
- 2026-06-01 Listed $335,000 Charleston Trident MLS
Property tax history
+5.0%/yrLatest (2025): $3,018 · +1.9% YoY. Source: county tax records.
Cash-flow waterfall
monthlySold comps — $/sqft
last 12 mo · ≤1 miLoading sold comps…