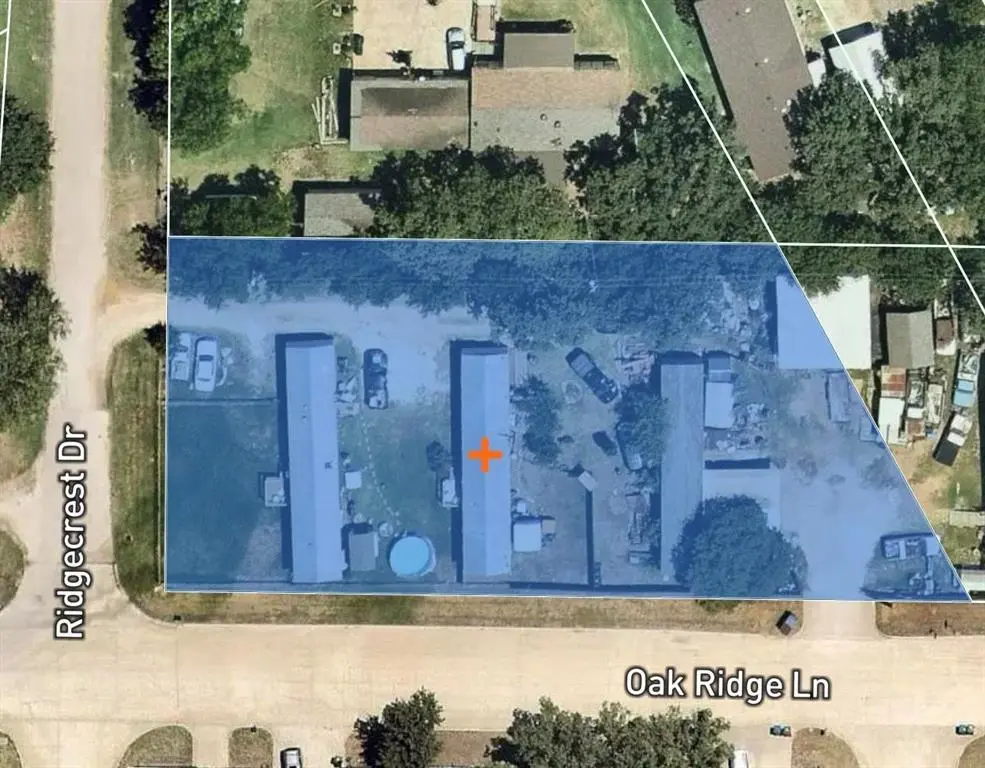
6605 Oak Ridge Ln · Flower Mound, TX
Flood risk 1/10 · Minimal
- FEMA flood zone
- X (unshaded)
- Chance of flooding over 30 yrs
- 0.0%
- Est. flood insurance / yr
- $507 – $1,088
Fire risk 5/10 · Moderate
- Est. fire insurance / yr
- $1,222 – $2,270
Heat risk 7/10 · Major
- Hot days now (above 110°F)
- 7 days/yr
- Hot days in 30 yrs
- 22 days/yr
Wind risk 4/10 · Minor
- Chance of severe wind over 30 yrs
- 24.0%
Air-quality risk 3/10 · Minor
- Unhealthy air days now
- 3 days/yr
- Unhealthy air days in 30 yrs
- 4 days/yr
Risk factors via First Street. Map © Google.
Why this score? — see what drove the C+ grade
The composite is a weighted blend of 9 inputs, each scored 0–100. Each bar is that input's sub-score; the figure is the points it added to the 100-point composite (weight × sub-score).
- Cash flow +26.2/30.0
- DSCR +8.9/10.0
- ARV discount +7.5/15.0
- Schools +6.4/10.0
- 1% rule +5.9/10.0
- Livability +3.6/5.0
- Rent growth +2.9/5.0
- Condition / age +2.5/5.0
- Appreciation +0.0/10.0
$284,997
🖨 Deal sheet 📄 Offer letter ✓ Due diligence
Listing remarks
Calling all builders!! Property boasts 3 lots total which includes a corner lot and at . 4325ac there is ample room to build! Currently has 2 mobile homes on site, with both being tenant occupied. Located in the sought after Argyle ISD school district, this property is close to shopping, entertainment and a short drive to I35!
Key facts
- Short drive to i35
- Ample room to build
- Close to shopping
Tags
Property features AI
Finance
- Other: Parcel ID: R65578; Listing accepts multiple financing types including Cash, Conventional, FHA, Owner Will Carry, USDA, VA and others; Possession at closing/funding
- Financial info: Gross annual income: $30,000; Gross annual expenses: $0; Net operating income: $0; Capitalization rate: 0%
- HOA & community: No homeowners association
Exterior
- Parking: 6 outdoor parking spaces
- Utilities: Aerobic septic; Other utilities; Not in a municipal utility district
- Home design: Multi-family residential income property; 2 buildings, 2 total units; Built in 1985
- Construction: Unknown construction materials; Other roof; Other foundation; Preowned
- Exterior features: Lot is approximately 0.432 acres; Subdivision: Stonecrest South; Will subdivide
Interior
- Kitchen: Other appliances
- Bedrooms: 6 bedrooms
- Flooring: Other flooring
- Bathrooms: 4 full bathrooms
- Heating & cooling: Other heating; Other cooling
- Interior features: One-level layout; Other interior features
- Laundry & utility: Other laundry/utility features
Neighborhood map
What this means for you Summary
Snapshot
- This is a 6-bed/4.0-bath manufactured listed at $285k.
Deal economics
- At list price, monthly cash flow is $727 ($9k/yr) — positive.
- The deal already cash-flows at list — no discount required.
- Meets the 1% rule at list price ($3k rent vs $285k).
- Recommended offer: $281k (1.5% below list) — sets the bar for market timing.
- Cap rate 9.4% vs local median 2.5% in Flower Mound — top-decile yield for the area; either an underpriced asset or a hidden risk that comps aren't pricing in. Stress-test before assuming the spread holds.
Location & tenants
- Location reads 71/100 on livability (#317 in TX) — a middle-class / working-renter tenant base. Strengths: crime A+, employment A+, housing A+; Watch: amenities F, commute F, cost of living F.
- Argyle ISD (rural): math 71% / reading 67% proficiency, ranked #8 of 826 in TX (top 1%) — acceptable for families but not a draw, mixed tenant base, ~2y average lease; only 13% free/reduced lunch — higher-income household profile.
- Zoned schools: Argyle South El (840 students, 11% FRL) — zoned schools at 11% FRL track the district average.
- Market conditions: Rents rising (+1.6%/yr); 1110 active listings in the ZIP; high-income renter base; 10,531 units permitted in Denton County in 2024 (2,713 in 5+ unit buildings).
Forward outlook
- Local home prices are declining (-3.0%/yr); year-one equity from $2k of loan paydown is wiped out by about $9k of value loss. Plan a longer hold.
- Denton County population projected at +66% by 2050 — long-run rental-demand tailwind backs the buy-and-hold thesis.
Negotiation context
- It's been on market 21 days — a 2% lower offer ($281k) is reasonable based on typical stale-listing flexibility.
- 7 sale attempts since 2y ago with the ask held roughly flat each time — persistent listings suggest the price (not the market) is what's stuck; bring a comps-based counter.
Risks & watch-outs
- Climate carrying-cost: moderate wildfire risk; extreme-heat days projected 7→22/yr by 2055 (HVAC capex compounding) — expect insurance premiums to compound above CPI over the hold.
Questions for the listing agent
- Is there a deadline driving the sale (1031 exchange, divorce, estate, relocation)? That informs how much negotiation room exists.
- Schools are A-rated — typically a magnet for longer-tenancy family renters. What's the average tenant stay here, and is there a school-zone premium baked into asking?
- What's the average days-on-market for RENTAL listings here right now (not sales)? A rising rental-DOM trend means longer vacancies and softer asking-rent achievability than the comps imply.
- What's the recent tenant-quality profile in this submarket — average credit score on applications, eviction rate, late-payment / NSF rate, and stable-employment percentage? A property-management company in the area should have these aggregated.
- How much new for-sale + rental construction is in the pipeline within 1–3 miles? Heavy new supply typically softens prices + rents 12–24 months out; constrained supply supports both.
Investment metrics
- 1% rule
- 1.09% ✓
- Cap rate
- 9.35%
- Cash-on-cash
- 10.93%
- DSCR
- 1.49
- GRM
- 7.6
CMA / ARV
No comps found within radius.
Projected returns pro-forma
-3.0% appreciation · 1.61% rent growth · sell at horizon
- IRR
- -1.4%
- Equity multiple
- 0.95×
- Total profit
- $-4,263
- Equity at exit
- $42,494
- IRR
- 6.8%
- Equity multiple
- 1.48×
- Total profit
- $38,400
- Equity at exit
- $24,641
Cash invested: $79,799 (down + closing). Projections, not guarantees.
Landlord ↔ Tenant lean methodology
- Overall (STATE)
- 87 Strongly Landlord-Friendly
- State Texas
- 87 Strongly Landlord-Friendly · R+5
- County
- — inherits STATE
- City
- — inherits STATE
ZIP-level market 76226
- Home prices YoY
- -24.4%
- Rents YoY
- 1.6%
- Active inventory
- 1110
- Price-to-rent
- 7.6×
Monthly cashflow live
- Estimated rent
- $3,107 medium interval (Pro) →
- Mortgage (P&I)
- −$1,495
- Tax from tax record
- −$114 /mo · $1,367/yr
- Insurance
- −$119
- HOA
- −$0
- Vacancy / Maint / Mgmt
- −$652
- Net cashflow
- $727
Break-even live
UW: 25.0% down · 7.5% · 30yr · 1.5% tax · 5.0% vac · 8.0% maint · 8.0% mgmt
Financing live
Cash to close
- Down payment
- $71,249
- Closing costs
- $8,550
- Reserves months
- —
- Total cash needed
- —
Loan-product check · same deal, 3 products live
Conventional
25% down · 7.5% · 30yr
- Down + closing
- —
- Monthly P&I
- —
- Monthly cashflow
- —
- DSCR
- —
- Eligible?
- —
Personal DTI + credit; lowest rate.
DSCR
20% down · 8.5% · 30yr
- Down + closing
- —
- Monthly P&I
- —
- Monthly cashflow
- —
- DSCR
- —
- Eligible?
- —
No personal income docs; deal must DSCR.
Hard money
10% down · 12.0% · 12mo
- Down + closing
- —
- Monthly P&I
- —
- Monthly cashflow
- —
- DSCR
- —
- Eligible?
- —
Short-term bridge; refi at stabilization.
Listing history 29 events
-
2026-06-18days on market $284,997 Active 21 DOM
-
2026-06-17days on market $284,997 Active 20 DOM
-
2026-06-16days on market $284,997 Active 19 DOM
-
2026-06-15days on market $284,997 Active 18 DOM
-
2026-06-13days on market $284,997 Active 16 DOM
-
2026-06-13days on market $284,997 Active 15 DOM
-
2026-06-09days on market $284,997 Active 12 DOM
-
2026-06-08days on market $284,997 Active 11 DOM
-
2026-06-07days on market $284,997 Active 10 DOM
-
2026-06-04days on market $284,997 Active 7 DOM
-
2026-06-03days on market $284,997 Active 6 DOM
-
2026-06-02days on market $284,997 Active 5 DOM
-
2026-06-01days on market $284,997 Active 4 DOM
-
2026-05-31days on market $284,997 Active 3 DOM
-
2026-05-28$284,997 Active
-
2025-12-05historical
-
2025-09-22price $250,000
-
2025-07-10historical
-
2025-04-01historical
-
2024-05-08status Active
-
2024-05-08status Active
-
2024-05-08status Active
-
2024-05-07status Option Pending
-
2024-05-07historical Active Option Contract
-
2024-04-19$150,000 Active
-
2024-01-16soldstatus
-
2024-01-09$350,000 Active
-
2024-01-09$350,000 Active
-
1983-02-01soldstatus
ⓘ Source: listings_history table (triggers on properties + properties_extension) + one-shot
backfill from property_details.listing_events for pre-trigger history.
Tax reassessment forecast TX · Resets to sale price
- Current annual tax
- $1,367 · $114/mo
- Projected year-2 tax
- $5,215 · $435/mo
- Expected delta
- +$3,849/yr (+$321/mo · 281.6%)
ⓘ Screening estimate from a state-policy table — verify with the county assessor before closing.
Climate risk First Street
- Flood 1/10 Low FEMA zone X (unshaded) · 0% chance over 30 yrs
- Wildfire 5/10 Major
- Heat 7/10 Severe 7 d/yr ≥110°F today · 22 d/yr by 30 yrs out
- Wind 4/10 Moderate 24% chance of damaging wind over 30 yrs
- Air quality 3/10 Moderate 3 unhealthy d/yr today · 4 by 30 yrs out
Nearby sold comps map
Loading sold comps map…
Walkable amenities ~0.75 mi
Loading nearby amenities…
Taxation est. · year 1
- Rental income
- $37,280
- − Mortgage interest
- −$15,964
- − Property taxes
- −$1,367
- − Insurance
- −$1,425
- − Repairs & maintenance
- −$2,982
- − Management
- −$2,982
- − Depreciation
- −$8,291
- Taxable income
- $4,268
- Est. tax owed @ 24.0%
- −$1,024
- After-tax cash flow
- $7,700/yr
For passive investors: Depreciation is non-cash, so a rental often shows a tax loss while cash-flowing — sheltering income. Rental losses are passive: they offset passive income freely, and up to $25,000/yr can offset ordinary (W-2) income if you actively participate and your MAGI is under $100k (phasing out to $0 by $150k); unused losses carry forward. On sale, claimed depreciation is recaptured at up to 25%, and gains may owe capital-gains tax (a 1031 exchange can defer both). Figures are a year-1 estimate at your 24.0% rate — not tax advice; consult a CPA.
Schools (NCES district)
- District
- Argyle ISD
- NCES district ID
- 4808670
- Math proficiency
- 71% ▼ -2.00%
- Reading proficiency
- 67% ▼ -1.00%
- Median HH income
- $108,516
- Composite
- 64.16/100
- National rank
- #568
- State rank
- #8 of 826 in TX
Livability — Flower Mound
- Score
- 71/100
- State rank
- #317
- US rank
- #7074
Category grades
Schools grade is shown separately in the Schools card above.
Census & demographics
- County
- Denton County · 901,654 people
- City population
- 75,184
- Metro
- Dallas-Fort Worth-Arlington, TX
- Population (ZIP)
- 43,587
- Household income
- $180,982
- Rent vs Own
- Severe rent burden
- 40.0
Population outlook (Denton County) Hauer SSP2
- Today (2025)
- 1,053,010 people
- By 2030
- 1,192,269 · +13.2%
- By 2040
- 1,472,920 · +39.9%
- By 2050
- 1,746,506 · +65.9%
- By 2075
- 2,358,497 · +124.0%
- By 2100
- 2,779,183 · +163.9%
Race, ethnicity, and origin ACS 2023
- Neighborhood character
- Predominantly White (76%)
- Race & ethnicity
- White 76% Hispanic / Latino 10% Two or more races 10% Asian 7% Black 4%
- Hispanic origin (detail)
- Mexican 7%
- Common ancestry
- Italian 3% Romanian 2% Portuguese 2%
- Foreign-born
- 12% · Canada, South Korea, China
- Languages at home
- 87% English-only · Spanish 5% Other Indo-European 3% Other Asian/Pacific 1%
Political lean MEDSL · Denton
- 2024 margin
- R (+13.2) · D 42.7% · R 55.8% · Other 1.5%
- 2008→2024 swing
- +11.0pp toward D · 2008: -24.2pp · 2024: -13.2pp
- All cycles
- 2024: R+13.2 2020: R+8.1 2016: R+20.2 2012: R+31.7 2008: R+24.2
Not yet ingested
- Civics
- —
Market trends
- HPI YoY
- ▼ -81.81%
- Current HPI
- 253.1948
- Rent YoY
- ▲ 1.61%
- Metro
- Dallas-Fort Worth-Arlington, TX
- State GDP YoY
- ▲ 3.95%
- F500 in state
- 110
Industry mix (Fortune 500 HQ in TX)
| Industry | F500 HQs | Revenue |
|---|---|---|
| Energy | 16 | $1,198B |
|
||
| Technology | 5 | $198B |
|
||
| Engineering / Construction | 4 | $72B |
|
||
| Energy Services | 3 | $60B |
|
||
| Utilities | 3 | $41B |
|
||
| Healthcare | 2 | $330B |
|
||
Price history
-18.6% since first listed15 events — show timeline
- 2026-05-28 Listed $284,997 NTREIS
- 2025-12-05 Listing Removed — NTREIS
- 2025-09-22 Price Changed $250,000 NTREIS
- 2025-07-10 Listing Removed — HARMLS
- 2025-04-01 Listing Removed — NTREIS
- 2024-05-08 Relisted — NTREIS
- 2024-05-08 Relisted — NTREIS
- 2024-05-08 Relisted — HARMLS
- 2024-05-07 Pending — HARMLS
- 2024-05-07 Contingent — NTREIS
- 2024-04-19 Listed $150,000 NTREIS
- 2024-01-16 Sold (Public Records) — Public Records
- 2024-01-09 Listed $350,000 HARMLS
- 2024-01-09 Listed $350,000 NTREIS
- 1983-02-01 Sold (Public Records) — Public Records
Property tax history
+2.7%/yrLatest (2025): $1,367 · +18.7% YoY. Source: county tax records.
Cash-flow waterfall
monthlySold comps — $/sqft
last 12 mo · ≤1 miLoading sold comps…