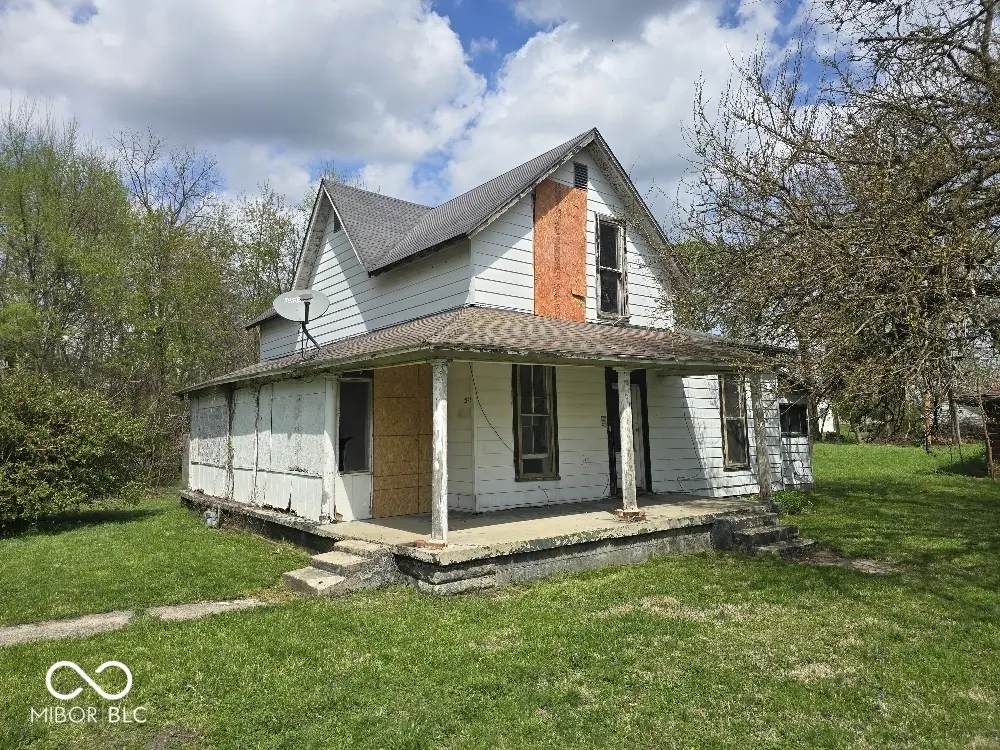
2022 Forkner St · Anderson, IN
Flood risk 7/10 · Major
- FEMA flood zone
- X (unshaded)
- Chance of flooding over 30 yrs
- 0.76%
- Est. flood insurance / yr
- $507 – $1,088
Fire risk 1/10 · Minimal
- Est. fire insurance / yr
- $717 – $1,331
Heat risk 3/10 · Minor
- Hot days now (above 100°F)
- 7 days/yr
- Hot days in 30 yrs
- 18 days/yr
Wind risk 2/10 · Minimal
- Chance of severe wind over 30 yrs
- 0.0%
Air-quality risk 3/10 · Minor
- Unhealthy air days now
- 2 days/yr
- Unhealthy air days in 30 yrs
- 3 days/yr
Risk factors via First Street. Map © Google.
Why this score? — see what drove the D grade
The composite is a weighted blend of 9 inputs, each scored 0–100. Each bar is that input's sub-score; the figure is the points it added to the 100-point composite (weight × sub-score).
- Cash flow +15.0/30.0
- ARV discount +7.5/15.0
- 1% rule +5.0/10.0
- DSCR +5.0/10.0
- Rent growth +4.5/5.0
- Livability +3.0/5.0
- Condition / age +2.5/5.0
- Schools +1.6/10.0
- Appreciation +0.0/10.0
$24,900
🖨 Deal sheet 📄 Offer letter ✓ Due diligence
Listing remarks MLS
Fixer upper two story on Anderson's west side. Good amount of square footage that will give the right investor options for a remodel. Needs extensive repair, but priced accordingly.
Key facts
- 3,350 sq ft lot
- Built 1885
- Listed 65 days
Neighborhood map
What this means for you Summary
Snapshot
- This is a 2-bed/1.0-bath single-family listed at $25k.
Deal economics
- At list price, monthly cash flow is $586 ($7k/yr) — positive.
- The deal already cash-flows at list — no discount required.
- Meets the 1% rule at list price ($1k rent vs $25k).
- Recommended offer: $23k (6.0% below list) — sets the bar for market timing.
- Cap rate 37.8% vs local median 6.5% in Anderson — top-decile yield for the area; either an underpriced asset or a hidden risk that comps aren't pricing in. Stress-test before assuming the spread holds.
Location & tenants
- Location reads 60/100 on livability (#521 in IN) — a middle-class / working-renter tenant base. Strengths: cost of living A+, housing A+; Watch: schools F, crime D-, amenities F.
- Anderson Community School Corporation (urban): math 15% / reading 23% proficiency, ranked #280 of 301 in IN (top 93%) — low school quality limits family demand, transient renter base, plan for 1-2y turnover; 70% free/reduced lunch — lower-income household profile, screen leases tightly.
- Market conditions: Rents rising fast (+7.9%/yr); 185 active listings in the ZIP; 20 comparable units currently listed for rent nearby; rentals at typical pace (median 24d on market — plan ~3-4 weeks tenant-placement turnaround); 40% of comp listings sitting > 30 days — soft ceiling on asking rent; lower-income renter base — watch delinquency; 184 units permitted in Madison County in 2024 (0 in 5+ unit buildings).
- This rent runs 35% of the median local income ($36k/yr) — at the standard rent-burdened threshold; future hikes will face affordability resistance.
Forward outlook
- Local home prices are declining (-3.0%/yr); year-one equity from $172 of loan paydown is wiped out by about $747 of value loss. Plan a longer hold.
- Madison County population projected at -14% by 2050 — secular population decline; favor cash flow + early exit over multi-decade hold.
- At projected returns (-3.0% appreciation + 7.9% rent growth), your $7k cash investment doubles in ~2 years — after that, you're playing with house money.
Negotiation context
- It's been on market 65 days — a 6% lower offer ($23k) is reasonable based on typical stale-listing flexibility.
- 2 sale attempts since 7y ago with the ask held roughly flat each time — persistent listings suggest the price (not the market) is what's stuck; bring a comps-based counter.
- Current owner paid $10k; list at $25k implies a 149% gain — meaningful room to come down on a strong offer.
Risks & watch-outs
- Watch-outs: flood insurance adds $66/mo; built in 1885 — expect roof / HVAC / electrical / plumbing capex.
- Climate carrying-cost: major flood risk — expect insurance premiums to compound above CPI over the hold.
Questions for the listing agent
- It's been on market 65 days. Have you received any prior offers? Is the seller open to a 6% concession, seller financing, or rate buy-down credit?
- Built in 1885 — when were the roof, HVAC, electrical panel, plumbing, and water heater last replaced?
- What's the actual annual flood-insurance premium (NFIP or private), and is the property in a SFHA with mandatory coverage?
- Why hasn't it sold? Are there any deal-killer items the seller is aware of (foundation, flood, title, zoning, code violations)?
- Is there a deadline driving the sale (1031 exchange, divorce, estate, relocation)? That informs how much negotiation room exists.
- Schools are F-rated, which usually means shorter tenancies and higher turnover. Who's the typical renter profile here, and what's been the actual vacancy rate?
- Crime grade is D in this area — have there been break-ins, vandalism, or insurance claims at this property in the last 3 years? What carrier currently insures it and at what premium?
- The area grade is low — what's the realistic commute time and amenity access for the typical tenant pool here? Any planned neighborhood developments (good or bad) we should know about?
- What's the average days-on-market for RENTAL listings here right now (not sales)? A rising rental-DOM trend means longer vacancies and softer asking-rent achievability than the comps imply.
- What's the recent tenant-quality profile in this submarket — average credit score on applications, eviction rate, late-payment / NSF rate, and stable-employment percentage? A property-management company in the area should have these aggregated.
- How much new for-sale + rental construction is in the pipeline within 1–3 miles? Heavy new supply typically softens prices + rents 12–24 months out; constrained supply supports both.
Investment metrics
- 1% rule
- 4.22% ✓
- Cap rate
- 37.76%
- Cash-on-cash
- 112.37%
- DSCR
- 6.00
- GRM
- 2.0
CMA / ARV
- ARV (median comp)
- $100,678
- List price
- $24,900
- Delta
- -75.27%
- Verdict
- UNDERPRICED
- Comps
- 20 within 1.0 mi
Show comp detail 12 sales within ~0.75 mi
| Address | Dist | Beds/Ba | Sqft | Sold | Price | $/sf | Match |
|---|---|---|---|---|---|---|---|
| 2223 Sheridan St | 0.37mi | 2/1.0 | 1,584 (-5%) | 10mo | $75,000 | $47 | 66 |
| 1426 Dewey St | 0.69mi | 1/1.0 (-1) | 1,670 (+0%) | 0mo | $25,000 | $15 | 62 |
| 707 W 22nd St | 0.35mi | 3/1.0 (+1) | 1,784 (+7%) | 6mo | $82,000 | $46 | 62 |
| 711 W 24th St | 0.39mi | 2/1.0 | 1,440 (-14%) | 3mo | $72,000 | $50 | 56 |
| 2626 Morton St | 0.66mi | 2/1.0 | 1,532 (-8%) | 3mo | $71,000 | $46 | 53 |
| 1201 Arrow Ave | 0.67mi | 3/1.0 (+1) | 1,621 (-3%) | 10mo | $66,000 | $41 | 50 |
| 1209 Nichol Ave | 0.56mi | 2/1.0 | 1,428 (-14%) | 2mo | $23,750 | $17 | 48 |
| 2232 Fairview St | 0.46mi | 2/1.0 | 1,912 (+15%) | 11mo | $50,000 | $26 | 45 |
| 2506 Morton St | 0.60mi | 2/1.0 | 1,510 (-10%) | 14mo | $70,000 | $46 | 45 |
| 1314 Arrow Ave | 0.56mi | 3/1.0 (+1) | 1,476 (-12%) | 12mo | $103,000 | $70 | 40 |
| 3017 Sherman St | 0.74mi | 3/1.5 (+1) | 1,775 (+6%) | 14mo | $175,000 | $99 | 36 |
| 2908 Fairview St | 0.74mi | 3/1.0 (+1) | 1,898 (+14%) | 12mo | $154,900 | $82 | 28 |
Match score weights: distance 35% · size 25% · config 20% · recency 20%. Top-matched comps best support the ARV.
Projected returns pro-forma
-3.0% appreciation · 7.88% rent growth · sell at horizon
- IRR
- —
- Equity multiple
- 6.56×
- Total profit
- $38,794
- Equity at exit
- $3,713
- IRR
- —
- Equity multiple
- 16.31×
- Total profit
- $106,722
- Equity at exit
- $2,153
Cash invested: $6,972 (down + closing). Projections, not guarantees.
Landlord ↔ Tenant lean methodology
- Overall (STATE)
- 90 Strongly Landlord-Friendly
- State Indiana
- 90 Strongly Landlord-Friendly · R+11
- County
- — inherits STATE
- City
- — inherits STATE
ZIP-level market 46016
- Home prices YoY
- -3.5%
- Rents YoY
- 7.9%
- Active inventory
- 185
- Price-to-rent
- 2.0×
Monthly cashflow live
- Estimated rent
- $1,052 high interval (Pro) →
- Mortgage (P&I)
- −$131
- Tax from tax record
- −$37 /mo · $447/yr
- Insurance
- −$10
- Flood insurance flood zone
- −$66 /mo · $798/yr
- HOA
- −$0
- Vacancy / Maint / Mgmt
- −$221
- Net cashflow
- $586
Break-even live
UW: 25.0% down · 7.5% · 30yr · 1.5% tax · 5.0% vac · 8.0% maint · 8.0% mgmt
Financing live
Cash to close
- Down payment
- $6,225
- Closing costs
- $747
- Reserves months
- —
- Total cash needed
- —
Loan-product check · same deal, 3 products live
Conventional
25% down · 7.5% · 30yr
- Down + closing
- —
- Monthly P&I
- —
- Monthly cashflow
- —
- DSCR
- —
- Eligible?
- —
Personal DTI + credit; lowest rate.
DSCR
20% down · 8.5% · 30yr
- Down + closing
- —
- Monthly P&I
- —
- Monthly cashflow
- —
- DSCR
- —
- Eligible?
- —
No personal income docs; deal must DSCR.
Hard money
10% down · 12.0% · 12mo
- Down + closing
- —
- Monthly P&I
- —
- Monthly cashflow
- —
- DSCR
- —
- Eligible?
- —
Short-term bridge; refi at stabilization.
Rent comps 20 comps
| Address | Beds | Baths | Sqft | Rent | $/sqft | DOM | Units | Dist |
|---|---|---|---|---|---|---|---|---|
| 1502 Cedar St Anderson, IN | 2.0 | 1.0 | 1104 | $850 | $0.77 | 43d | 1 | 0.35mi |
| 2233 Fairview St Anderson, IN | 3.0 | 1.5 | 1452 | $1,195 | $0.82 | 23d | 1 | 0.43mi |
| 1310 W 13th St Anderson, IN | 2.0 | 1.0 | 1178 | $895 | $0.76 | 2d | 1 | 0.49mi |
| 1121 Victory Ct Anderson, IN | 3.0 | 1.0 | 2053 | $1,295 | $0.63 | 22d | 1 | 0.59mi |
| 229 W 19th St Anderson, IN | 3.0 | 1.0 | 1200 | $1,000 | $0.83 | 43d | 1 | 0.62mi |
| 2613 Louise St Anderson, IN | 2.0 | 1.0 | 1096 | $950 | $0.87 | 22d | 1 | 0.67mi |
| 1532 Walton St Anderson, IN | 3.0 | 1.0 | 1342 | $1,100 | $0.82 | 43d | 1 | 0.70mi |
| 2627 Chase St Anderson, IN | 3.0 | 1.0 | 1050 | $850 | $0.81 | 17d | 1 | 0.74mi |
| 1404 Walton St Anderson, IN | 3.0 | 1.0 | 1090 | $995 | $0.91 | 43d | 1 | 0.75mi |
| 921 W 9th St Anderson, IN | 3.0 | 2.0 | 1611 | $1,375 | $0.85 | 23d | 1 | 0.78mi |
| 2203 W 28th St Anderson, IN | 3.0 | 1.0 | 1068 | $1,000 | $0.94 | 43d | 1 | 0.88mi |
| 820 W 7th St Apt A Anderson, IN | 2.0 | 2.0 | 1400 | $1,200 | $0.86 | 23d | 1 | 0.95mi |
| 3021 Delaware St Anderson, IN | 2.0 | 1.0 | 1154 | $1,150 | $1.00 | 7d | 1 | 0.99mi |
| 120 W 10th St Anderson, IN | 1.0–3.0 | 1.0 | 1066 | $1,025 | $0.96 | 1d | 1 | 1.01mi |
| 1212 W 5th St Anderson, IN | 3.0 | 1.0 | 1252 | $1,295 | $1.03 | 12d | 1 | 1.03mi |
| 510 W 5th St Anderson, IN | 3.0 | 1.5 | 1617 | $995 | $0.62 | 43d | 1 | 1.13mi |
| 228 E 29th St Anderson, IN | 3.0 | 2.0 | 1440 | $1,295 | $0.90 | 4d | 1 | 1.17mi |
| 2023 McKinley St Anderson, IN | 2.0 | 1.0 | 1500 | $950 | $0.63 | 43d | 1 | 1.40mi |
| 3006 Noble St Anderson, IN | 2.0 | 1.0 | 1064 | $995 | $0.94 | 7d | 1 | 1.43mi |
| 2916 W 12th St Anderson, IN | 3.0 | 1.0 | 1271 | $1,295 | $1.02 | 43d | 1 | 1.50mi |
Listing history 19 events
-
2026-06-18days on market $24,900 Active 65 DOM
-
2026-06-17days on market $24,900 Active 64 DOM
-
2026-06-16days on market $24,900 Active 63 DOM
-
2026-06-15days on market $24,900 Active 62 DOM
-
2026-06-13days on market $24,900 Active 60 DOM
-
2026-06-09days on market $24,900 Active 56 DOM
-
2026-06-08days on market $24,900 Active 55 DOM
-
2026-06-07days on market $24,900 Active 54 DOM
-
2026-06-05days on market $24,900 Active 51 DOM
-
2026-06-03days on market $24,900 Active 50 DOM
-
2026-06-02days on market $24,900 Active 49 DOM
-
2026-06-01days on market $24,900 Active 48 DOM
-
2026-05-31days on market $24,900 Active 47 DOM
-
2026-04-13$24,900 Active 183-char remark
Show marketing remark (183 chars)
Fixer upper two story on Anderson's west side. Good amount of square footage that will give the right investor options for a remodel. Needs extensive repair, but priced accordingly.
-
2020-03-10soldstatus $10,000 Sold 92-char remark
Show marketing remark (92 chars)
4 bedroom with a bunch of potential. New main water line redone recently. Large front porch.
-
2020-03-09status Pending 92-char remark
Show marketing remark (92 chars)
4 bedroom with a bunch of potential. New main water line redone recently. Large front porch.
-
2019-10-14price $13,500 92-char remark
Show marketing remark (92 chars)
4 bedroom with a bunch of potential. New main water line redone recently. Large front porch.
-
2019-09-05price $19,000 92-char remark
Show marketing remark (92 chars)
4 bedroom with a bunch of potential. New main water line redone recently. Large front porch.
-
2019-05-17$25,000 Active 92-char remark
Show marketing remark (92 chars)
4 bedroom with a bunch of potential. New main water line redone recently. Large front porch.
ⓘ Source: listings_history table (triggers on properties + properties_extension) + one-shot
backfill from property_details.listing_events for pre-trigger history.
Tax reassessment forecast IN · Partial reset (capped growth)
- Current annual tax
- $447 · $37/mo
- Projected year-2 tax
- $447 · $37/mo
- Expected delta
- $0/yr ($0/mo · 0.0%)
ⓘ Screening estimate from a state-policy table — verify with the county assessor before closing.
Climate risk First Street
- Flood 7/10 Severe FEMA zone X (unshaded) · 76% chance over 30 yrs
- Wildfire 1/10 Low
- Heat 3/10 Moderate 7 d/yr ≥100°F today · 18 d/yr by 30 yrs out
- Wind 2/10 Low 0% chance of damaging wind over 30 yrs
- Air quality 3/10 Moderate 2 unhealthy d/yr today · 3 by 30 yrs out
Nearby sold comps map
Loading sold comps map…
Walkable amenities ~0.75 mi
Loading nearby amenities…
Taxation est. · year 1
- Rental income
- $12,623
- − Mortgage interest
- −$1,395
- − Property taxes
- −$447
- − Insurance
- −$922
- − Repairs & maintenance
- −$1,010
- − Management
- −$1,010
- − Depreciation
- −$724
- Taxable income
- $7,116
- Est. tax owed @ 24.0%
- −$1,708
- After-tax cash flow
- $5,329/yr
For passive investors: Depreciation is non-cash, so a rental often shows a tax loss while cash-flowing — sheltering income. Rental losses are passive: they offset passive income freely, and up to $25,000/yr can offset ordinary (W-2) income if you actively participate and your MAGI is under $100k (phasing out to $0 by $150k); unused losses carry forward. On sale, claimed depreciation is recaptured at up to 25%, and gains may owe capital-gains tax (a 1031 exchange can defer both). Figures are a year-1 estimate at your 24.0% rate — not tax advice; consult a CPA.
Schools (NCES district)
- District
- Anderson Community School Corporation
- NCES district ID
- 1800150
- Math proficiency
- 15% ▼ -14.00%
- Reading proficiency
- 23% ▼ -7.00%
- Median HH income
- $38,208
- Composite
- 15.93/100
- National rank
- #9250
- State rank
- #280 of 301 in IN
Livability — Anderson
- Score
- 60/100
- State rank
- #521
- US rank
- #18709
Category grades
Schools grade is shown separately in the Schools card above.
Census & demographics
- Census place
- Anderson, IN
- County
- Madison County · 69,445 people
- City population
- 57,762
- Metro
- Indianapolis-Carmel-Anderson, IN
- Population (ZIP)
- 17,834
- Household income
- $36,029
- Rent vs Own
- Severe rent burden
- 1193.0
Population outlook (Madison County) Hauer SSP2
- Today (2025)
- 125,800 people
- By 2030
- 122,640 · -2.5%
- By 2040
- 115,420 · -8.3%
- By 2050
- 108,148 · -14.0%
- By 2075
- 91,838 · -27.0%
- By 2100
- 75,670 · -39.8%
Race, ethnicity, and origin ACS 2023
- Neighborhood character
- Diverse neighborhood (Simpson 0.58)
- Race & ethnicity
- White 61% Black 18% Hispanic / Latino 13% Two or more races 11% Native American 1%
- Hispanic origin (detail)
- Mexican 10% Puerto Rican 1%
- Common ancestry
- Italian 2% Slovak 1% Iranian 1%
- Foreign-born
- 4% · Canada
- Languages at home
- 86% English-only · Spanish 12%
Political lean MEDSL · Madison
- 2024 margin
- Strong R (+26.9) · D 35.6% · R 62.5% · Other 1.9%
- 2008→2024 swing
- -33.5pp toward R · 2008: 6.5pp · 2024: -26.9pp
- All cycles
- 2024: R+26.9 2020: R+22.6 2016: R+25.7 2012: R+4.5 2008: D+6.5
Not yet ingested
- Civics
- —
Market trends
- HPI YoY
- ▼ -11.12%
- Current HPI
- 302.7437
- Rent YoY
- ▲ 7.88%
- Metro
- Indianapolis-Carmel-Anderson, IN
- State GDP YoY
- ▲ 2.90%
- F500 in state
- 18
Industry mix (Fortune 500 HQ in IN)
| Industry | F500 HQs | Revenue |
|---|---|---|
| Industrial Machinery | 2 | $37B |
|
||
| Healthcare | 1 | $177B |
|
||
| Pharmaceuticals | 1 | $45B |
|
||
| Metals / Steel | 1 | $18B |
|
||
| Agriculture | 1 | $17B |
|
||
| Packaging | 1 | $12B |
|
||
Price history
-0.4% since first listed6 events — show timeline
- 2026-04-13 Listed $24,900 MIBOR as Distributed by MLS Grid
- 2020-03-10 Sold (MLS) $10,000 MIBOR as Distributed by MLS Grid
- 2020-03-09 Pending — MIBOR as Distributed by MLS Grid
- 2019-10-14 Price Changed $13,500 MIBOR as Distributed by MLS Grid
- 2019-09-05 Price Changed $19,000 MIBOR as Distributed by MLS Grid
- 2019-05-17 Listed $25,000 MIBOR as Distributed by MLS Grid
Property tax history
-2.5%/yrLatest (2024): $447 · +8.5% YoY. Source: county tax records.
Cash-flow waterfall
monthlySold comps — $/sqft
last 12 mo · ≤1 miLoading sold comps…