 🏗️ New Construction
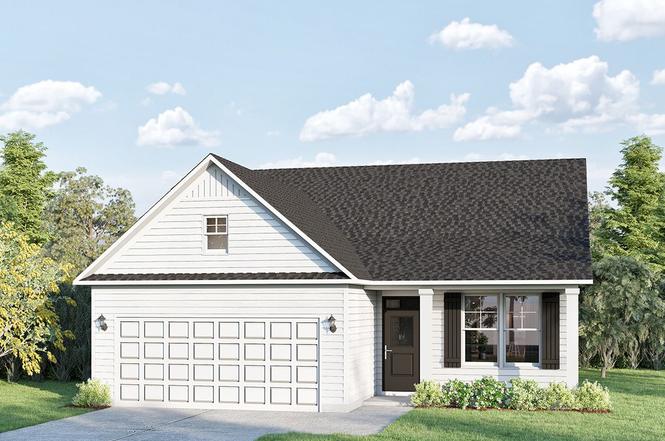
Buck Island II Plan · Blythewood, SC
Flood risk No data
- FEMA flood zone
- —
- Chance of flooding over 30 yrs
- —
- Est. flood insurance / yr
- —
Fire risk No data
- Est. fire insurance / yr
- —
Heat risk No data
- Hot days now (above threshold)
- —
- Hot days in 30 yrs
- —
Wind risk No data
- Chance of severe wind over 30 yrs
- —
Air-quality risk No data
- Unhealthy air days now
- —
- Unhealthy air days in 30 yrs
- —
Risk factors via First Street. Map © Google.
Why this score? — see what drove the D grade
The composite is a weighted blend of 9 inputs, each scored 0–100. Each bar is that input's sub-score; the figure is the points it added to the 100-point composite (weight × sub-score).
- Cash flow +13.9/30.0
- ARV discount +7.5/15.0
- DSCR +4.2/10.0
- 1% rule +3.9/10.0
- Schools +3.6/10.0
- Livability +3.5/5.0
- Rent growth +2.5/5.0
- Condition / age +2.2/5.0
- Appreciation +0.0/10.0
$286,900
🖨 Deal sheet (PDF) 📄 Offer letter ✓ Due diligence
Listing remarks
The Buck Island II offers 1,795 square feet of comfortable living space, thoughtfully designed with three bedrooms and two-and-a-half bathrooms. Several exterior elevations are available, providing a variety of brick and stone options to personalize your home's exterior. The main level features an open floor plan, seamlessly connecting the spacious great room, dining area, and kitchen. A convenient powder room is also located on the main level. The private owner's suite is conveniently located upstairs, offering a tranquil retreat with a walk-in closet and en-suite bathroom, which includes options for a tile shower and a luxurious soaking tub. Two additional well-appointed bedrooms share a
Key facts
- Covered patios
- Walk-in closet
- Soaking tub
Tags
Property features AI
Finance
- Financial info: List price available (listing active)
Exterior
- Parking: 2 parking spaces
- Utilities: Natural gas; Electric; Central air
- Home design: Single-family home (Plan); Address: Buck Island II Plan, Blythewood, SC 29016
Interior
- Bedrooms: 3 bedrooms
- Bathrooms: 2 full bathrooms and 1 half bathroom (2.5 total)
- Heating & cooling: Natural gas and electric heating; Central air conditioning
- Interior features: Plan: Buck Island II (new construction plan); Living area approximately 1,795
Neighborhood map
What this means for you Summary
Snapshot
- This is a 3-bed/2.5-bath single-family listed at $287k. Condition is rated fair.
Deal economics
- At list price, monthly cash flow is $29 ($351/yr) — positive.
- The deal already cash-flows at list — no discount required.
- To meet the 1% rule (rent ≥ 1% of price), the offer needs to be $255k (11.2% below list).
- Recommended offer: $252k (12.0% below list) — sets the bar for market timing.
Location & tenants
- Location reads 70/100 on livability (#58 in SC) — a middle-class / working-renter tenant base. Strengths: crime A+, employment A+, housing A+; Watch: amenities F, commute F, health & safety F.
- Richland 02 (suburban): math 35% / reading 47% proficiency, ranked #29 of 80 in SC (top 36%) — families likely to look elsewhere, expect single-tenant / working-renter base with shorter leases.
- Zoned schools: Muller Road Middle (math 39% / reading 58%, grade D, #193 of 597 statewide, top 33%, 1,246 students, 46% FRL); Blythewood High (math 72% / reading 92%, grade A, #19 of 196 statewide, top 10%, 2,094 students, 39% FRL) — zoned schools at 43% FRL track the district average.
- Zoned-school proficiency averages 65% at this address vs 41% district-wide (+24 pts) — the actual schools serving this property are materially stronger than the Richland 02 average implies; a family-tenant draw the district grade alone would hide.
- Market conditions: 659 active listings in the ZIP; 4 comparable units currently listed for rent nearby; rentals leasing fast (median 14d on market — plan ~1-2 weeks tenant-placement turnaround); solid renter incomes; 3,472 units permitted in Richland County in 2024 (1,096 in 5+ unit buildings).
- This rent runs 32% of the median local income ($95k/yr) — at the standard rent-burdened threshold; future hikes will face affordability resistance.
Forward outlook
- Local home prices are declining (-3.0%/yr); year-one equity from $2k of loan paydown is wiped out by about $9k of value loss. Plan a longer hold.
- Richland County population projected at +30% by 2050 — long-run rental-demand tailwind backs the buy-and-hold thesis.
Negotiation context
- It's been on market 137 days — a 12% lower offer ($252k) is reasonable based on typical stale-listing flexibility.
Questions for the listing agent
- It's been on market 137 days. Have you received any prior offers? Is the seller open to a 12% concession, seller financing, or rate buy-down credit?
- Have any recent inspections been done? Can we get a copy of the seller's disclosures and any deferred-maintenance estimates?
- Why hasn't it sold? Are there any deal-killer items the seller is aware of (foundation, flood, title, zoning, code violations)?
- Is there a deadline driving the sale (1031 exchange, divorce, estate, relocation)? That informs how much negotiation room exists.
- Schools are B-rated — typically a magnet for longer-tenancy family renters. What's the average tenant stay here, and is there a school-zone premium baked into asking?
- The area grade is low — what's the realistic commute time and amenity access for the typical tenant pool here? Any planned neighborhood developments (good or bad) we should know about?
- What's the average days-on-market for RENTAL listings here right now (not sales)? A rising rental-DOM trend means longer vacancies and softer asking-rent achievability than the comps imply.
- What's the recent tenant-quality profile in this submarket — average credit score on applications, eviction rate, late-payment / NSF rate, and stable-employment percentage? A property-management company in the area should have these aggregated.
- How much new for-sale + rental construction is in the pipeline within 1–3 miles? Heavy new supply typically softens prices + rents 12–24 months out; constrained supply supports both.
Investment metrics
- 1% rule
- 0.89% ✗
- Cap rate
- 6.42%
- Cash-on-cash
- 0.44%
- DSCR
- 1.02
- GRM
- 9.4
CMA / ARV
No comps found within radius.
Projected returns pro-forma
-3.0% appreciation · 3.0% rent growth · sell at horizon
- IRR
- -15.6%
- Equity multiple
- 0.44×
- Total profit
- $-44,587
- Equity at exit
- $42,778
- IRR
- -7.1%
- Equity multiple
- 0.55×
- Total profit
- $-36,269
- Equity at exit
- $24,806
Cash invested: $80,332 (down + closing). Projections, not guarantees.
Landlord ↔ Tenant lean methodology
- Overall (STATE)
- 90 Strongly Landlord-Friendly
- State South Carolina
- 90 Strongly Landlord-Friendly · R+6
- County
- — inherits STATE
- City
- — inherits STATE
ZIP-level market 29016
- Home prices YoY
- -26.3%
- Active inventory
- 659
- Price-to-rent
- 9.4×
Monthly cashflow live
- Estimated rent
- $2,547 medium interval (Pro) →
- Mortgage (P&I)
- −$1,505
- Tax est. 1.5%
- −$359 /mo · $4,304/yr
- Insurance
- −$120
- HOA
- −$0
- Lot rent
- −$0
- Vacancy / Maint / Mgmt
- −$535
- Net cashflow
- $29
Break-even live
Sensitivity live
| Price | -10% $228 | -5% $128 | +0% $29 | +5% $-70 | +10% $-169 |
|---|---|---|---|---|---|
| Rent | -10% $-172 | -5% $-71 | +0% $29 | +5% $130 | +10% $230 |
| Rate | -1.0pp $174 | -0.5pp $102 | base $29 | +0.5pp $-45 | +1.0pp $-121 |
UW: 25.0% down · 7.5% · 30yr · 1.5% tax · 5.0% vac · 8.0% maint · 8.0% mgmt
Financing live
Cash to close
- Down payment
- $71,725
- Closing costs
- $8,607
- Reserves months
- —
- Total cash needed
- —
Loan-product check · same deal, 3 products live
Conventional
25% down · 7.5% · 30yr
- Down + closing
- —
- Monthly P&I
- —
- Monthly cashflow
- —
- DSCR
- —
- Eligible?
- —
Personal DTI + credit; lowest rate.
DSCR
20% down · 8.5% · 30yr
- Down + closing
- —
- Monthly P&I
- —
- Monthly cashflow
- —
- DSCR
- —
- Eligible?
- —
No personal income docs; deal must DSCR.
Hard money
10% down · 12.0% · 12mo
- Down + closing
- —
- Monthly P&I
- —
- Monthly cashflow
- —
- DSCR
- —
- Eligible?
- —
Short-term bridge; refi at stabilization.
Rent comps 4 comps
| Address | Beds | Baths | Sqft | Rent | $/sqft | DOM | Units | Dist |
|---|---|---|---|---|---|---|---|---|
| 948 Beaufort Farm Rd Blythewood, SC | 3.0 | 2.5 | 1986 | $2,200 | $1.11 | 5d | 1 | 0.22mi |
| 227 Honey Hill Way Blythewood, SC | 3.0 | 2.5 | 1689 | $2,180 | $1.29 | 5d | 1 | 0.64mi |
| 242 Honey Hill Way Blythewood, SC | 4.0 | 2.5 | 1926 | $2,750 | $1.43 | 13d | 1 | 0.66mi |
| 232 Boulder Ridge Loop Blythewood, SC | 4.0 | 2.5 | 1902 | $2,299 | $1.21 | 17d | 1 | 0.88mi |
Listing history 17 events
-
2026-06-23days on market $286,900 Active 137 DOM
-
2026-06-22days on market $286,900 Active 136 DOM
-
2026-06-18days on market $286,900 Active 133 DOM
-
2026-06-17days on market $286,900 Active 132 DOM
-
2026-06-16days on market $286,900 Active 131 DOM
-
2026-06-15days on market $286,900 Active 130 DOM
-
2026-06-14days on market $286,900 Active 128 DOM
-
2026-06-13days on market $286,900 Active 127 DOM
-
2026-06-10days on market $286,900 Active 125 DOM
-
2026-06-09days on market $286,900 Active 124 DOM
-
2026-06-08days on market $286,900 Active 123 DOM
-
2026-06-07days on market $286,900 Active 122 DOM
-
2026-06-05days on market $286,900 Active 119 DOM
-
2026-06-03days on market $286,900 Active 118 DOM
-
2026-06-03days on market $286,900 Active 117 DOM
-
2026-06-01days on market $286,900 Active 116 DOM
-
2026-05-31days on market $286,900 Active 115 DOM
ⓘ Source: listings_history table (triggers on properties + properties_extension) + one-shot
backfill from property_details.listing_events for pre-trigger history.
Nearby sold comps map
Loading sold comps map…
Walkable amenities ~0.75 mi
Loading nearby amenities…
Taxation est. · year 1
- Rental income
- $30,562
- − Mortgage interest
- −$16,071
- − Property taxes
- −$4,304
- − Insurance
- −$1,434
- − Repairs & maintenance
- −$2,445
- − Management
- −$2,445
- − Depreciation
- −$8,346
- Taxable loss
- −$4,483
- Est. tax savings @ 24.0%
- +$1,076
- After-tax cash flow
- $1,427/yr
For passive investors: Depreciation is non-cash, so a rental often shows a tax loss while cash-flowing — sheltering income. Rental losses are passive: they offset passive income freely, and up to $25,000/yr can offset ordinary (W-2) income if you actively participate and your MAGI is under $100k (phasing out to $0 by $150k); unused losses carry forward. On sale, claimed depreciation is recaptured at up to 25%, and gains may owe capital-gains tax (a 1031 exchange can defer both). Figures are a year-1 estimate at your 24.0% rate — not tax advice; consult a CPA.
Condition & rehab AI · 3 photos
The home requires extensive repairs and maintenance, including roof repair, lot erosion control, and landscaping. These improvements will significantly increase its resale and rental value.
Repairs flagged
- Major roof — Significant roof damage and water damage are visible in the independent aerial image.
- Major lot erosion — The lot is heavily eroded with exposed soil, indicating a need for erosion control and landscaping.
- Major landscaping — The lot is bare with no visible vegetation or landscaping, indicating a need for landscaping and erosion control.
Value-add opportunities
- Resale roof repair — A repaired roof will significantly improve the home's appearance and reduce the risk of water damage.
- Both lot erosion control and landscaping — Erosion control and landscaping will improve the home's curb appeal and increase its resale value.
- Rental HVAC system upgrade — A modern HVAC system will improve comfort and energy efficiency, making the home more attractive to renters.
Renovation cost estimate screening
| Repair item | Severity | Est. cost |
|---|---|---|
| roof · Significant roof damage and water damage are visible in the independent aerial image. | Major | $15,000–50,000 |
| lot erosion · The lot is heavily eroded with exposed soil, indicating a need for erosion control and landscaping. | Major | $15,000–50,000 |
| landscaping · The lot is bare with no visible vegetation or landscaping, indicating a need for landscaping and erosion control. | Major | $15,000–50,000 |
| Total estimated repair cost · 3 items | $45,000–150,000 |
Value-add ROI direction
- Resale roof repair — A repaired roof will significantly improve the home's appearance and reduce the risk of water damage. ↑
- Both lot erosion control and landscaping — Erosion control and landscaping will improve the home's curb appeal and increase its resale value. ↑
- Rental HVAC system upgrade — A modern HVAC system will improve comfort and energy efficiency, making the home more attractive to renters. ↑
ⓘ Cost ranges are severity-bucket heuristics (US national rule-of-thumb). Get contractor quotes + a written scope before underwriting a rehab budget.
Schools (NCES district)
- District
- Richland 02
- NCES district ID
- 4503390
- Math proficiency
- 35% ▼ -15.00%
- Reading proficiency
- 47% ▼ -5.00%
- Median HH income
- $59,684
- Composite
- 36.2/100
- National rank
- #4730
- State rank
- #29 of 80 in SC
Livability — Blythewood
- Score
- 70/100
- State rank
- #58
- US rank
- #7406
Category grades
Schools grade is shown separately in the Schools card above.
Census & demographics
- County
- Richland County · 389,530 people
- City population
- 30,454
- Metro
- Columbia, SC
- Population (ZIP)
- 30,454
- Household income
- $95,082
- Rent vs Own
- Severe rent burden
- 559.0
Population outlook (Richland County) Hauer SSP2
- Today (2025)
- 459,667 people
- By 2030
- 487,524 · +6.1%
- By 2040
- 542,035 · +17.9%
- By 2050
- 595,371 · +29.5%
- By 2075
- 732,998 · +59.5%
- By 2100
- 820,415 · +78.5%
Race, ethnicity, and origin ACS 2023
- Neighborhood character
- Diverse neighborhood (Simpson 0.64)
- Race & ethnicity
- Black 43% White 42% Two or more races 7% Hispanic / Latino 7% Asian 3%
- Hispanic origin (detail)
- Mexican 1% Puerto Rican 2%
- Common ancestry
- Lithuanian 2% Romanian 2% Slovak 2%
- Foreign-born
- 5% · Canada, China
- Languages at home
- 90% English-only · Spanish 5% Other Indo-European 1% German/W. Germanic 1%
Political lean MEDSL · Richland
- 2024 margin
- Solid D (+34.6) · D 66.4% · R 31.8% · Other 1.8%
- 2008→2024 swing
- +5.7pp toward D · 2008: 28.9pp · 2024: 34.6pp
- All cycles
- 2024: D+34.6 2020: D+38.3 2016: D+32.9 2012: D+33.3 2008: D+28.9
Not yet ingested
- Civics
- —
Market trends
- HPI YoY
- ▼ -65.48%
- Current HPI
- 183.5933
- Rent YoY
- —
- Metro
- Columbia, SC
- State GDP YoY
- ▲ 4.51%
- F500 in state
- 2
Industry mix (Fortune 500 HQ in SC)
| Industry | F500 HQs | Revenue |
|---|---|---|
| Packaging | 1 | $7B |
|
||
Cash-flow waterfall
monthlySold comps — $/sqft
last 12 mo · ≤1 miLoading sold comps…