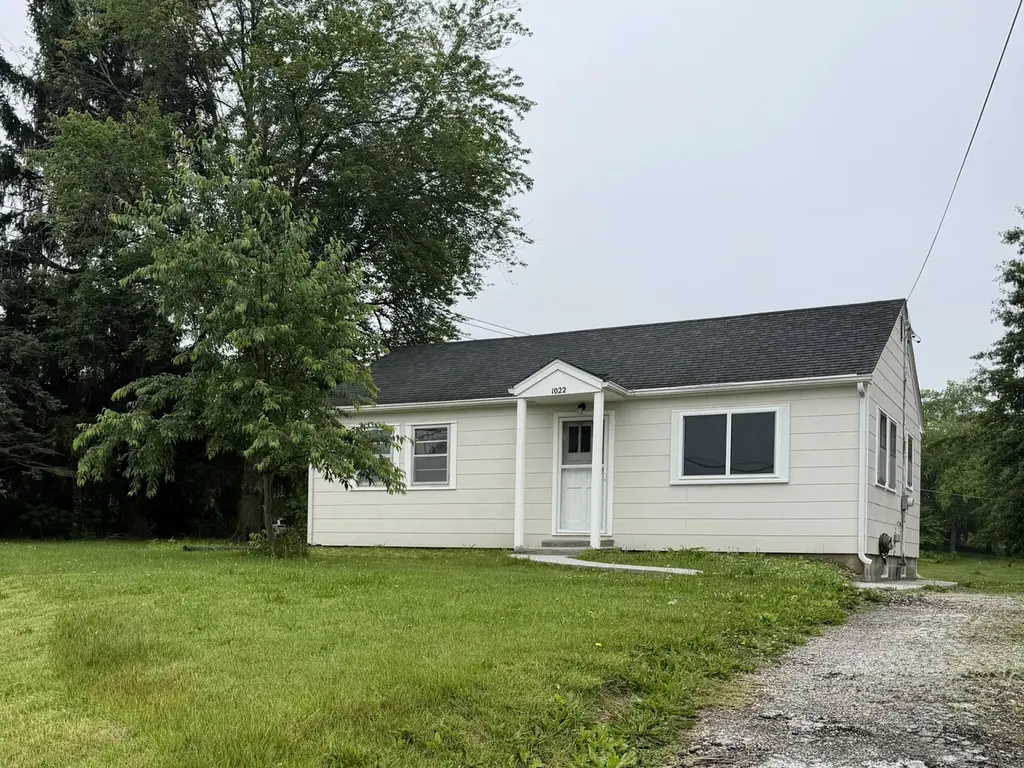
1022 Jefferson Rd · Boonville, MO
Flood risk 1/10 · Minimal
- FEMA flood zone
- X (unshaded)
- Chance of flooding over 30 yrs
- 0.0%
- Est. flood insurance / yr
- $507 – $1,088
Fire risk 3/10 · Minor
- Est. fire insurance / yr
- $1,054 – $1,958
Heat risk 4/10 · Minor
- Hot days now (above 107°F)
- 7 days/yr
- Hot days in 30 yrs
- 18 days/yr
Wind risk 2/10 · Minimal
- Chance of severe wind over 30 yrs
- —
Air-quality risk 2/10 · Minimal
- Unhealthy air days now
- 0 days/yr
- Unhealthy air days in 30 yrs
- 1 days/yr
Risk factors via First Street. Map © Google.
Why this score? — see what drove the F grade
The composite is a weighted blend of 9 inputs, each scored 0–100. Each bar is that input's sub-score; the figure is the points it added to the 100-point composite (weight × sub-score).
- Cash flow +7.6/30.0
- ARV discount +7.5/15.0
- Livability +3.1/5.0
- Schools +3.0/10.0
- Rent growth +2.5/5.0
- Condition / age +2.5/5.0
- DSCR +1.7/10.0
- 1% rule +1.0/10.0
- Appreciation +0.0/10.0
$159,000
🖨 Deal sheet 📄 Offer letter ✓ Due diligence
Listing remarks MLS
Original hardwoods, trim and doors for classic style in this home sitting on large corner lot. Updated full bath with tub/shower combo and linen closet. Fully renovated kitchen with new cabinets, floors and appliances. Option for laundry on main or basement. Basement is unfinished. Large lawn shed. Newer roof and HVAC.
Key facts
- New floors
- Large corner lot
- Updated full bath
Tags
Property features AI
Exterior
- Parking: No garage
- Utilities: Public water
- Home design: Single family residence; Residential property; R-1 one-family dwelling zoning
- Construction: Block foundation
- Exterior features: Covered rear porch; Shed(s)
Interior
- Kitchen: Refrigerator; Disposal; Dishwasher
- Bedrooms: Total rooms: 1
- Flooring: Wood flooring; Tile flooring
- Bathrooms: 1 full bathroom
- Heating & cooling: Central air conditioning; Natural gas heating
- Interior features: Eat-in kitchen; Storm door(s)
Neighborhood map
What this means for you Summary
Snapshot
- This is a 2-bed/1.0-bath other listed at $159k.
Deal economics
- At list price, monthly cash flow is $-192 ($-2k/yr) — negative.
- To cash-flow at today's rent, offer at most $125k (21.4% below list).
- To meet the 1% rule (rent ≥ 1% of price), the offer needs to be $96k (39.7% below list).
- Recommended offer: $96k (39.7% below list) — sets the bar for 1% rule.
Location & tenants
- Location reads 61/100 on livability (#410 in MO) — a middle-class / working-renter tenant base. Strengths: cost of living A+, housing A+; Watch: amenities F, commute F, employment D-.
- Boonville R-I (town): math 31% / reading 39% proficiency, ranked #215 of 324 in MO (top 66%) — families likely to look elsewhere, expect single-tenant / working-renter base with shorter leases.
- Zoned schools: Boonville High (math 32% / reading 62%, grade D-, #155 of 521 statewide, top 32%, 569 students, 40% FRL) — zoned schools at 40% FRL track the district average.
- Zoned-school proficiency averages 47% at this address vs 35% district-wide (+12 pts) — the actual schools serving this property are materially stronger than the Boonville R-I average implies; a family-tenant draw the district grade alone would hide.
- Market conditions: 138 active listings in the ZIP; 3 comparable units currently listed for rent nearby; rentals at typical pace (median 21d on market — plan ~3-4 weeks tenant-placement turnaround); 10 units permitted in Cooper County in 2024 (0 in 5+ unit buildings).
Forward outlook
- Local home prices are declining (-3.0%/yr); year-one equity from $1k of loan paydown is wiped out by about $5k of value loss. Plan a longer hold.
- Cooper County population projected to shrink 4% by 2050 — rents likely to lag national; underwrite the cash flow, not the appreciation.
Negotiation context
- Only 3 days on market — expect competitive offers; lowballing is unlikely to land.
- 3 sale attempts since 9y ago with the ask held roughly flat each time — persistent listings suggest the price (not the market) is what's stuck; bring a comps-based counter.
Risks & watch-outs
- Watch-outs: built in 1948 — expect roof / HVAC / electrical / plumbing capex.
Questions for the listing agent
- What do current leases actually rent for vs. the listed asking? Can we see a recent rent roll and the last 12 months of T-12 income?
- Built in 1948 — when were the roof, HVAC, electrical panel, plumbing, and water heater last replaced?
- Is there a deadline driving the sale (1031 exchange, divorce, estate, relocation)? That informs how much negotiation room exists.
- Schools are D-rated, which usually means shorter tenancies and higher turnover. Who's the typical renter profile here, and what's been the actual vacancy rate?
- The area grade is low — what's the realistic commute time and amenity access for the typical tenant pool here? Any planned neighborhood developments (good or bad) we should know about?
- What's the average days-on-market for RENTAL listings here right now (not sales)? A rising rental-DOM trend means longer vacancies and softer asking-rent achievability than the comps imply.
- What's the recent tenant-quality profile in this submarket — average credit score on applications, eviction rate, late-payment / NSF rate, and stable-employment percentage? A property-management company in the area should have these aggregated.
- How much new for-sale + rental construction is in the pipeline within 1–3 miles? Heavy new supply typically softens prices + rents 12–24 months out; constrained supply supports both.
Investment metrics
- 1% rule
- 0.60% ✗
- Cap rate
- 4.84%
- Cash-on-cash
- -5.18%
- DSCR
- 0.77
- GRM
- 13.8
CMA / ARV
No comps found within radius.
Projected returns pro-forma
-3.0% appreciation · 3.0% rent growth · sell at horizon
- IRR
- -25.2%
- Equity multiple
- 0.14×
- Total profit
- $-38,093
- Equity at exit
- $23,707
- IRR
- -21.5%
- Equity multiple
- -0.11×
- Total profit
- $-49,259
- Equity at exit
- $13,747
Cash invested: $44,520 (down + closing). Projections, not guarantees.
Landlord ↔ Tenant lean methodology
- Overall (STATE)
- 81 Strongly Landlord-Friendly
- State Missouri
- 81 Strongly Landlord-Friendly · R+10
- County
- — inherits STATE
- City
- — inherits STATE
ZIP-level market 65233
- Active inventory
- 138
- Price-to-rent
- 13.8×
Monthly cashflow live
- Estimated rent
- $959 medium interval (Pro) →
- Mortgage (P&I)
- −$834
- Tax from tax record
- −$50 /mo · $602/yr
- Insurance
- −$66
- HOA
- −$0
- Vacancy / Maint / Mgmt
- −$201
- Net cashflow
- $-192
Break-even live
UW: 25.0% down · 7.5% · 30yr · 1.5% tax · 5.0% vac · 8.0% maint · 8.0% mgmt
Financing live
Cash to close
- Down payment
- $39,750
- Closing costs
- $4,770
- Reserves months
- —
- Total cash needed
- —
Loan-product check · same deal, 3 products live
Conventional
25% down · 7.5% · 30yr
- Down + closing
- —
- Monthly P&I
- —
- Monthly cashflow
- —
- DSCR
- —
- Eligible?
- —
Personal DTI + credit; lowest rate.
DSCR
20% down · 8.5% · 30yr
- Down + closing
- —
- Monthly P&I
- —
- Monthly cashflow
- —
- DSCR
- —
- Eligible?
- —
No personal income docs; deal must DSCR.
Hard money
10% down · 12.0% · 12mo
- Down + closing
- —
- Monthly P&I
- —
- Monthly cashflow
- —
- DSCR
- —
- Eligible?
- —
Short-term bridge; refi at stabilization.
Rent comps 3 comps
| Address | Beds | Baths | Sqft | Rent | $/sqft | DOM | Units | Dist |
|---|---|---|---|---|---|---|---|---|
| 622 7th St Unit B Boonville, MO | 2.0 | 1.0 | 700 | $1,100 | $1.57 | 43d | 1 | 0.76mi |
| 622 7th St Unit 622 7th St-C Boonville, MO | 1.0 | 1.0 | 700 | $900 | $1.29 | 21d | 1 | 0.76mi |
| 1214 Commercial St Apt C Boonville, MO | 2.0 | 1.0 | 850 | $850 | $1.00 | 21d | 1 | 1.15mi |
Listing history 4 events
-
2026-06-05statusdays on market $159,000 Pending 3 DOM
-
2026-06-02days on market $159,000 Active 2 DOM
-
2026-06-01remarks 320-char remark
-
2026-06-01$159,000 Active 1 DOM
ⓘ Source: listings_history table (triggers on properties + properties_extension) + one-shot
backfill from property_details.listing_events for pre-trigger history.
Tax reassessment forecast MO · Resets to sale price
- Current annual tax
- $602 · $50/mo
- Projected year-2 tax
- $1,542 · $129/mo
- Expected delta
- +$940/yr (+$78/mo · 156.3%)
ⓘ Screening estimate from a state-policy table — verify with the county assessor before closing.
Climate risk First Street
- Flood 1/10 Low FEMA zone X (unshaded) · 0% chance over 30 yrs
- Wildfire 3/10 Moderate
- Heat 4/10 Moderate 7 d/yr ≥107°F today · 18 d/yr by 30 yrs out
- Wind 2/10 Low
- Air quality 2/10 Low 0 unhealthy d/yr today · 1 by 30 yrs out
Nearby sold comps map
Loading sold comps map…
Walkable amenities ~0.75 mi
Loading nearby amenities…
Taxation est. · year 1
- Rental income
- $11,512
- − Mortgage interest
- −$8,906
- − Property taxes
- −$602
- − Insurance
- −$795
- − Repairs & maintenance
- −$921
- − Management
- −$921
- − Depreciation
- −$4,625
- Taxable loss
- −$5,259
- Est. tax savings @ 24.0%
- +$1,262
- After-tax cash flow
- $-1,046/yr
For passive investors: Depreciation is non-cash, so a rental often shows a tax loss while cash-flowing — sheltering income. Rental losses are passive: they offset passive income freely, and up to $25,000/yr can offset ordinary (W-2) income if you actively participate and your MAGI is under $100k (phasing out to $0 by $150k); unused losses carry forward. On sale, claimed depreciation is recaptured at up to 25%, and gains may owe capital-gains tax (a 1031 exchange can defer both). Figures are a year-1 estimate at your 24.0% rate — not tax advice; consult a CPA.
Schools (NCES district)
- District
- Boonville R-I
- NCES district ID
- 2905580
- Math proficiency
- 31% ▼ -7.00%
- Reading proficiency
- 39% ▼ -5.00%
- Median HH income
- $44,038
- Composite
- 29.75/100
- National rank
- #6441
- State rank
- #215 of 324 in MO
Livability — Boonville
- Score
- 61/100
- State rank
- #410
- US rank
- #17337
Category grades
Schools grade is shown separately in the Schools card above.
Census & demographics
- Census place
- Boonville, MO
- Population (ZIP)
- 10,853
Population outlook (Cooper County) Hauer SSP2
- Today (2025)
- 17,611 people
- By 2030
- 17,665 · +0.3%
- By 2040
- 17,445 · -0.9%
- By 2050
- 16,916 · -3.9%
- By 2075
- 15,807 · -10.2%
- By 2100
- 13,148 · -25.3%
Race, ethnicity, and origin ACS 2023
- Neighborhood character
- Predominantly White (85%)
- Race & ethnicity
- White 85% Black 8% Two or more races 5% Hispanic / Latino 2%
- Common ancestry
- Slovak 3% Lithuanian 2% Iranian 2%
- Foreign-born
- 1%
- Languages at home
- 96% English-only · Spanish 1% German/W. Germanic 1% Chinese 1%
Political lean MEDSL · Cooper
- 2024 margin
- Solid R (+45.8) · D 26.6% · R 72.4% · Other 1.1%
- 2008→2024 swing
- -22.1pp toward R · 2008: -23.8pp · 2024: -45.8pp
- All cycles
- 2024: R+45.8 2020: R+46.3 2016: R+46.3 2012: R+32.1 2008: R+23.8
Not yet ingested
- Civics
- —
Market trends
- HPI YoY
- ▼ -214.93%
- Current HPI
- 213.6529
- Rent YoY
- —
- Metro
- —
- State GDP YoY
- ▲ 1.84%
- F500 in state
- 20
Industry mix (Fortune 500 HQ in MO)
| Industry | F500 HQs | Revenue |
|---|---|---|
| Healthcare | 1 | $163B |
|
||
| Insurance | 1 | $21B |
|
||
| Industrial Technology | 1 | $17B |
|
||
| Retail | 1 | $16B |
|
||
| Industrial Distribution | 1 | $10B |
|
||
| Utilities | 1 | $9B |
|
||
Price history
+278.6% since first listed4 events — show timeline
- 2026-05-31 Listed $159,000 CMBR
- 2026-05-31 Listed $159,000 CBORMLS
- 2017-06-15 Sold (MLS) — CMBR
- 2017-03-08 Listed $42,000 CMBR
Property tax history
+1.0%/yrLatest (2025): $602 · +7.6% YoY. Source: county tax records.
Cash-flow waterfall
monthlySold comps — $/sqft
last 12 mo · ≤1 miLoading sold comps…