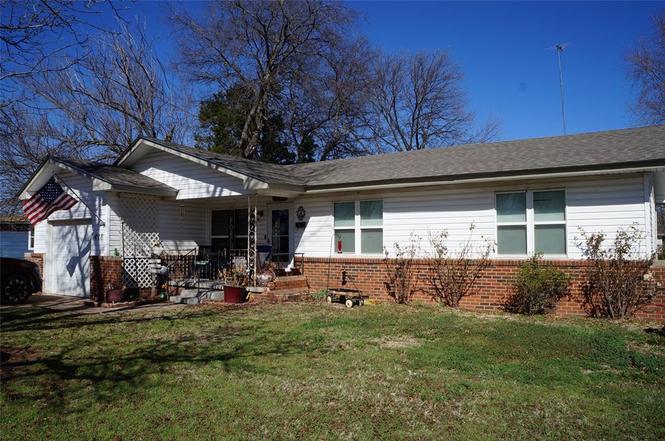
418 N Garrett Ave · Lindsay, OK
Flood risk 1/10 · Minimal
- FEMA flood zone
- X (unshaded)
- Chance of flooding over 30 yrs
- 0.0%
- Est. flood insurance / yr
- $507 – $1,088
Fire risk 5/10 · Moderate
- Est. fire insurance / yr
- $2,463 – $4,575
Heat risk 6/10 · Moderate
- Hot days now (above 109°F)
- 7 days/yr
- Hot days in 30 yrs
- 19 days/yr
Wind risk 3/10 · Minor
- Chance of severe wind over 30 yrs
- 7.0%
Air-quality risk 2/10 · Minimal
- Unhealthy air days now
- 1 days/yr
- Unhealthy air days in 30 yrs
- 1 days/yr
Risk factors via First Street. Map © Google.
Why this score? — see what drove the D+ grade
The composite is a weighted blend of 9 inputs, each scored 0–100. Each bar is that input's sub-score; the figure is the points it added to the 100-point composite (weight × sub-score).
- Cash flow +14.8/30.0
- Appreciation +8.6/10.0
- ARV discount +5.5/15.0
- DSCR +4.5/10.0
- 1% rule +3.1/10.0
- Livability +3.0/5.0
- Rent growth +2.5/5.0
- Condition / age +2.5/5.0
- Schools +2.0/10.0
$115,000
🖨 Deal sheet 📄 Offer letter ✓ Due diligence
Listing remarks MLS
OFFERED AS INSURABLE WITH $605 FOR ESCROWS. BROKERS MAY RECEIVE UP TO 5% COMMISSION. BIDDING PROCEDURES AVAILABLE @WWW.FIRSTPRESTON.COM 421-316960 BID OPENING 11/29/00 BROAD LISTING BROKER 405-631-2500
Key facts
- Covered patio
- Fenced backyard
- 0.23 acre lot
Tags
Property features AI
Finance
- Other: Homestead not claimed; Located in Blacks Manor Heig addition
- Financial info: Loan qualification possible; Not assumable
- HOA & community: No mandatory association dues
Exterior
- Parking: 1-car garage
- Utilities: No flood insurance required (per listing)
- Home design: Single family residence; One story; Property faces south; Residential property, existing
- Construction: Brick and frame construction; Composition roof; Post-tension foundation; Built (existing)
- Exterior features: Covered patio; Covered porch; Chain link fencing; Interior lot
Interior
- Bedrooms: 3 bedrooms
- Bathrooms: 1 full bath; 1 half bath
- Heating & cooling: Electric heating
- Interior features: One living area; No fireplace; No in-law plan
Neighborhood map
What this means for you Summary
Snapshot
- This is a 2-bed/1.0-bath single-family listed at $115k.
Deal economics
- At list price, monthly cash flow is $32 ($385/yr) — positive.
- The deal already cash-flows at list — no discount required.
- To meet the 1% rule (rent ≥ 1% of price), the offer needs to be $93k (19.2% below list).
- Recommended offer: $93k (19.2% below list) — sets the bar for 1% rule.
Location & tenants
- Location reads 59/100 on livability (#380 in OK) — a working-class tenant base; expect higher turnover. Strengths: cost of living A+, housing A+; Watch: crime C-, employment C-, amenities F.
- Lindsay (town): math 21% / reading 24% proficiency, ranked #141 of 270 in OK (top 52%) — low school quality limits family demand, transient renter base, plan for 1-2y turnover.
- Zoned schools: Lindsay Es (math 25% / reading 24%, grade F, #354 of 845 statewide, top 47%, 606 students, 0% FRL); Lindsay Hs (math 12% / reading 22%, grade F, #314 of 447 statewide, top 72%, 324 students, 0% FRL) — zoned schools average 0% FRL vs 46% district-wide (46 pts lower); this property's tenant base skews higher-income than the district average.
- Market conditions: 45 active listings in the ZIP; 1 units permitted in Garvin County in 2024 (0 in 5+ unit buildings).
Forward outlook
- In year one you build about $9k of equity ($795 loan paydown + $8k appreciation (7.2% local appreciation)).
- Garvin County population projected at +8% by 2050 — modest demand growth; plan on rents tracking national, not racing it.
- At projected returns (7.2% appreciation + 3.0% rent growth), your $32k cash investment doubles in ~4 years — after that, you're playing with house money.
- By year 4, paydown + projected appreciation supports a ~$31k cash-out refi (75% LTV) — recoverable capital for the next deal without selling this one.
Negotiation context
- It's been on market 114 days — a 9% lower offer ($105k) is reasonable based on typical stale-listing flexibility.
- 2 sale attempts since 26y ago; this cycle's ask has dropped $20k (15%) from the opening price — seller is motivated, your offer sets the floor, not the list.
- Current owner paid $18k; list at $115k implies a 536% gain — meaningful room to come down on a strong offer.
Risks & watch-outs
- Climate carrying-cost: moderate wildfire risk; extreme-heat days projected 7→19/yr by 2055 (HVAC capex compounding) — expect insurance premiums to compound above CPI over the hold.
Questions for the listing agent
- It's been on market 114 days. Have you received any prior offers? Is the seller open to a 19% concession, seller financing, or rate buy-down credit?
- Built in 1978 — when were the roof, HVAC, electrical panel, plumbing, and water heater last replaced?
- Why hasn't it sold? Are there any deal-killer items the seller is aware of (foundation, flood, title, zoning, code violations)?
- Is there a deadline driving the sale (1031 exchange, divorce, estate, relocation)? That informs how much negotiation room exists.
- Schools are F-rated, which usually means shorter tenancies and higher turnover. Who's the typical renter profile here, and what's been the actual vacancy rate?
- The area grade is low — what's the realistic commute time and amenity access for the typical tenant pool here? Any planned neighborhood developments (good or bad) we should know about?
- What's the average days-on-market for RENTAL listings here right now (not sales)? A rising rental-DOM trend means longer vacancies and softer asking-rent achievability than the comps imply.
- What's the recent tenant-quality profile in this submarket — average credit score on applications, eviction rate, late-payment / NSF rate, and stable-employment percentage? A property-management company in the area should have these aggregated.
- How much new for-sale + rental construction is in the pipeline within 1–3 miles? Heavy new supply typically softens prices + rents 12–24 months out; constrained supply supports both.
Investment metrics
- 1% rule
- 0.81% ✗
- Cap rate
- 6.63%
- Cash-on-cash
- 1.19%
- DSCR
- 1.05
- GRM
- 10.3
CMA / ARV
- ARV (on-the-fly)
- $110,208
- Comps found
- 4
Show comp detail 4 sales within ~0.75 mi
| Address | Dist | Beds/Ba | Sqft | Sold | Price | $/sf | Match |
|---|---|---|---|---|---|---|---|
| 606 W 7th St | 0.20mi | 2/1.0 | 912 (-7%) | 19mo | $102,000 | $112 | 62 |
| 406 Pryor Dr | 0.10mi | 3/1.0 (+1) | 864 (-12%) | 11mo | $98,000 | $113 | 60 |
| 326 Elmwood Dr | 0.31mi | 3/2.0 (+1) | 1,064 (+8%) | 18mo | $57,000 | $54 | 48 |
| 918 W Cherokee Pl | 0.75mi | 3/1.5 (+1) | 1,100 (+12%) | 8mo | $66,000 | $60 | 32 |
Match score weights: distance 35% · size 25% · config 20% · recency 20%. Top-matched comps best support the ARV.
Projected returns pro-forma
7.17% appreciation · 3.0% rent growth · sell at horizon
- IRR
- 19.0%
- Equity multiple
- 2.35×
- Total profit
- $43,358
- Equity at exit
- $80,971
- IRR
- 18.0%
- Equity multiple
- 4.86×
- Total profit
- $124,303
- Equity at exit
- $154,982
Cash invested: $32,200 (down + closing). Projections, not guarantees.
Landlord ↔ Tenant lean methodology
- Overall (STATE)
- 83 Strongly Landlord-Friendly
- State Oklahoma
- 83 Strongly Landlord-Friendly · R+20
- County
- — inherits STATE
- City
- — inherits STATE
ZIP-level market 73052
- Home prices YoY
- 3.2%
- Active inventory
- 45
- Price-to-rent
- 10.3×
Monthly cashflow live
- Estimated rent
- $929 medium interval (Pro) →
- Mortgage (P&I)
- −$603
- Tax from tax record
- −$51 /mo · $610/yr
- Insurance
- −$48
- HOA
- −$0
- Vacancy / Maint / Mgmt
- −$195
- Net cashflow
- $32
Break-even live
UW: 25.0% down · 7.5% · 30yr · 1.5% tax · 5.0% vac · 8.0% maint · 8.0% mgmt
Financing live
Cash to close
- Down payment
- $28,750
- Closing costs
- $3,450
- Reserves months
- —
- Total cash needed
- —
Loan-product check · same deal, 3 products live
Conventional
25% down · 7.5% · 30yr
- Down + closing
- —
- Monthly P&I
- —
- Monthly cashflow
- —
- DSCR
- —
- Eligible?
- —
Personal DTI + credit; lowest rate.
DSCR
20% down · 8.5% · 30yr
- Down + closing
- —
- Monthly P&I
- —
- Monthly cashflow
- —
- DSCR
- —
- Eligible?
- —
No personal income docs; deal must DSCR.
Hard money
10% down · 12.0% · 12mo
- Down + closing
- —
- Monthly P&I
- —
- Monthly cashflow
- —
- DSCR
- —
- Eligible?
- —
Short-term bridge; refi at stabilization.
Listing history 16 events
-
2026-06-18days on market $115,000 Active 114 DOM
-
2026-06-17days on market $115,000 Active 113 DOM
-
2026-06-16days on market $115,000 Active 112 DOM
-
2026-06-15days on market $115,000 Active 111 DOM
-
2026-06-13days on market $115,000 Active 109 DOM
-
2026-06-09days on market $115,000 Active 105 DOM
-
2026-06-08days on market $115,000 Active 104 DOM
-
2026-06-07days on market $115,000 Active 103 DOM
-
2026-06-03days on market $115,000 Active 99 DOM
-
2026-06-02days on market $115,000 Active 98 DOM
-
2026-06-01days on market $115,000 Active 97 DOM
-
2026-05-31days on market $115,000 Active 96 DOM
-
2026-05-20price $115,000
-
2026-02-18$135,000 Active
-
2001-04-16soldstatus $18,090 208-char remark
Show marketing remark (208 chars)
OFFERED AS INSURABLE WITH $605 FOR ESCROWS. BROKERS MAY RECEIVE UP TO 5% COMMISSION. BIDDING PROCEDURES AVAILABLE @WWW.FIRSTPRESTON.COM 421-316960 BID OPENING 11/29/00 BROAD LISTING BROKER 405-631-2500
-
2000-10-05$19,950 208-char remark
Show marketing remark (208 chars)
OFFERED AS INSURABLE WITH $605 FOR ESCROWS. BROKERS MAY RECEIVE UP TO 5% COMMISSION. BIDDING PROCEDURES AVAILABLE @WWW.FIRSTPRESTON.COM 421-316960 BID OPENING 11/29/00 BROAD LISTING BROKER 405-631-2500
ⓘ Source: listings_history table (triggers on properties + properties_extension) + one-shot
backfill from property_details.listing_events for pre-trigger history.
Tax reassessment forecast OK · Resets to sale price
- Current annual tax
- $610 · $51/mo
- Projected year-2 tax
- $1,035 · $86/mo
- Expected delta
- +$425/yr (+$35/mo · 69.7%)
ⓘ Screening estimate from a state-policy table — verify with the county assessor before closing.
Climate risk First Street
- Flood 1/10 Low FEMA zone X (unshaded) · 0% chance over 30 yrs
- Wildfire 5/10 Major
- Heat 6/10 Major 7 d/yr ≥109°F today · 19 d/yr by 30 yrs out
- Wind 3/10 Moderate 7% chance of damaging wind over 30 yrs
- Air quality 2/10 Low 1 unhealthy d/yr today · 1 by 30 yrs out
Nearby sold comps map
Loading sold comps map…
Walkable amenities ~0.75 mi
Loading nearby amenities…
Taxation est. · year 1
- Rental income
- $11,147
- − Mortgage interest
- −$6,442
- − Property taxes
- −$610
- − Insurance
- −$575
- − Repairs & maintenance
- −$892
- − Management
- −$892
- − Depreciation
- −$3,345
- Taxable loss
- −$1,608
- Est. tax savings @ 24.0%
- +$386
- After-tax cash flow
- $771/yr
For passive investors: Depreciation is non-cash, so a rental often shows a tax loss while cash-flowing — sheltering income. Rental losses are passive: they offset passive income freely, and up to $25,000/yr can offset ordinary (W-2) income if you actively participate and your MAGI is under $100k (phasing out to $0 by $150k); unused losses carry forward. On sale, claimed depreciation is recaptured at up to 25%, and gains may owe capital-gains tax (a 1031 exchange can defer both). Figures are a year-1 estimate at your 24.0% rate — not tax advice; consult a CPA.
Schools (NCES district)
- District
- Lindsay
- NCES district ID
- 4017850
- Math proficiency
- 21% ▼ -11.00%
- Reading proficiency
- 24% ▼ -11.00%
- Median HH income
- $45,406
- Composite
- 19.54/100
- National rank
- #8763
- State rank
- #141 of 270 in OK
Livability — Lindsay
- Score
- 59/100
- State rank
- #380
- US rank
- #19934
Category grades
Schools grade is shown separately in the Schools card above.
Census & demographics
- Census place
- Lindsay, OK
- City population
- 6,289
- Population (ZIP)
- 6,289
Population outlook (Garvin County) Hauer SSP2
- Today (2025)
- 28,277 people
- By 2030
- 28,619 · +1.2%
- By 2040
- 29,478 · +4.2%
- By 2050
- 30,384 · +7.5%
- By 2075
- 34,074 · +20.5%
- By 2100
- 36,099 · +27.7%
Race, ethnicity, and origin ACS 2023
- Neighborhood character
- Predominantly White (77%)
- Race & ethnicity
- White 77% Two or more races 12% Hispanic / Latino 11% Native American 4%
- Hispanic origin (detail)
- Mexican 9%
- Common ancestry
- Lithuanian 2% Iranian 1% Hungarian 1%
- Foreign-born
- 4% · Canada
- Languages at home
- 93% English-only · Spanish 7%
Political lean MEDSL · Garvin
- 2024 margin
- Solid R (+66.1) · D 16.4% · R 82.5% · Other 1.1%
- 2008→2024 swing
- -22.5pp toward R · 2008: -43.6pp · 2024: -66.1pp
- All cycles
- 2024: R+66.1 2020: R+64.2 2016: R+60.7 2012: R+46.1 2008: R+43.6
Not yet ingested
- Civics
- —
Market trends
- HPI YoY
- ▲ 7.17%
- Current HPI
- 234.17
- Rent YoY
- —
- Metro
- —
- State GDP YoY
- ▲ 1.55%
- F500 in state
- 6
Industry mix (Fortune 500 HQ in OK)
| Industry | F500 HQs | Revenue |
|---|---|---|
| Energy | 3 | $48B |
|
||
Price history
+476.4% since first listed4 events — show timeline
- 2026-05-20 Price Changed $115,000 MLSOK
- 2026-02-18 Listed $135,000 MLSOK
- 2001-04-16 Sold (MLS) $18,090 MLSOK
- 2000-10-05 Listed $19,950 MLSOK
Property tax history
+5.5%/yrLatest (2025): $610 · +10.7% YoY. Source: county tax records.
Cash-flow waterfall
monthlySold comps — $/sqft
last 12 mo · ≤1 miLoading sold comps…