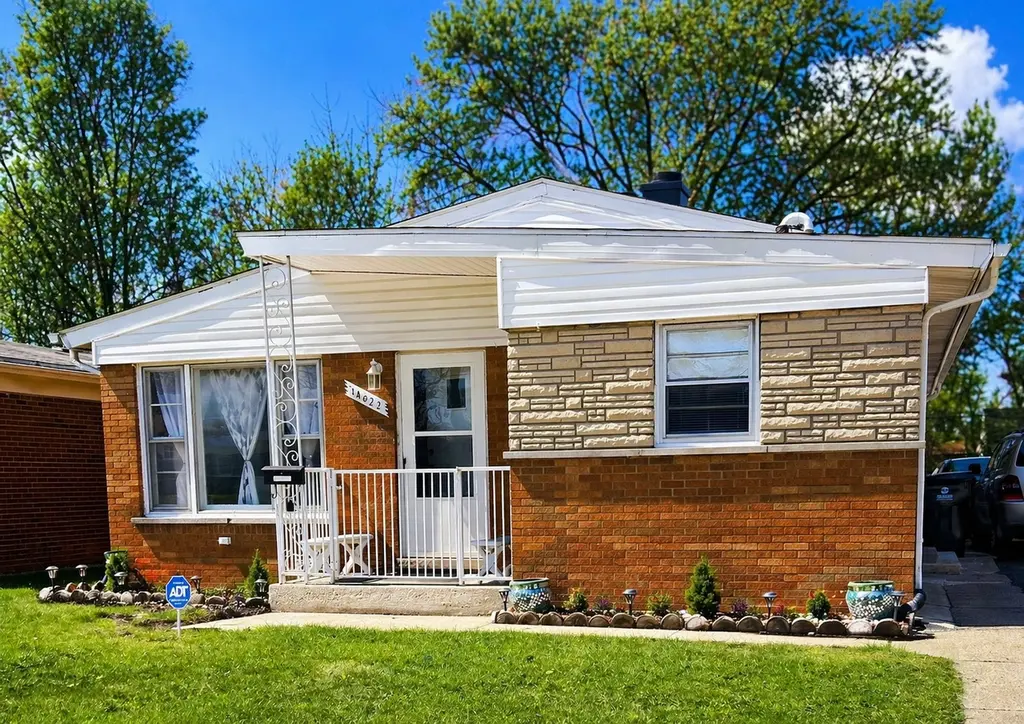
14622 Wabash Ave · Dolton, IL
Flood risk 1/10 · Minimal
- FEMA flood zone
- X (unshaded)
- Chance of flooding over 30 yrs
- 0.0%
- Est. flood insurance / yr
- $473 – $860
Fire risk 1/10 · Minimal
- Est. fire insurance / yr
- $804 – $1,492
Heat risk 3/10 · Minor
- Hot days now (above 101°F)
- 7 days/yr
- Hot days in 30 yrs
- 15 days/yr
Wind risk 2/10 · Minimal
- Chance of severe wind over 30 yrs
- —
Air-quality risk 4/10 · Minor
- Unhealthy air days now
- 4 days/yr
- Unhealthy air days in 30 yrs
- 5 days/yr
Risk factors via First Street. Map © Google.
Why this score? — see what drove the C+ grade
The composite is a weighted blend of 9 inputs, each scored 0–100. Each bar is that input's sub-score; the figure is the points it added to the 100-point composite (weight × sub-score).
- Cash flow +30.0/30.0
- DSCR +10.0/10.0
- 1% rule +9.8/10.0
- Rent growth +4.9/5.0
- Condition / age +3.8/5.0
- Livability +3.7/5.0
- Schools +0.7/10.0
- ARV discount +0.0/15.0
- Appreciation +0.0/10.0
$161,900
🖨 Deal sheet 📄 Offer letter ✓ Due diligence
Listing remarks
Step into comfort, convenience, and opportunity with this move-in-ready residence offering the perfect blend of charm and functionality. This well-maintained home features 3 generously sized bedrooms and 1 full bathroom, ideal for first-time homebuyers, growing households, or savvy investors seeking a solid addition to their portfolio. Upon entry, you're welcomed by classic hardwood flooring that flows seamlessly throughout the main living areas, adding warmth and character to the home. With a little polishing, these floors have the potential to truly shine and elevate the space even further. The kitchen is thoughtfully designed with both style and practicality in mind, featuring newer cera
Key facts
- Garage
- Built 1957
- Listed 72 days
Property features AI
Finance
- Other: Ownership is fee simple; Property is not currently leased; Possession at closing
- HOA & community: No master association fee required
Exterior
- Parking: Detached garage (garage owned) with asphalt driveway — 1 garage space, 1 total parking space
- Utilities: Lake Michigan and public water; Public sewer; 100 amp electric service
- Home design: Detached single-family home; One-story
- Construction: Brick construction; Built 61–70 years ago (built before 1978); Rehab completed in 2024; Brick/mortar foundation; Asphalt roof
- Exterior features: Lot under 0.25 acre; Lot dimensions: 5332
Interior
- Kitchen: Kitchen with island
- Bedrooms: Three bedrooms (all on the main level): Master bedroom, plus two additional bedrooms (12 x 14 and 12 x 12)
- Flooring: Hardwood flooring in living room, master bedroom and at least one additional bedroom; Vinyl flooring in kitchen; Other flooring in laundry
- Bathrooms: One full bathroom
- Appliances: Range; Refrigerator; Washer; Dryer
- Heating & cooling: Forced-air natural gas heating; Central air conditioning
- Interior features: Five total rooms
- Laundry & utility: Main-level laundry room (10 x 10) with in-unit washer/dryer hookups and gas dryer hookup; Washer and dryer listed among appliances
Neighborhood map
What this means for you Summary
Snapshot
- This is a 3-bed/1.0-bath single-family listed at $162k. Condition is rated good.
Deal economics
- At list price, monthly cash flow is $770 ($9k/yr) — positive.
- The deal already cash-flows at list — no discount required.
- Meets the 1% rule at list price ($2k rent vs $162k).
- Recommended offer: $152k (6.0% below list) — sets the bar for market timing.
- Cap rate 12.0% vs local median 9.3% in Dolton — meaningfully above typical; check what's discounted (condition, days-on-market, listing class) to confirm the premium yield is real.
Location & tenants
- Location reads 74/100 on livability (#263 in IL, #4,883 nationally) — a middle-class / working-renter tenant base. Strengths: commute A+, cost of living A+, housing A+; Watch: employment C-, health & safety C-, schools F.
- Thornton Twp Hsd 205 (suburban): math 7% / reading 8% proficiency, ranked #594 of 620 in IL (top 96%) — low school quality limits family demand, transient renter base, plan for 1-2y turnover.
- Market conditions: Rents rising fast (+9.7%/yr); 130 active listings in the ZIP; 11 comparable units currently listed for rent nearby; rentals at typical pace (median 25d on market — plan ~3-4 weeks tenant-placement turnaround); 6,272 units permitted in Cook County in 2024 (4,658 in 5+ unit buildings).
- At $2,391/mo this rent would consume 50% of the median local household income ($58k/yr) (locally 919% of renters already pay >50% of income on rent) — very limited rent-growth headroom before tenants either downsize or default.
Forward outlook
- Local home prices are declining (-3.0%/yr); year-one equity from $1k of loan paydown is wiped out by about $5k of value loss. Plan a longer hold.
- At projected returns (-3.0% appreciation + 8.0% rent growth), your $45k cash investment doubles in ~5 years — after that, you're playing with house money.
Negotiation context
- It's been on market 73 days — a 6% lower offer ($152k) is reasonable based on typical stale-listing flexibility.
- 6 sale attempts since 3y ago with the ask held roughly flat each time — persistent listings suggest the price (not the market) is what's stuck; bring a comps-based counter.
Risks & watch-outs
- Watch-outs: built in 1957 — expect roof / HVAC / electrical / plumbing capex.
Questions for the listing agent
- It's been on market 73 days. Have you received any prior offers? Is the seller open to a 6% concession, seller financing, or rate buy-down credit?
- Built in 1957 — when were the roof, HVAC, electrical panel, plumbing, and water heater last replaced?
- Why hasn't it sold? Are there any deal-killer items the seller is aware of (foundation, flood, title, zoning, code violations)?
- Is there a deadline driving the sale (1031 exchange, divorce, estate, relocation)? That informs how much negotiation room exists.
- Schools are F-rated, which usually means shorter tenancies and higher turnover. Who's the typical renter profile here, and what's been the actual vacancy rate?
- Crime grade is D in this area — have there been break-ins, vandalism, or insurance claims at this property in the last 3 years? What carrier currently insures it and at what premium?
- What's the average days-on-market for RENTAL listings here right now (not sales)? A rising rental-DOM trend means longer vacancies and softer asking-rent achievability than the comps imply.
- What's the recent tenant-quality profile in this submarket — average credit score on applications, eviction rate, late-payment / NSF rate, and stable-employment percentage? A property-management company in the area should have these aggregated.
- How much new for-sale + rental construction is in the pipeline within 1–3 miles? Heavy new supply typically softens prices + rents 12–24 months out; constrained supply supports both.
Investment metrics
- 1% rule
- 1.48% ✓
- Cap rate
- 12.00%
- Cash-on-cash
- 20.39%
- DSCR
- 1.91
- GRM
- 5.6
CMA / ARV
- ARV (on-the-fly)
- $131,531
- Comps found
- 12
Show comp detail 12 sales within ~0.75 mi
| Address | Dist | Beds/Ba | Sqft | Sold | Price | $/sf | Match |
|---|---|---|---|---|---|---|---|
| 14828 Wabash Ave | 0.26mi | 3/1.0 | 1,296 (+2%) | 1mo | $112,000 | $86 | 85 |
| 14525 S Michigan Ave | 0.14mi | 3/1.0 | 1,200 (-6%) | 2mo | $190,000 | $158 | 82 |
| 14914 Edbrooke Ave | 0.37mi | 3/1.0 | 1,287 (+1%) | 2mo | $100,000 | $78 | 80 |
| 14633 Wabash Ave | 0.04mi | 3/7.0 | 1,150 (-10%) | 1mo | $95,000 | $83 | 61 |
| 14135 S La Salle St | 0.62mi | 3/1.5 | 1,210 (-5%) | 1mo | $60,000 | $50 | 60 |
| 14231 S Dearborn St | 0.48mi | 3/1.0 | 1,116 (-13%) | 3mo | $178,000 | $159 | 54 |
| 14234 S Michigan Ave | 0.46mi | 3/1.0 | 1,102 (-14%) | 3mo | $114,000 | $103 | 53 |
| 201 E 143rd St | 0.47mi | 4/2.0 (+1) | 1,129 (-12%) | 0mo | $95,000 | $84 | 49 |
| 302 W 145th St | 0.47mi | 3/2.0 | 1,087 (-15%) | 0mo | $250,000 | $230 | 49 |
| 14619 Martin Luther King Jr Dr | 0.72mi | 3/1.0 | 1,153 (-10%) | 2mo | $163,000 | $141 | 48 |
| 15061 Wabash Ave | 0.62mi | 3/1.5 | 1,116 (-13%) | 2mo | $150,000 | $134 | 47 |
| 523 E 149th St | 0.71mi | 3/1.5 | 1,143 (-10%) | 2mo | $80,000 | $70 | 46 |
Match score weights: distance 35% · size 25% · config 20% · recency 20%. Top-matched comps best support the ARV.
Projected returns pro-forma
-3.0% appreciation · 8.0% rent growth · sell at horizon
- IRR
- 18.2%
- Equity multiple
- 1.78×
- Total profit
- $35,487
- Equity at exit
- $24,140
- IRR
- 29.9%
- Equity multiple
- 4.35×
- Total profit
- $151,721
- Equity at exit
- $13,998
Cash invested: $45,332 (down + closing). Projections, not guarantees.
Landlord ↔ Tenant lean methodology
- Overall (STATE)
- 43 Moderately Tenant-Leaning
- State Illinois
- 43 Moderately Tenant-Leaning · D+7
- County
- — inherits STATE
- City
- — inherits STATE
ZIP-level market 60419
- Home prices YoY
- -25.7%
- Rents YoY
- 9.7%
- Active inventory
- 130
- Price-to-rent
- 5.6×
Monthly cashflow live
- Estimated rent
- $2,391 high interval (Pro) →
- Mortgage (P&I)
- −$849
- Tax est. 1.5%
- −$202 /mo · $2,428/yr
- Insurance
- −$67
- HOA
- −$0
- Vacancy / Maint / Mgmt
- −$502
- Net cashflow
- $770
Break-even live
UW: 25.0% down · 7.5% · 30yr · 1.5% tax · 5.0% vac · 8.0% maint · 8.0% mgmt
Financing live
Cash to close
- Down payment
- $40,475
- Closing costs
- $4,857
- Reserves months
- —
- Total cash needed
- —
Loan-product check · same deal, 3 products live
Conventional
25% down · 7.5% · 30yr
- Down + closing
- —
- Monthly P&I
- —
- Monthly cashflow
- —
- DSCR
- —
- Eligible?
- —
Personal DTI + credit; lowest rate.
DSCR
20% down · 8.5% · 30yr
- Down + closing
- —
- Monthly P&I
- —
- Monthly cashflow
- —
- DSCR
- —
- Eligible?
- —
No personal income docs; deal must DSCR.
Hard money
10% down · 12.0% · 12mo
- Down + closing
- —
- Monthly P&I
- —
- Monthly cashflow
- —
- DSCR
- —
- Eligible?
- —
Short-term bridge; refi at stabilization.
Rent comps 11 comps
| Address | Beds | Baths | Sqft | Rent | $/sqft | DOM | Units | Dist |
|---|---|---|---|---|---|---|---|---|
| 14844 Wabash Ave Dolton, IL | 3.0 | 1.5 | 1277 | $2,320 | $1.82 | 24d | 1 | 0.30mi |
| 14124 Manor Ave Dolton, IL | 3.0 | 2.0 | 1440 | $2,390 | $1.66 | 24d | 1 | 0.71mi |
| 14305 Irving Ave Unit 2 Dolton, IL | 3.0 | 1.0 | 1100 | $2,200 | $2.00 | 24d | 1 | 1.04mi |
| 14817 Champlain Ave Dolton, IL | 2.0 | 1.0 | 980 | $2,430 | $2.48 | 22d | 1 | 1.05mi |
| 13841 Forest Ave Dolton, IL | 3.0 | 1.0 | 930 | $1,895 | $2.04 | 24d | 1 | 1.10mi |
| 14916 Langley Ave Dolton, IL | 3.0 | 1.5 | 1418 | $2,500 | $1.76 | 24d | 1 | 1.12mi |
| 13708 S Wentworth Ave Riverdale, IL | 3.0 | 1.5 | 1500 | $2,200 | $1.47 | 22d | 1 | 1.20mi |
| 14500 Cottage Grove Ave Unit 3 Dolton, IL | 2.0 | 1.0 | 1000 | $1,475 | $1.48 | 24d | 1 | 1.20mi |
| 13604 S Wentworth Ave Riverdale, IL | 3.0 | 1.0 | 1100 | $1,200 | $1.09 | 24d | 1 | 1.32mi |
| 15509 Park Ln South Holland, IL | 4.0 | 1.5 | 1200 | $3,400 | $2.83 | 24d | 1 | 1.42mi |
| 15509 Park Ln South Holland, IL | 4.0 | 1.5 | 1200 | $3,400 | $2.83 | 7d | 1 | 1.42mi |
Listing history 30 events
-
2026-06-18days on market $161,900 Active 73 DOM
-
2026-06-17days on market $161,900 Active 72 DOM
-
2026-06-16days on market $161,900 Active 71 DOM
-
2026-06-15days on market $161,900 Active 70 DOM
-
2026-06-13days on market $161,900 Active 68 DOM
-
2026-06-13days on market $161,900 Active 67 DOM
-
2026-06-09days on market $161,900 Active 64 DOM
-
2026-06-08days on market $161,900 Active 63 DOM
-
2026-06-07days on market $161,900 Active 62 DOM
-
2026-06-04days on market $161,900 Active 59 DOM
-
2026-06-03days on market $161,900 Active 58 DOM
-
2026-06-02days on market $161,900 Active 57 DOM
-
2026-06-01days on market $161,900 Active 56 DOM
-
2026-05-31days on market $161,900 Active 55 DOM
-
2026-04-29price $161,900
-
2026-04-06$169,900 Active
-
2026-03-19historical
-
2026-02-09Active
-
2026-02-09historical
-
2025-11-29price
-
2025-10-24Active
-
2024-06-27soldstatus $155,000 Closed
-
2024-05-31historical Contingent - Continue to Show
-
2024-05-20$155,000 Active
-
2024-01-02historical
-
2023-11-28Active
-
2023-09-29historical Contingent - No Showings
-
2023-09-28historical
-
2023-08-17price
-
2023-04-22Active
ⓘ Source: listings_history table (triggers on properties + properties_extension) + one-shot
backfill from property_details.listing_events for pre-trigger history.
Climate risk First Street
- Flood 1/10 Low FEMA zone X (unshaded) · 0% chance over 30 yrs
- Wildfire 1/10 Low
- Heat 3/10 Moderate 7 d/yr ≥101°F today · 15 d/yr by 30 yrs out
- Wind 2/10 Low
- Air quality 4/10 Moderate 4 unhealthy d/yr today · 5 by 30 yrs out
Nearby sold comps map
Loading sold comps map…
Walkable amenities ~0.75 mi
Loading nearby amenities…
Taxation est. · year 1
- Rental income
- $28,693
- − Mortgage interest
- −$9,069
- − Property taxes
- −$2,428
- − Insurance
- −$810
- − Repairs & maintenance
- −$2,295
- − Management
- −$2,295
- − Depreciation
- −$4,710
- Taxable income
- $7,086
- Est. tax owed @ 24.0%
- −$1,701
- After-tax cash flow
- $7,541/yr
For passive investors: Depreciation is non-cash, so a rental often shows a tax loss while cash-flowing — sheltering income. Rental losses are passive: they offset passive income freely, and up to $25,000/yr can offset ordinary (W-2) income if you actively participate and your MAGI is under $100k (phasing out to $0 by $150k); unused losses carry forward. On sale, claimed depreciation is recaptured at up to 25%, and gains may owe capital-gains tax (a 1031 exchange can defer both). Figures are a year-1 estimate at your 24.0% rate — not tax advice; consult a CPA.
Condition & rehab AI · 9 photos
This move-in-ready home offers a good condition with a good ROI potential for both resale and rental. It has a well-maintained exterior and interior, with minor updates needed to enhance its curb appeal and value.
Value-add opportunities
- Both Paint the exterior walls — Enhances curb appeal and value
- Both Replace the ceiling fans — Modernizes the space and improves airflow
- Both Install new flooring in the kitchen and bathrooms — Enhances the overall aesthetic and value
- Both Update the kitchen cabinets and countertops — Modernizes the kitchen and adds value
Renovation cost estimate screening
Value-add ROI direction
- Both Paint the exterior walls — Enhances curb appeal and value ↑
- Both Replace the ceiling fans — Modernizes the space and improves airflow ↑
- Both Install new flooring in the kitchen and bathrooms — Enhances the overall aesthetic and value ↑
- Both Update the kitchen cabinets and countertops — Modernizes the kitchen and adds value ↑
ⓘ Cost ranges are severity-bucket heuristics (US national rule-of-thumb). Get contractor quotes + a written scope before underwriting a rehab budget.
Schools (NCES district)
- District
- Thornton Twp Hsd 205
- NCES district ID
- 1738970
- Math proficiency
- 7% ▬ 0.00%
- Reading proficiency
- 8% ▼ -2.00%
- Median HH income
- $43,392
- Composite
- 6.92/100
- National rank
- #9976
- State rank
- #594 of 620 in IL
Livability — Dolton
- Score
- 74/100
- State rank
- #263
- US rank
- #4883
Category grades
Schools grade is shown separately in the Schools card above.
Census & demographics
- Census place
- Dolton, IL
- County
- Cook County · 4,486,803 people
- City population
- 20,825
- Metro
- Chicago-Naperville-Elgin, IL-IN-WI
- Population (ZIP)
- 20,825
- Household income
- $57,887
- Rent vs Own
- Severe rent burden
- 919.0
Population outlook (Cook County) Hauer SSP2
- Today (2025)
- 5,347,519 people
- By 2030
- 5,357,703 · +0.2%
- By 2040
- 5,324,924 · -0.4%
- By 2050
- 5,230,762 · -2.2%
- By 2075
- 4,785,735 · -10.5%
- By 2100
- 4,188,836 · -21.7%
Race, ethnicity, and origin ACS 2023
- Neighborhood character
- Predominantly Black (91%)
- Race & ethnicity
- Black 91% White 4% Two or more races 3% Hispanic / Latino 1%
- Common ancestry
- Romanian 1% Hispanic 1%
- Foreign-born
- 3% · Canada
- Languages at home
- 95% English-only · French/Haitian/Cajun 2% Spanish 1%
Political lean MEDSL · Cook
- 2024 margin
- Solid D (+42.0) · D 70.4% · R 28.4% · Other 1.2%
- 2008→2024 swing
- -11.4pp toward R · 2008: 53.4pp · 2024: 42.0pp
- All cycles
- 2024: D+42.0 2020: D+50.3 2016: D+53.0 2012: D+49.4 2008: D+53.4
Not yet ingested
- Civics
- —
Market trends
- HPI YoY
- ▼ -66.88%
- Current HPI
- 193.2346
- Rent YoY
- ▲ 9.65%
- Metro
- Chicago-Naperville-Elgin, IL-IN-WI
- State GDP YoY
- ▲ 1.59%
- F500 in state
- 60
Industry mix (Fortune 500 HQ in IL)
| Industry | F500 HQs | Revenue |
|---|---|---|
| Insurance | 4 | $201B |
|
||
| Consumer Goods | 4 | $87B |
|
||
| Industrial Machinery | 3 | $64B |
|
||
| Healthcare | 2 | $55B |
|
||
| Retail / Pharmacy | 1 | $148B |
|
||
| Agriculture / Food | 1 | $86B |
|
||
Price history
+4.5% since first listed16 events — show timeline
- 2026-04-29 Price Changed $161,900 MRED as Distributed by MLS Grid
- 2026-04-06 Listed $169,900 MRED as Distributed by MLS Grid
- 2026-03-19 Listing Removed — MRED as Distributed by MLS Grid
- 2026-02-09 Listing Removed — MRED as Distributed by MLS Grid
- 2026-02-09 Listed — MRED as Distributed by MLS Grid
- 2025-11-29 Price Changed — MRED as Distributed by MLS Grid
- 2025-10-24 Listed — MRED as Distributed by MLS Grid
- 2024-06-27 Sold (MLS) $155,000 MRED as Distributed by MLS Grid
- 2024-05-31 Contingent — MRED as Distributed by MLS Grid
- 2024-05-20 Listed $155,000 MRED as Distributed by MLS Grid
- 2024-01-02 Listing Removed — MRED as Distributed by MLS Grid
- 2023-11-28 Listed — MRED as Distributed by MLS Grid
- 2023-09-29 Contingent — MRED as Distributed by MLS Grid
- 2023-09-28 Listing Removed — MRED as Distributed by MLS Grid
- 2023-08-17 Price Changed — MRED as Distributed by MLS Grid
- 2023-04-22 Listed — MRED as Distributed by MLS Grid
Cash-flow waterfall
monthlySold comps — $/sqft
last 12 mo · ≤1 miLoading sold comps…