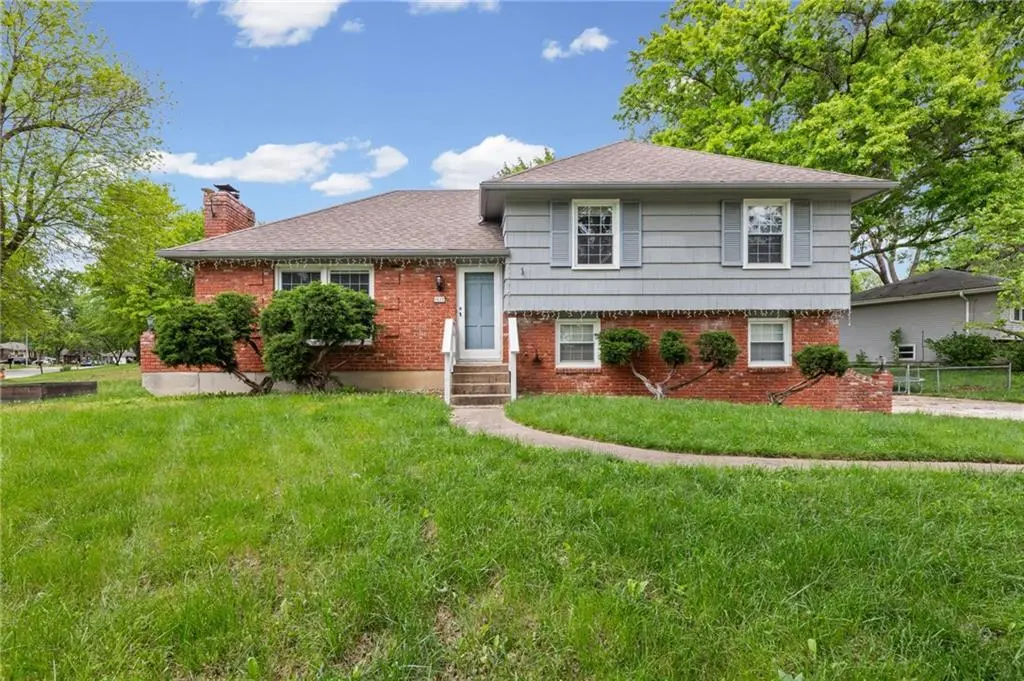
7617 NW Milrey Dr · Kansas City, MO
Flood risk 6/10 · Moderate
- FEMA flood zone
- X (unshaded)
- Chance of flooding over 30 yrs
- 0.73%
- Est. flood insurance / yr
- $473 – $860
Fire risk 1/10 · Minimal
- Est. fire insurance / yr
- $1,054 – $1,958
Heat risk 4/10 · Minor
- Hot days now (above 107°F)
- 7 days/yr
- Hot days in 30 yrs
- 17 days/yr
Wind risk 2/10 · Minimal
- Chance of severe wind over 30 yrs
- —
Air-quality risk 2/10 · Minimal
- Unhealthy air days now
- 2 days/yr
- Unhealthy air days in 30 yrs
- 2 days/yr
Risk factors via First Street. Map © Google.
Why this score? — see what drove the C- grade
The composite is a weighted blend of 9 inputs, each scored 0–100. Each bar is that input's sub-score; the figure is the points it added to the 100-point composite (weight × sub-score).
- Cash flow +11.6/30.0
- ARV discount +10.0/15.0
- Appreciation +10.0/10.0
- Schools +4.5/10.0
- Rent growth +4.3/5.0
- Livability +3.9/5.0
- DSCR +3.4/10.0
- 1% rule +3.0/10.0
- Condition / age +2.5/5.0
$270,000
🖨 Deal sheet 📄 Offer letter ✓ Due diligence
Listing remarks MLS
This charming home in the Platte Ridge subdivision comes complete with new windows, and a big backyard with a deck and shed! Step inside to be greeted by a cozy masonry fireplace. Continue into the formal dining room located just off the kitchen, that also has access to the backyard. From the kitchen you can head straight upstairs and into the master bedroom, which has a half bath en suite. The final two bedrooms are also upstairs, and all bedrooms feature beautiful wood flooring. The basement has a large recreational room that includes a bar. The basement also has an unfinished area that houses the utilities and would be great for storage!
Key facts
- 0.23 acre lot
- 2 garage spots
- Built 1968
Property features AI
Exterior
- Parking: Attached garage with 2 spaces; Garage faces side; Garage with door opener; Basement access
- Utilities: Public water; Public sewer
- Home design: Single family residence; Side/side split floor plan
- Construction: Frame construction; Composition roof
- Exterior features: Deck; Metal and wood fencing; Shed(s); Corner city lot; inside city limits
Interior
- Kitchen: Dishwasher; Disposal; Refrigerator; Electric range; Ceramic tile in kitchen; Breakfast area / kitchen-dining combo
- Bedrooms: 3 bedrooms (two on second level)
- Flooring: Carpet; Tile; Wood
- Bathrooms: 2 full bathrooms; 1 half bathroom; Second-level baths with shower-over-tub; Basement bath with shower-over-tub
- Heating & cooling: Electric heating; Electric cooling (has central cooling)
- Interior features: Wet bar; Two fireplaces (living room and basement); Recreation room
- Laundry & utility: Laundry in basement
Neighborhood map
What this means for you Summary
Snapshot
- This is a 3-bed/2.0-bath single-family listed at $270k.
Deal economics
- At list price, monthly cash flow is $-84 ($-1k/yr) — negative.
- To cash-flow at today's rent, offer at most $255k (5.5% below list).
- To meet the 1% rule (rent ≥ 1% of price), the offer needs to be $217k (19.5% below list).
- Recommended offer: $217k (19.5% below list) — sets the bar for 1% rule.
- Cap rate 5.9% vs local median 3.9% in Kansas City — top-decile yield for the area; either an underpriced asset or a hidden risk that comps aren't pricing in. Stress-test before assuming the spread holds.
Location & tenants
- Location reads 78/100 on livability (#28 in MO, #2,671 nationally) — a middle-class / working-renter tenant base. Strengths: amenities A+, commute A+, cost of living A+; Watch: crime F.
- Park Hill (urban): math 47% / reading 54% proficiency, ranked #26 of 324 in MO (top 8%) — acceptable for families but not a draw, mixed tenant base, ~2y average lease.
- Zoned schools: Prairie Point Elem. (math 49% / reading 48%, grade D, #334 of 1,115 statewide, top 30%, 422 students, 29% FRL); Park Hill High (math 70% / reading 71%, grade B+, #9 of 521 statewide, top 2%, 1,857 students, 25% FRL).
- Market conditions: Rents rising fast (+7.0%/yr); 264 active listings in the ZIP; 9 comparable units currently listed for rent nearby; rentals at typical pace (median 17d on market — plan ~3-4 weeks tenant-placement turnaround); high-income renter base; 234 units permitted in Platte County in 2024 (0 in 5+ unit buildings).
Forward outlook
- In year one you build about $29k of equity ($2k loan paydown + $27k appreciation (10.0% local appreciation)).
- Platte County population projected at +31% by 2050 — long-run rental-demand tailwind backs the buy-and-hold thesis.
- By year 2, paydown + projected appreciation supports a ~$46k cash-out refi (75% LTV) — recoverable capital for the next deal without selling this one.
Negotiation context
- Only 3 days on market — expect competitive offers; lowballing is unlikely to land.
- 2 sale attempts since 4y ago with the ask held roughly flat each time — persistent listings suggest the price (not the market) is what's stuck; bring a comps-based counter.
Risks & watch-outs
- Climate carrying-cost: major flood risk — expect insurance premiums to compound above CPI over the hold.
Questions for the listing agent
- What do current leases actually rent for vs. the listed asking? Can we see a recent rent roll and the last 12 months of T-12 income?
- Built in 1968 — when were the roof, HVAC, electrical panel, plumbing, and water heater last replaced?
- Is there a deadline driving the sale (1031 exchange, divorce, estate, relocation)? That informs how much negotiation room exists.
- Crime grade is F in this area — have there been break-ins, vandalism, or insurance claims at this property in the last 3 years? What carrier currently insures it and at what premium?
- What's the average days-on-market for RENTAL listings here right now (not sales)? A rising rental-DOM trend means longer vacancies and softer asking-rent achievability than the comps imply.
- What's the recent tenant-quality profile in this submarket — average credit score on applications, eviction rate, late-payment / NSF rate, and stable-employment percentage? A property-management company in the area should have these aggregated.
- How much new for-sale + rental construction is in the pipeline within 1–3 miles? Heavy new supply typically softens prices + rents 12–24 months out; constrained supply supports both.
Investment metrics
- 1% rule
- 0.80% ✗
- Cap rate
- 5.92%
- Cash-on-cash
- -1.34%
- DSCR
- 0.94
- GRM
- 10.4
CMA / ARV
- ARV (median comp)
- $286,207
- List price
- $270,000
- Delta
- -5.66%
- Verdict
- FAIR
- Comps
- 20 within 1.0 mi
Show comp detail 12 sales within ~0.75 mi
| Address | Dist | Beds/Ba | Sqft | Sold | Price | $/sf | Match |
|---|---|---|---|---|---|---|---|
| 7617 NW Milrey Dr | 0.00mi | 3/2.5 | 2,140 (0%) | 0mo | $270,000 | $126 | 98 |
| 7421 NW 76th Ter | 0.23mi | 4/2.5 (+1) | 2,240 (+5%) | 4mo | $330,000 | $147 | 71 |
| 7637 N Stoddard Ave | 0.11mi | 4/3.5 (+1) | 2,309 (+8%) | 2mo | $349,000 | $151 | 69 |
| 6920 NW 76th Pl | 0.05mi | 3/2.5 | 1,827 (-15%) | 4mo | $289,000 | $158 | 68 |
| 7924 NW Milrey Dr | 0.39mi | 3/2.5 | 2,010 (-6%) | 6mo | $265,000 | $132 | 65 |
| 8113 N Serene Ave | 0.61mi | 3/2.5 | 2,088 (-2%) | 2mo | $356,900 | $171 | 64 |
| 7340 N Rhode Ave | 0.54mi | 3/2.0 | 2,210 (+3%) | 8mo | $345,000 | $156 | 63 |
| 7407 NW 78th St | 0.37mi | 3/2.0 | 1,928 (-10%) | 6mo | $325,000 | $169 | 61 |
| 7518 76th Pl | 0.26mi | 3/2.5 | 1,852 (-14%) | 3mo | $302,000 | $163 | 61 |
| 7608 N Serene Ave | 0.24mi | 3/2.5 | 1,880 (-12%) | 10mo | $300,000 | $160 | 58 |
| 7312 NW 78th St | 0.31mi | 4/3.5 (+1) | 1,996 (-7%) | 9mo | $309,000 | $155 | 56 |
| 7801 NW Seymour Ct | 0.62mi | 3/3.0 | 2,250 (+5%) | 10mo | $380,000 | $169 | 50 |
Match score weights: distance 35% · size 25% · config 20% · recency 20%. Top-matched comps best support the ARV.
Projected returns pro-forma
10.0% appreciation · 7.03% rent growth · sell at horizon
- IRR
- 24.6%
- Equity multiple
- 3.00×
- Total profit
- $150,851
- Equity at exit
- $243,237
- IRR
- 22.8%
- Equity multiple
- 7.22×
- Total profit
- $470,292
- Equity at exit
- $524,551
Cash invested: $75,600 (down + closing). Projections, not guarantees.
Landlord ↔ Tenant lean methodology
- Overall (STATE)
- 81 Strongly Landlord-Friendly
- State Missouri
- 81 Strongly Landlord-Friendly · R+10
- County
- — inherits STATE
- City
- — inherits STATE
ZIP-level market 64152
- Home prices YoY
- 4.7%
- Rents YoY
- 7.0%
- Active inventory
- 264
- Price-to-rent
- 10.4×
Monthly cashflow live
- Estimated rent
- $2,173 high interval (Pro) →
- Mortgage (P&I)
- −$1,416
- Tax from tax record
- −$272 /mo · $3,264/yr
- Insurance
- −$112
- HOA
- −$0
- Vacancy / Maint / Mgmt
- −$456
- Net cashflow
- $-84
Break-even live
UW: 25.0% down · 7.5% · 30yr · 1.5% tax · 5.0% vac · 8.0% maint · 8.0% mgmt
Financing live
Cash to close
- Down payment
- $67,500
- Closing costs
- $8,100
- Reserves months
- —
- Total cash needed
- —
Loan-product check · same deal, 3 products live
Conventional
25% down · 7.5% · 30yr
- Down + closing
- —
- Monthly P&I
- —
- Monthly cashflow
- —
- DSCR
- —
- Eligible?
- —
Personal DTI + credit; lowest rate.
DSCR
20% down · 8.5% · 30yr
- Down + closing
- —
- Monthly P&I
- —
- Monthly cashflow
- —
- DSCR
- —
- Eligible?
- —
No personal income docs; deal must DSCR.
Hard money
10% down · 12.0% · 12mo
- Down + closing
- —
- Monthly P&I
- —
- Monthly cashflow
- —
- DSCR
- —
- Eligible?
- —
Short-term bridge; refi at stabilization.
Rent comps 9 comps
| Address | Beds | Baths | Sqft | Rent | $/sqft | DOM | Units | Dist |
|---|---|---|---|---|---|---|---|---|
| 7641 N Stoddard Ave Kansas City, MO | 3.0 | 2.0 | 1766 | $2,200 | $1.25 | 43d | 1 | 0.15mi |
| 6904 NW 78th St Kansas City, MO | 3.0 | 1.0 | 1450 | $1,799 | $1.24 | 21d | 1 | 0.28mi |
| 6905 NW 72nd Ter Kansas City, MO | 3.0 | 1.0 | 1465 | $2,000 | $1.37 | 3d | 1 | 0.49mi |
| 8199 NW Milrey Dr Kansas City, MO | 3.0 | 2.5 | 1458 | $2,070 | $1.42 | 17d | 8 | 0.64mi |
| 8310 NW 77th Ter Kansas City, MO | 4.0 | 2.5 | 1792 | $2,399 | $1.34 | 3d | 1 | 0.83mi |
| 8320 N Nodaway Ave Kansas City, MO | 3.0 | 2.5 | 1600 | $1,995 | $1.25 | 43d | 1 | 1.23mi |
| 6725 NW Hilldale Dr Kansas City, MO | 3.0 | 2.0 | 1629 | $2,300 | $1.41 | 17d | 1 | 1.24mi |
| 8418 NW 68th St Kansas City, MO | 3.0 | 1.5 | 1714 | $2,141 | $1.25 | 10d | 1 | 1.37mi |
| 8787 NW Prairie View Rd Kansas City, MO | 2.0 | 1.0–2.0 | 1046 | $2,331 | $2.23 | 1d | 8 | 1.38mi |
Listing history 7 events
-
2026-05-04status Pending 1250-char remark
-
2026-05-01$270,000 Active 1250-char remark
-
2026-04-27historical $270,000 1250-char remark
-
2023-03-08soldstatus
-
2023-03-07soldstatus Closed 648-char remark
Show marketing remark (648 chars)
This charming home in the Platte Ridge subdivision comes complete with new windows, and a big backyard with a deck and shed! Step inside to be greeted by a cozy masonry fireplace. Continue into the formal dining room located just off the kitchen, that also has access to the backyard. From the kitchen you can head straight upstairs and into the master bedroom, which has a half bath en suite. The final two bedrooms are also upstairs, and all bedrooms feature beautiful wood flooring. The basement has a large recreational room that includes a bar. The basement also has an unfinished area that houses the utilities and would be great for storage!
-
2022-12-18historical Active Under Contract 648-char remark
Show marketing remark (648 chars)
This charming home in the Platte Ridge subdivision comes complete with new windows, and a big backyard with a deck and shed! Step inside to be greeted by a cozy masonry fireplace. Continue into the formal dining room located just off the kitchen, that also has access to the backyard. From the kitchen you can head straight upstairs and into the master bedroom, which has a half bath en suite. The final two bedrooms are also upstairs, and all bedrooms feature beautiful wood flooring. The basement has a large recreational room that includes a bar. The basement also has an unfinished area that houses the utilities and would be great for storage!
-
2022-12-01$255,000 Active 648-char remark
Show marketing remark (648 chars)
This charming home in the Platte Ridge subdivision comes complete with new windows, and a big backyard with a deck and shed! Step inside to be greeted by a cozy masonry fireplace. Continue into the formal dining room located just off the kitchen, that also has access to the backyard. From the kitchen you can head straight upstairs and into the master bedroom, which has a half bath en suite. The final two bedrooms are also upstairs, and all bedrooms feature beautiful wood flooring. The basement has a large recreational room that includes a bar. The basement also has an unfinished area that houses the utilities and would be great for storage!
ⓘ Source: listings_history table (triggers on properties + properties_extension) + one-shot
backfill from property_details.listing_events for pre-trigger history.
Tax reassessment forecast MO · Resets to sale price
- Current annual tax
- $3,264 · $272/mo
- Projected year-2 tax
- $3,264 · $272/mo
- Expected delta
- $0/yr ($0/mo · 0.0%)
ⓘ Screening estimate from a state-policy table — verify with the county assessor before closing.
Climate risk First Street
- Flood 6/10 Major FEMA zone X (unshaded) · 73% chance over 30 yrs
- Wildfire 1/10 Low
- Heat 4/10 Moderate 7 d/yr ≥107°F today · 17 d/yr by 30 yrs out
- Wind 2/10 Low
- Air quality 2/10 Low 2 unhealthy d/yr today · 2 by 30 yrs out
Nearby sold comps map
Loading sold comps map…
Walkable amenities ~0.75 mi
Loading nearby amenities…
Taxation est. · year 1
- Rental income
- $26,070
- − Mortgage interest
- −$15,124
- − Property taxes
- −$3,264
- − Insurance
- −$1,350
- − Repairs & maintenance
- −$2,086
- − Management
- −$2,086
- − Depreciation
- −$7,855
- Taxable loss
- −$5,694
- Est. tax savings @ 24.0%
- +$1,366
- After-tax cash flow
- $357/yr
For passive investors: Depreciation is non-cash, so a rental often shows a tax loss while cash-flowing — sheltering income. Rental losses are passive: they offset passive income freely, and up to $25,000/yr can offset ordinary (W-2) income if you actively participate and your MAGI is under $100k (phasing out to $0 by $150k); unused losses carry forward. On sale, claimed depreciation is recaptured at up to 25%, and gains may owe capital-gains tax (a 1031 exchange can defer both). Figures are a year-1 estimate at your 24.0% rate — not tax advice; consult a CPA.
Schools (NCES district)
- District
- Park Hill
- NCES district ID
- 2923550
- Math proficiency
- 47% ▼ -3.00%
- Reading proficiency
- 54% ▼ -3.00%
- Median HH income
- $67,616
- Composite
- 44.86/100
- National rank
- #2723
- State rank
- #26 of 324 in MO
Livability — Kansas City
- Score
- 78/100
- State rank
- #28
- US rank
- #2671
Category grades
Schools grade is shown separately in the Schools card above.
Census & demographics
- Census place
- Kansas City, MO
- County
- Platte County · 100,198 people
- City population
- 439,467
- Metro
- Kansas City, MO-KS
- Population (ZIP)
- 31,545
- Household income
- $114,688
- Rent vs Own
- Severe rent burden
- 234.0
Population outlook (Platte County) Hauer SSP2
- Today (2025)
- 111,772 people
- By 2030
- 119,173 · +6.6%
- By 2040
- 133,326 · +19.3%
- By 2050
- 146,617 · +31.2%
- By 2075
- 178,626 · +59.8%
- By 2100
- 195,638 · +75.0%
Race, ethnicity, and origin ACS 2023
- Neighborhood character
- Predominantly White (82%)
- Race & ethnicity
- White 82% Hispanic / Latino 7% Two or more races 6% Black 3% Asian 2%
- Hispanic origin (detail)
- Mexican 5% Puerto Rican 1%
- Common ancestry
- Romanian 4% Italian 4% Slovak 4%
- Foreign-born
- 4% · Canada, China
- Languages at home
- 93% English-only · Spanish 3% Other Indo-European 1% German/W. Germanic 1%
Political lean MEDSL · Platte
- 2024 margin
- Toss-up / Even · D 47.7% · R 50.8% · Other 1.4%
- 2008→2024 swing
- +3.2pp toward D · 2008: -6.4pp · 2024: -3.1pp
- All cycles
- 2024: R+3.1 2020: R+3.0 2016: R+13.0 2012: R+14.2 2008: R+6.4
Not yet ingested
- Civics
- —
Market trends
- HPI YoY
- ▲ 33.10%
- Current HPI
- 739.89
- Rent YoY
- ▲ 7.03%
- Metro
- Kansas City, MO-KS
- State GDP YoY
- ▲ 1.84%
- F500 in state
- 20
Industry mix (Fortune 500 HQ in MO)
| Industry | F500 HQs | Revenue |
|---|---|---|
| Healthcare | 1 | $163B |
|
||
| Insurance | 1 | $21B |
|
||
| Industrial Technology | 1 | $17B |
|
||
| Retail | 1 | $16B |
|
||
| Industrial Distribution | 1 | $10B |
|
||
| Utilities | 1 | $9B |
|
||
Price history
+5.9% since first listed8 events — show timeline
- 2026-06-11 Sold (MLS) — Heartland MLS as Distributed by MLS Grid
- 2026-05-04 Pending — Heartland MLS as Distributed by MLS Grid
- 2026-05-01 Listed $270,000 Heartland MLS as Distributed by MLS Grid
- 2026-04-27 Coming Soon $270,000 Heartland MLS as Distributed by MLS Grid
- 2023-03-08 Sold (Public Records) — Public Records
- 2023-03-07 Sold (MLS) — Heartland MLS as Distributed by MLS Grid
- 2022-12-18 Contingent — Heartland MLS as Distributed by MLS Grid
- 2022-12-01 Listed $255,000 Heartland MLS as Distributed by MLS Grid
Property tax history
+6.3%/yrLatest (2025): $3,264 · +11.6% YoY. Source: county tax records.
Cash-flow waterfall
monthlySold comps — $/sqft
last 12 mo · ≤1 miLoading sold comps…