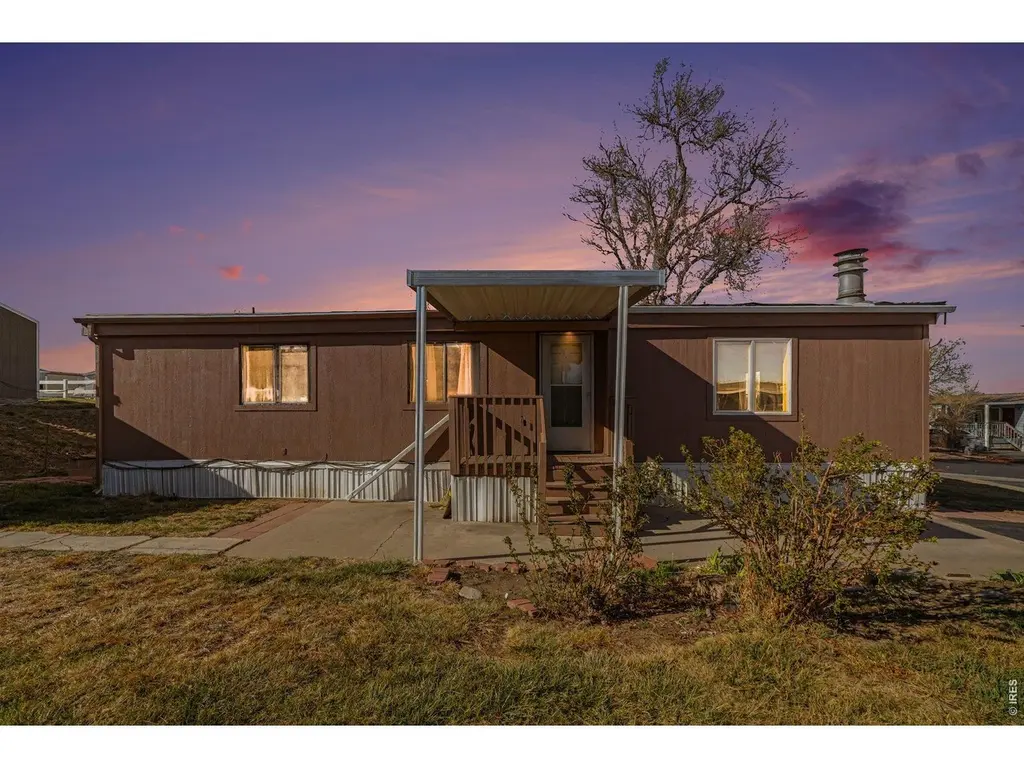
9100 Tejon St #150 · Federal Heights, CO
Flood risk 1/10 · Minimal
- FEMA flood zone
- X (unshaded)
- Chance of flooding over 30 yrs
- 0.0%
- Est. flood insurance / yr
- $507 – $1,088
Fire risk 1/10 · Minimal
- Est. fire insurance / yr
- $939 – $1,743
Heat risk 3/10 · Minor
- Hot days now (above 93°F)
- 7 days/yr
- Hot days in 30 yrs
- 19 days/yr
Wind risk 2/10 · Minimal
- Chance of severe wind over 30 yrs
- —
Air-quality risk 4/10 · Minor
- Unhealthy air days now
- 6 days/yr
- Unhealthy air days in 30 yrs
- 8 days/yr
Risk factors via First Street. Map © Google.
Why this score? — see what drove the B+ grade
The composite is a weighted blend of 9 inputs, each scored 0–100. Each bar is that input's sub-score; the figure is the points it added to the 100-point composite (weight × sub-score).
- Cash flow +30.0/30.0
- ARV discount +15.0/15.0
- 1% rule +10.0/10.0
- DSCR +10.0/10.0
- Livability +3.8/5.0
- Schools +3.5/10.0
- Rent growth +2.7/5.0
- Condition / age +2.5/5.0
- Appreciation +0.0/10.0
$72,500
🖨 Deal sheet 📄 Offer letter ✓ Due diligence
Listing remarks
Located in Lamplighter Village - an all ages park. Roll up your sleeves and step into potential. This 4-bedroom, 2-bath double wide offers 1,344 sq ft. Multiple bedrooms and a functional layout, there's room for everyone to live comfortably under one roof. Priced at just $72,500, this home offers a unique opportunity to own for far less than similar homes in the park, which are listed at $125,000+. With some updates over time, you can create a home that fits your needs while building equity for the future. Outside, enjoy paved parking for up to 4 vehicles-ideal for households with multiple drivers. Monthly lot rent is $1,200 and includes water and garbage, helping keep expenses simple and m
Key facts
- Functional layout
- Built 1982
- Listed 36 days
Tags
Neighborhood map
What this means for you Summary
Snapshot
- This is a 4-bed/2.0-bath manufactured listed at $72k.
Deal economics
- At list price, monthly cash flow is $1k ($16k/yr) — positive.
- The deal already cash-flows at list — no discount required.
- Meets the 1% rule at list price ($2k rent vs $72k).
- Recommended offer: $70k (3.0% below list) — sets the bar for market timing.
- Cap rate 27.9% vs local median 4.2% in Federal Heights — top-decile yield for the area; either an underpriced asset or a hidden risk that comps aren't pricing in. Stress-test before assuming the spread holds.
Location & tenants
- Location reads 76/100 on livability (#28 in CO, #3,380 nationally) — a middle-class / working-renter tenant base. Strengths: commute A+, cost of living A+, housing A+; Watch: health & safety D+, schools F, crime F.
- Adams 12 Five Star Schools (suburban): math 31% / reading 46% proficiency, ranked #26 of 86 in CO (top 30%) — families likely to look elsewhere, expect single-tenant / working-renter base with shorter leases.
- Market conditions: Rents flat; 138 active listings in the ZIP; 19 comparable units currently listed for rent nearby; rentals at typical pace (median 24d on market — plan ~3-4 weeks tenant-placement turnaround); 2,299 units permitted in Adams County in 2024 (343 in 5+ unit buildings).
- This rent runs 43% of the median local income ($62k/yr) — at the standard rent-burdened threshold; future hikes will face affordability resistance.
Forward outlook
- Local home prices are declining (-3.0%/yr); year-one equity from $501 of loan paydown is wiped out by about $2k of value loss. Plan a longer hold.
- Adams County population projected at +44% by 2050 — long-run rental-demand tailwind backs the buy-and-hold thesis.
- At projected returns (-3.0% appreciation + 0.8% rent growth), your $20k cash investment doubles in ~2 years — after that, you're playing with house money.
Negotiation context
- It's been on market 36 days — a 3% lower offer ($70k) is reasonable based on typical stale-listing flexibility.
Questions for the listing agent
- It's been on market 36 days. Have you received any prior offers? Is the seller open to a 3% concession, seller financing, or rate buy-down credit?
- Is there a deadline driving the sale (1031 exchange, divorce, estate, relocation)? That informs how much negotiation room exists.
- Schools are F-rated, which usually means shorter tenancies and higher turnover. Who's the typical renter profile here, and what's been the actual vacancy rate?
- Crime grade is F in this area — have there been break-ins, vandalism, or insurance claims at this property in the last 3 years? What carrier currently insures it and at what premium?
- What's the average days-on-market for RENTAL listings here right now (not sales)? A rising rental-DOM trend means longer vacancies and softer asking-rent achievability than the comps imply.
- What's the recent tenant-quality profile in this submarket — average credit score on applications, eviction rate, late-payment / NSF rate, and stable-employment percentage? A property-management company in the area should have these aggregated.
- How much new for-sale + rental construction is in the pipeline within 1–3 miles? Heavy new supply typically softens prices + rents 12–24 months out; constrained supply supports both.
Investment metrics
- 1% rule
- 3.02% ✓
- Cap rate
- 27.88%
- Cash-on-cash
- 77.09%
- DSCR
- 4.43
- GRM
- 2.8
CMA / ARV
- ARV (on-the-fly)
- $89,856
- Comps found
- 12
Show comp detail 12 sales within ~0.75 mi
| Address | Dist | Beds/Ba | Sqft | Sold | Price | $/sf | Match |
|---|---|---|---|---|---|---|---|
| 1801 W 92nd Ave | 0.38mi | 3/2.0 (-1) | 1,152 (0%) | 5mo | $132,000 | $115 | 73 |
| 9595 Pecos St #203 | 0.59mi | 4/2.0 | 1,216 (+6%) | 1mo | $107,500 | $88 | 62 |
| 2551 W 92nd Ave | 0.51mi | 3/2.0 (-1) | 1,120 (-3%) | 6mo | $55,000 | $49 | 62 |
| 2551 W 92nd | 0.51mi | 5/2.0 (+1) | 1,188 (+3%) | 7mo | $100,000 | $84 | 60 |
| 1801 W 92nd Ave | 0.38mi | 3/2.0 (-1) | 1,248 (+8%) | 6mo | $76,000 | $61 | 59 |
| 2551 W 92nd Ave #3 | 0.51mi | 4/2.0 | 1,216 (+6%) | 10mo | $83,900 | $69 | 58 |
| 1801 W 92nd Ave | 0.38mi | 3/2.0 (-1) | 1,056 (-8%) | 8mo | $54,000 | $51 | 57 |
| 2551 W 92nd Ave | 0.51mi | 3/2.0 (-1) | 1,216 (+6%) | 7mo | $89,000 | $73 | 56 |
| 9595 Pecos Lot 360 St | 0.59mi | 3/2.0 (-1) | 1,152 (0%) | 14mo | $90,000 | $78 | 55 |
| 2551 W 92 Ave | 0.51mi | 3/2.0 (-1) | 1,232 (+7%) | 8mo | $115,000 | $93 | 53 |
| 1801 W 92nd Ave #222 | 0.38mi | 3/— (-1) | 1,036 (-10%) | 10mo | $63,000 | $61 | 52 |
| 2551 W 92nd Ave | 0.51mi | 3/2.0 (-1) | 1,024 (-11%) | 12mo | $104,200 | $102 | 43 |
Match score weights: distance 35% · size 25% · config 20% · recency 20%. Top-matched comps best support the ARV.
Projected returns pro-forma
-3.0% appreciation · 0.77% rent growth · sell at horizon
- IRR
- 74.6%
- Equity multiple
- 4.28×
- Total profit
- $66,488
- Equity at exit
- $10,810
- IRR
- 77.8%
- Equity multiple
- 8.19×
- Total profit
- $145,917
- Equity at exit
- $6,268
Cash invested: $20,300 (down + closing). Projections, not guarantees.
Landlord ↔ Tenant lean methodology
- Overall (STATE)
- 38 Tenant-Leaning
- State Colorado
- 38 Tenant-Leaning · D+4
- County
- — inherits STATE
- City
- — inherits STATE
ZIP-level market 80260
- Rents YoY
- 0.8%
- Active inventory
- 138
- Price-to-rent
- 2.8×
Monthly cashflow live
- Estimated rent
- $2,192 high interval (Pro) →
- Mortgage (P&I)
- −$380
- Tax from tax record
- −$17 /mo · $210/yr
- Insurance
- −$30
- HOA
- −$0
- Vacancy / Maint / Mgmt
- −$460
- Net cashflow
- $1,304
Break-even live
UW: 25.0% down · 7.5% · 30yr · 1.5% tax · 5.0% vac · 8.0% maint · 8.0% mgmt
Financing live
Cash to close
- Down payment
- $18,125
- Closing costs
- $2,175
- Reserves months
- —
- Total cash needed
- —
Loan-product check · same deal, 3 products live
Conventional
25% down · 7.5% · 30yr
- Down + closing
- —
- Monthly P&I
- —
- Monthly cashflow
- —
- DSCR
- —
- Eligible?
- —
Personal DTI + credit; lowest rate.
DSCR
20% down · 8.5% · 30yr
- Down + closing
- —
- Monthly P&I
- —
- Monthly cashflow
- —
- DSCR
- —
- Eligible?
- —
No personal income docs; deal must DSCR.
Hard money
10% down · 12.0% · 12mo
- Down + closing
- —
- Monthly P&I
- —
- Monthly cashflow
- —
- DSCR
- —
- Eligible?
- —
Short-term bridge; refi at stabilization.
Rent comps 19 comps
| Address | Beds | Baths | Sqft | Rent | $/sqft | DOM | Units | Dist |
|---|---|---|---|---|---|---|---|---|
| 1801 W 92nd Ave #754 Denver, CO | 3.0 | 2.0 | 1123 | $1,995 | $1.78 | 5d | 1 | 0.39mi |
| 9189 Gale Blvd Thornton, CO | 1.0–3.0 | 1.0–2.0 | 755 | $1,699 | $2.25 | 24d | 1 | 0.49mi |
| 9400 Elm Ct #645 Denver, CO | 3.0 | 2.0 | 1184 | $2,203 | $1.86 | 24d | 1 | 0.74mi |
| 8670 Clay St Unit 6301 Westminster, CO | 3.0 | 2.0 | 1110 | $2,325 | $2.09 | 24d | 1 | 0.77mi |
| 8670 Clay St Unit 5201 Westminster, CO | 3.0 | 2.0 | 1110 | $2,550 | $2.30 | 24d | 1 | 0.77mi |
| 8670 Clay St Unit 4211 Westminster, CO | 3.0 | 2.0 | 1110 | $2,186 | $1.97 | 24d | 1 | 0.77mi |
| 8972 Fox Dr Unit 102 Thornton, CO | 3.0 | 2.0 | 1472 | $2,295 | $1.56 | 5d | 1 | 0.77mi |
| 1654 Aspen Meadows Cir Unit Labs Denver, CO | 3.0 | 2.5 | 1355 | $2,400 | $1.77 | 24d | 1 | 0.77mi |
| 8670 Clay St Unit 7219 Westminster, CO | 3.0 | 2.0 | 1110 | $2,373 | $2.14 | 24d | 1 | 0.77mi |
| 9783 Croke Dr Denver, CO | 3.0 | 1.5 | 1240 | $1,999 | $1.61 | 5d | 1 | 1.03mi |
| 747 W 96th Ave Denver, CO | 3.0 | 1.0 | 864 | $1,395 | $1.61 | 5d | 1 | 1.04mi |
| 747 W 96th Ave Denver, CO | 3.0 | 1.0 | 864 | $1,395 | $1.61 | 24d | 1 | 1.04mi |
| 707 W 96th Ave Thornton, CO | 3.0 | 1.0 | 859 | $1,350 | $1.57 | 24d | 1 | 1.06mi |
| 9710 Huron St Unit B Northglenn, CO | 3.0 | 2.0 | 1292 | $2,080 | $1.61 | 18d | 1 | 1.11mi |
| 1921 W 101st Ave Unit 1921 Thornton, CO | 3.0 | 2.5 | 1335 | $2,800 | $2.10 | 14d | 1 | 1.30mi |
| 3323 W 96th Cir Westminster, CO | 1.0–3.0 | 1.0–3.0 | 1190 | $3,339 | $2.81 | 1d | 21 | 1.34mi |
| 10154 Wyandott Cir N Thornton, CO | 3.0 | 2.5 | 1464 | $2,465 | $1.68 | 16d | 1 | 1.38mi |
| 9130 Osceola St Westminster, CO | 3.0 | 2.0 | 1204 | $2,350 | $1.95 | 11d | 1 | 1.46mi |
| 9132 Osceola St Westminster, CO | 3.0 | 2.0 | 1204 | $2,350 | $1.95 | 24d | 1 | 1.46mi |
Listing history 4 events
-
2026-04-24status Pending
-
2026-04-22price $72,500
-
2026-03-19price $69,995
-
2026-03-18$69,900 Active
ⓘ Source: listings_history table (triggers on properties + properties_extension) + one-shot
backfill from property_details.listing_events for pre-trigger history.
Tax reassessment forecast CO · Resets to sale price
- Current annual tax
- $210 · $17/mo
- Projected year-2 tax
- $399 · $33/mo
- Expected delta
- +$189/yr (+$16/mo · 90.1%)
ⓘ Screening estimate from a state-policy table — verify with the county assessor before closing.
Climate risk First Street
- Flood 1/10 Low FEMA zone X (unshaded) · 0% chance over 30 yrs
- Wildfire 1/10 Low
- Heat 3/10 Moderate 7 d/yr ≥93°F today · 19 d/yr by 30 yrs out
- Wind 2/10 Low
- Air quality 4/10 Moderate 6 unhealthy d/yr today · 8 by 30 yrs out
Nearby sold comps map
Loading sold comps map…
Walkable amenities ~0.75 mi
Loading nearby amenities…
Taxation est. · year 1
- Rental income
- $26,309
- − Mortgage interest
- −$4,061
- − Property taxes
- −$210
- − Insurance
- −$362
- − Repairs & maintenance
- −$2,105
- − Management
- −$2,105
- − Depreciation
- −$2,109
- Taxable income
- $15,357
- Est. tax owed @ 24.0%
- −$3,686
- After-tax cash flow
- $11,964/yr
For passive investors: Depreciation is non-cash, so a rental often shows a tax loss while cash-flowing — sheltering income. Rental losses are passive: they offset passive income freely, and up to $25,000/yr can offset ordinary (W-2) income if you actively participate and your MAGI is under $100k (phasing out to $0 by $150k); unused losses carry forward. On sale, claimed depreciation is recaptured at up to 25%, and gains may owe capital-gains tax (a 1031 exchange can defer both). Figures are a year-1 estimate at your 24.0% rate — not tax advice; consult a CPA.
Schools (NCES district)
- District
- Adams 12 Five Star Schools
- NCES district ID
- 0806900
- Math proficiency
- 31% ▼ -4.00%
- Reading proficiency
- 46% ▬ 0.00%
- Median HH income
- $67,478
- Composite
- 34.87/100
- National rank
- #5086
- State rank
- #26 of 86 in CO
Livability — Federal Heights
- Score
- 76/100
- State rank
- #28
- US rank
- #3380
Category grades
Schools grade is shown separately in the Schools card above.
Census & demographics
- Census place
- Federal Heights, CO
- County
- Adams County · 464,133 people
- City population
- 34,677
- Metro
- Denver-Aurora-Lakewood, CO
- Population (ZIP)
- 34,677
- Household income
- $61,852
- Rent vs Own
- Severe rent burden
- 1521.0
Population outlook (Adams County) Hauer SSP2
- Today (2025)
- 598,184 people
- By 2030
- 651,880 · +9.0%
- By 2040
- 759,778 · +27.0%
- By 2050
- 862,889 · +44.3%
- By 2075
- 1,085,994 · +81.5%
- By 2100
- 1,211,318 · +102.5%
Race, ethnicity, and origin ACS 2023
- Neighborhood character
- Majority Hispanic (61%)
- Race & ethnicity
- Hispanic / Latino 61% White 30% Two or more races 26% Asian 3% Black 3%
- Hispanic origin (detail)
- Mexican 51%
- Common ancestry
- Romanian 1% Slovak 1% Italian 1%
- Foreign-born
- 25% · Canada, Vietnam, China
- Languages at home
- 53% English-only · Spanish 42% Other Asian/Pacific 2% Other Indo-European 1%
Political lean MEDSL · Adams
- 2024 margin
- Lean D (+9.0) · D 53.2% · R 44.1% · Other 2.7%
- 2008→2024 swing
- -9.3pp toward R · 2008: 18.4pp · 2024: 9.0pp
- All cycles
- 2024: D+9.0 2020: D+16.3 2016: D+7.2 2012: D+15.1 2008: D+18.4
Not yet ingested
- Civics
- —
Market trends
- HPI YoY
- ▼ -260.84%
- Current HPI
- 285.4552
- Rent YoY
- ▲ 0.77%
- Metro
- Denver-Aurora-Lakewood, CO
- State GDP YoY
- ▲ 1.95%
- F500 in state
- 14
Industry mix (Fortune 500 HQ in CO)
| Industry | F500 HQs | Revenue |
|---|---|---|
| Technology Distribution | 1 | $31B |
|
||
| Food / Agriculture | 1 | $18B |
|
||
| Packaging | 1 | $14B |
|
||
| Healthcare | 1 | $13B |
|
||
| Energy | 1 | $10B |
|
||
| Technology | 1 | $4B |
|
||
Price history
+3.7% since first listed4 events — show timeline
- 2026-04-24 Pending — IRES
- 2026-04-22 Price Changed $72,500 IRES
- 2026-03-19 Price Changed $69,995 IRES
- 2026-03-18 Listed $69,900 IRES
Property tax history
+2.6%/yrLatest (2025): $210 · -4.6% YoY. Source: county tax records.
Cash-flow waterfall
monthlySold comps — $/sqft
last 12 mo · ≤1 miLoading sold comps…