 🏗️ New Construction
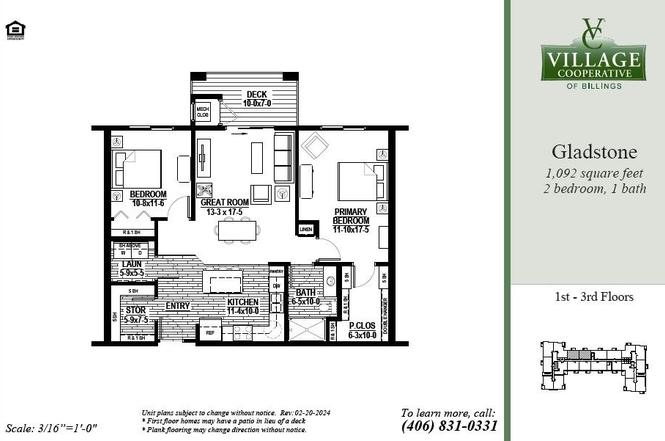
Gladstone Plan · Billings, MT
Flood risk No data
- FEMA flood zone
- —
- Chance of flooding over 30 yrs
- —
- Est. flood insurance / yr
- —
Fire risk No data
- Est. fire insurance / yr
- —
Heat risk No data
- Hot days now (above threshold)
- —
- Hot days in 30 yrs
- —
Wind risk No data
- Chance of severe wind over 30 yrs
- —
Air-quality risk No data
- Unhealthy air days now
- —
- Unhealthy air days in 30 yrs
- —
Risk factors via First Street. Map © Google.
Why this score? — see what drove the F grade
The composite is a weighted blend of 9 inputs, each scored 0–100. Each bar is that input's sub-score; the figure is the points it added to the 100-point composite (weight × sub-score).
- ARV discount +7.5/15.0
- Cash flow +6.6/30.0
- Livability +4.0/5.0
- Rent growth +3.8/5.0
- Schools +3.2/10.0
- Condition / age +2.5/5.0
- 1% rule +1.6/10.0
- DSCR +0.8/10.0
- Appreciation +0.0/10.0
$168,000
🖨 Deal sheet 📄 Offer letter ✓ Due diligence
Key facts
- Parking
- Listed 801 days
Property features AI
Finance
- Financial info: List price $168,000
Exterior
- Home design: Gladstone plan; New construction (plan)
- Exterior features: Living area approximately 1,092
Interior
- Bedrooms: 2 bedrooms
- Bathrooms: 1 full bathroom
- Interior features: Active listing; Virtual tour available
Neighborhood map
What this means for you Summary
Snapshot
- This is a 2-bed/1.0-bath townhouse listed at $168k.
Deal economics
- At list price, monthly cash flow is $-447 ($-5k/yr) — negative.
- The deal already cash-flows at list — no discount required.
- Meets the 1% rule at list price ($2k rent vs $168k).
- Recommended offer: $148k (12.0% below list) — sets the bar for market timing.
- Cap rate 4.3% vs local median 3.0% in Billings — top-decile yield for the area; either an underpriced asset or a hidden risk that comps aren't pricing in. Stress-test before assuming the spread holds.
Location & tenants
- Location reads 80/100 on livability (#10 in MT, #1,830 nationally) — a professional / high-income tenant draw. Strengths: amenities A+, commute A+, housing A+; Watch: schools D+, crime F.
- Billings H S (urban): math 29% / reading 45% proficiency, ranked #69 of 116 in MT (top 60%) — families likely to look elsewhere, expect single-tenant / working-renter base with shorter leases.
- Market conditions: Rents rising fast (+5.0%/yr); 197 active listings in the ZIP; 7 comparable units currently listed for rent nearby; rentals leasing fast (median 13d on market — plan ~1-2 weeks tenant-placement turnaround); solid renter incomes; 1,401 units permitted in Yellowstone County in 2024 (281 in 5+ unit buildings).
Forward outlook
- Local home prices are declining (-3.0%/yr); year-one equity from $2k of loan paydown is wiped out by about $8k of value loss. Plan a longer hold.
- Yellowstone County population projected at +26% by 2050 — long-run rental-demand tailwind backs the buy-and-hold thesis.
Negotiation context
- It's been on market 802 days — a 12% lower offer ($148k) is reasonable based on typical stale-listing flexibility.
Questions for the listing agent
- What do current leases actually rent for vs. the listed asking? Can we see a recent rent roll and the last 12 months of T-12 income?
- It's been on market 802 days. Have you received any prior offers? Is the seller open to a 12% concession, seller financing, or rate buy-down credit?
- Why hasn't it sold? Are there any deal-killer items the seller is aware of (foundation, flood, title, zoning, code violations)?
- Is there a deadline driving the sale (1031 exchange, divorce, estate, relocation)? That informs how much negotiation room exists.
- Schools are D-rated, which usually means shorter tenancies and higher turnover. Who's the typical renter profile here, and what's been the actual vacancy rate?
- Crime grade is F in this area — have there been break-ins, vandalism, or insurance claims at this property in the last 3 years? What carrier currently insures it and at what premium?
- The area grade is low — what's the realistic commute time and amenity access for the typical tenant pool here? Any planned neighborhood developments (good or bad) we should know about?
- What's the average days-on-market for RENTAL listings here right now (not sales)? A rising rental-DOM trend means longer vacancies and softer asking-rent achievability than the comps imply.
- What's the recent tenant-quality profile in this submarket — average credit score on applications, eviction rate, late-payment / NSF rate, and stable-employment percentage? A property-management company in the area should have these aggregated.
- How much new for-sale + rental construction is in the pipeline within 1–3 miles? Heavy new supply typically softens prices + rents 12–24 months out; constrained supply supports both.
Investment metrics
- 1% rule
- 0.66% ✗
- Cap rate
- 4.30%
- Cash-on-cash
- -7.11%
- DSCR
- 0.68
- GRM
- 12.5
CMA / ARV
- ARV (on-the-fly)
- $269,724
- Comps found
- 1
Show comp detail 1 sale within ~0.75 mi
| Address | Dist | Beds/Ba | Sqft | Sold | Price | $/sf | Match |
|---|---|---|---|---|---|---|---|
| 3819 Avenue D | 0.55mi | 2/1.5 | 1,212 (+11%) | 14mo | $299,000 | $247 | 42 |
Match score weights: distance 35% · size 25% · config 20% · recency 20%. Top-matched comps best support the ARV.
Projected returns pro-forma
-3.0% appreciation · 5.03% rent growth · sell at horizon
- IRR
- -26.4%
- Equity multiple
- 0.09×
- Total profit
- $-68,427
- Equity at exit
- $40,217
- IRR
- -18.0%
- Equity multiple
- -0.06×
- Total profit
- $-80,168
- Equity at exit
- $23,321
Cash invested: $75,523 (down + closing). Projections, not guarantees.
Landlord ↔ Tenant lean methodology
- Overall (STATE)
- 82 Strongly Landlord-Friendly
- State Montana
- 82 Strongly Landlord-Friendly · R+11
- County
- — inherits STATE
- City
- — inherits STATE
ZIP-level market 59102
- Rents YoY
- 5.0%
- Active inventory
- 197
- Price-to-rent
- 7.8×
Monthly cashflow live
- Estimated rent
- $1,793 high interval (Pro) →
- Mortgage (P&I)
- −$1,414
- Tax est. 1.5%
- −$337 /mo · $4,046/yr
- Insurance
- −$112
- HOA
- −$0
- Vacancy / Maint / Mgmt
- −$377
- Net cashflow
- $-447
Break-even live
UW: 25.0% down · 7.5% · 30yr · 1.5% tax · 5.0% vac · 8.0% maint · 8.0% mgmt
Financing live
Cash to close
- Down payment
- $67,431
- Closing costs
- $8,092
- Reserves months
- —
- Total cash needed
- —
Loan-product check · same deal, 3 products live
Conventional
25% down · 7.5% · 30yr
- Down + closing
- —
- Monthly P&I
- —
- Monthly cashflow
- —
- DSCR
- —
- Eligible?
- —
Personal DTI + credit; lowest rate.
DSCR
20% down · 8.5% · 30yr
- Down + closing
- —
- Monthly P&I
- —
- Monthly cashflow
- —
- DSCR
- —
- Eligible?
- —
No personal income docs; deal must DSCR.
Hard money
10% down · 12.0% · 12mo
- Down + closing
- —
- Monthly P&I
- —
- Monthly cashflow
- —
- DSCR
- —
- Eligible?
- —
Short-term bridge; refi at stabilization.
Rent comps 7 comps
| Address | Beds | Baths | Sqft | Rent | $/sqft | DOM | Units | Dist |
|---|---|---|---|---|---|---|---|---|
| 1965 Home Valley Dr Billings, MT | 1.0–2.0 | 1.0–2.0 | 1093 | $2,194 | $2.01 | 13d | 6 | 0.22mi |
| 3635 Harvest Time Ln Billings, MT | 2.0–3.0 | 2.5–3.0 | 1501 | $2,799 | $1.86 | 13d | 10 | 0.29mi |
| 2323 32nd St W Billings, MT | 2.0 | 1.0 | 745 | $1,314 | $1.76 | 13d | 4 | 0.31mi |
| 3011 Boulder Ave Billings, MT | 3.0 | 2.0 | 900 | $1,550 | $1.72 | 13d | 1 | 0.48mi |
| 1550 Country Manor Blvd Billings, MT | 1.0–3.0 | 1.0–2.0 | 1086 | $1,578 | $1.45 | 13d | 10 | 0.77mi |
| 1141 28th St W Billings, MT | 2.0 | 1.0 | 838 | $1,045 | $1.25 | 13d | 1 | 0.96mi |
| 2325 Avenue C Billings, MT | 2.0 | 1.0 | 768 | $1,655 | $2.15 | 13d | 2 | 1.33mi |
Listing history 16 events
-
2026-06-19days on market $168,000 Active 802 DOM
-
2026-06-18days on market $168,000 Active 801 DOM
-
2026-06-17days on market $168,000 Active 800 DOM
-
2026-06-16days on market $168,000 Active 799 DOM
-
2026-06-15days on market $168,000 Active 798 DOM
-
2026-06-14days on market $168,000 Active 796 DOM
-
2026-06-13days on market $168,000 Active 795 DOM
-
2026-06-10days on market $168,000 Active 793 DOM
-
2026-06-09days on market $168,000 Active 792 DOM
-
2026-06-08days on market $168,000 Active 791 DOM
-
2026-06-07days on market $168,000 Active 790 DOM
-
2026-06-05days on market $168,000 Active 787 DOM
-
2026-06-02days on market $168,000 Active 785 DOM
-
2026-06-01days on market $168,000 Active 784 DOM
-
2026-05-31days on market $168,000 Active 783 DOM
-
2026-05-30days on market $168,000 Active 782 DOM
ⓘ Source: listings_history table (triggers on properties + properties_extension) + one-shot
backfill from property_details.listing_events for pre-trigger history.
Nearby sold comps map
Loading sold comps map…
Walkable amenities ~0.75 mi
Loading nearby amenities…
Taxation est. · year 1
- Rental income
- $21,521
- − Mortgage interest
- −$15,109
- − Property taxes
- −$4,046
- − Insurance
- −$1,349
- − Repairs & maintenance
- −$1,722
- − Management
- −$1,722
- − Depreciation
- −$7,847
- Taxable loss
- −$10,272
- Est. tax savings @ 24.0%
- +$2,465
- After-tax cash flow
- $-2,901/yr
For passive investors: Depreciation is non-cash, so a rental often shows a tax loss while cash-flowing — sheltering income. Rental losses are passive: they offset passive income freely, and up to $25,000/yr can offset ordinary (W-2) income if you actively participate and your MAGI is under $100k (phasing out to $0 by $150k); unused losses carry forward. On sale, claimed depreciation is recaptured at up to 25%, and gains may owe capital-gains tax (a 1031 exchange can defer both). Figures are a year-1 estimate at your 24.0% rate — not tax advice; consult a CPA.
Schools (NCES district)
- District
- Billings H S
- NCES district ID
- 3003900
- Math proficiency
- 29% ▼ -4.00%
- Reading proficiency
- 45% ▲ 2.00%
- Median HH income
- $49,863
- Composite
- 31.93/100
- National rank
- #5848
- State rank
- #69 of 116 in MT
Livability — Billings
- Score
- 80/100
- State rank
- #10
- US rank
- #1830
Category grades
Schools grade is shown separately in the Schools card above.
Census & demographics
- Census place
- Billings, MT
- County
- Yellowstone County · 159,426 people
- City population
- 147,124
- Metro
- Billings, MT
- Population (ZIP)
- 47,977
- Household income
- $76,141
- Rent vs Own
- Severe rent burden
- 1584.0
Population outlook (Yellowstone County) Hauer SSP2
- Today (2025)
- 176,227 people
- By 2030
- 185,619 · +5.3%
- By 2040
- 203,543 · +15.5%
- By 2050
- 221,100 · +25.5%
- By 2075
- 266,931 · +51.5%
- By 2100
- 301,141 · +70.9%
Race, ethnicity, and origin ACS 2023
- Neighborhood character
- Predominantly White (88%)
- Race & ethnicity
- White 88% Hispanic / Latino 6% Two or more races 5% Native American 2% Asian 1%
- Hispanic origin (detail)
- Mexican 4%
- Common ancestry
- Portuguese 10% Slovak 3% Lithuanian 3%
- Foreign-born
- 2% · Canada, Vietnam
- Languages at home
- 96% English-only · Spanish 2% Vietnamese 1%
Political lean MEDSL · Yellowstone
- 2024 margin
- Strong R (+27.1) · D 34.9% · R 62.0% · Other 3.1%
- 2008→2024 swing
- -20.8pp toward R · 2008: -6.3pp · 2024: -27.1pp
- All cycles
- 2024: R+27.1 2020: R+24.0 2016: R+27.1 2012: R+20.6 2008: R+6.3
Not yet ingested
- Civics
- —
Market trends
- HPI YoY
- ▼ -364.20%
- Current HPI
- 205.0915
- Rent YoY
- ▲ 5.03%
- Metro
- Billings, MT
- State GDP YoY
- ▲ 3.41%
- F500 in state
- 2
Industry mix (Fortune 500 HQ in MT)
| Industry | F500 HQs | Revenue |
|---|---|---|
| Technology / Analytics | 1 | $2B |
|
||
Cash-flow waterfall
monthlySold comps — $/sqft
last 12 mo · ≤1 miLoading sold comps…