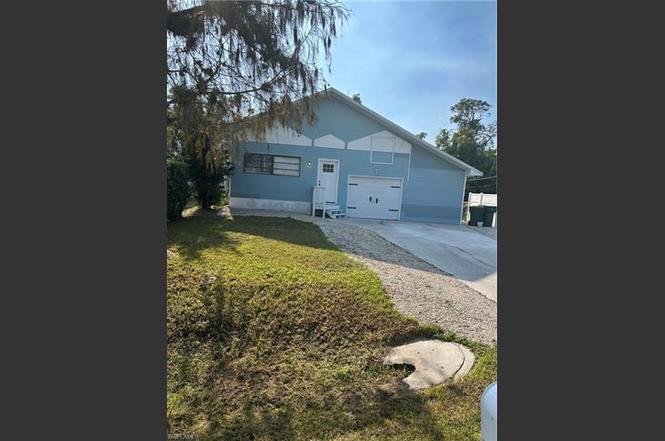
281 Benson St E · Lely Resort, FL
Flood risk 9/10 · Severe
- FEMA flood zone
- AE
- Chance of flooding over 30 yrs
- 0.99%
- Est. flood insurance / yr
- $1,737 – $8,500
Fire risk 3/10 · Minor
- Est. fire insurance / yr
- $947 – $1,759
Heat risk 10/10 · Severe
- Hot days now (above 108°F)
- 7 days/yr
- Hot days in 30 yrs
- 28 days/yr
Wind risk 10/10 · Severe
- Chance of severe wind over 30 yrs
- 99.0%
Air-quality risk 2/10 · Minimal
- Unhealthy air days now
- 2 days/yr
- Unhealthy air days in 30 yrs
- 2 days/yr
Risk factors via First Street. Map © Google.
Why this score? — see what drove the B grade
The composite is a weighted blend of 9 inputs, each scored 0–100. Each bar is that input's sub-score; the figure is the points it added to the 100-point composite (weight × sub-score).
- Cash flow +30.0/30.0
- DSCR +10.0/10.0
- 1% rule +9.2/10.0
- ARV discount +7.5/15.0
- Schools +5.0/10.0
- Rent growth +3.9/5.0
- Livability +3.1/5.0
- Condition / age +2.5/5.0
- Appreciation +0.0/10.0
$459,900
🖨 Deal sheet 📄 Offer letter ✓ Due diligence
Listing remarks MLS
This may be one of the best deals in Naples. Close to town, NO HOA, Trail Acres. Built in 1992, Brand New Roof and newer a/c system! Seller is having interior of home painted and new luxury vinyl plank flooring installed throughout. This 3 bedroom, 2 bath, has over 1500 square feet of living area a 1 car garage, 1 car carport, covered porch, and private rear yard with above ground pool. The home has high ceilings, and tons of character. You cant beat this deal this close to town. This one wont last. Seller may consider paying up to 3% towards buyers closing cost and prepaids
Key facts
- 6,534 sq ft lot
- Garage
- Built 1992
Property features AI
Finance
- Other: Property listed as one unit in a one-floor building
- HOA & community: Non-gated community (Trail Acres); Community park; Professional management; HOA maintenance covers insurance and internet/WiFi access
Exterior
- Parking: Attached garage (1 space); Attached carport (1 space); Paved driveway; Common parking available
- Security: Monitored alarm
- Utilities: Central water; Central sewer (assessment paid); Cable available
- Home design: Residential single-family home; Traditional style; Single story; Elevated construction; Rear exposure facing east; Entry includes foyer
- Construction: Built in 1992; Poured concrete and wood frame construction; Vinyl siding exterior; Shingle roof; See remarks for additional building description
- Exterior features: Deck; Fence; Patio; Screened lanai/porch; Open porch/lanai; Glass porch; Balcony; Atrium
Interior
- Kitchen: Built-in desk; Dishwasher; Range; Microwave; Refrigerator
- Bedrooms: 3 bedrooms plus den; Master bedroom on the ground level; Split bedroom layout
- Flooring: Concrete; Vinyl
- Bathrooms: 3 full bathrooms; Master bath with combo tub and shower and separate shower option
- Heating & cooling: Central electric heat (see remarks); Central electric cooling; Ceiling fans (4)
- Interior features: Built-in cabinets; Cathedral and vaulted ceilings; Closet cabinets; Foyer; Window coverings; See remarks
- Laundry & utility: Washer; Laundry in residence
Neighborhood map
What this means for you Summary
Snapshot
- This is a 3-bed/3.0-bath single-family listed at $460k.
Deal economics
- At list price, monthly cash flow is $2k ($22k/yr) — positive.
- The deal already cash-flows at list — no discount required.
- Meets the 1% rule at list price ($7k rent vs $460k).
- Recommended offer: $405k (12.0% below list) — sets the bar for market timing.
Location & tenants
- Location reads 61/100 on livability (#786 in FL) — a middle-class / working-renter tenant base. Strengths: crime A+, employment A-; Watch: health & safety D, amenities F, commute F.
- Collier (suburban): math 60% / reading 56% proficiency, ranked #16 of 73 in FL (top 22%) — acceptable for families but not a draw, mixed tenant base, ~2y average lease.
- Zoned schools: Lely Elementary School (math 45% / reading 46%, grade D-, #1,247 of 2,144 statewide, top 59%, 499 students, 62% FRL); Lely High School (math 40% / reading 39%, grade F, #304 of 667 statewide, top 47%, 1,504 students, 54% FRL) — zoned schools at 58% FRL track the district average.
- Zoned-school proficiency averages 42% at this address vs 58% district-wide (-16 pts) — the specific schools serving this property underperform the Collier average; the district grade overstates school quality for this exact location.
- Market conditions: Rents rising fast (+5.6%/yr); 597 active listings in the ZIP; 40 comparable units currently listed for rent nearby; rentals at typical pace (median 23d on market — plan ~3-4 weeks tenant-placement turnaround); solid renter incomes; 3,520 units permitted in Collier County in 2024 (959 in 5+ unit buildings).
Forward outlook
- Local home prices are declining (-3.0%/yr); year-one equity from $3k of loan paydown is wiped out by about $14k of value loss. Plan a longer hold.
- Collier County population projected at +30% by 2050 — long-run rental-demand tailwind backs the buy-and-hold thesis.
- At projected returns (-3.0% appreciation + 5.6% rent growth), your $129k cash investment doubles in ~6 years — after that, you're playing with house money.
Negotiation context
- It's been on market 136 days — a 12% lower offer ($405k) is reasonable based on typical stale-listing flexibility.
- 3 sale attempts since 2y ago with the ask held roughly flat each time — persistent listings suggest the price (not the market) is what's stuck; bring a comps-based counter.
- Current owner paid $375k; 23% above their basis — modest negotiation headroom, anchor on the comps not their cost.
Risks & watch-outs
- Watch-outs: flood insurance adds $427/mo.
- Climate carrying-cost: in FEMA flood zone AE (mandatory federal flood insurance); severe wind risk, 99% chance of damaging wind over 30y; extreme-heat days projected 7→28/yr by 2055 (HVAC capex compounding) — expect insurance premiums to compound above CPI over the hold.
Questions for the listing agent
- It's been on market 136 days. Have you received any prior offers? Is the seller open to a 12% concession, seller financing, or rate buy-down credit?
- What's the actual annual flood-insurance premium (NFIP or private), and is the property in a SFHA with mandatory coverage?
- Why hasn't it sold? Are there any deal-killer items the seller is aware of (foundation, flood, title, zoning, code violations)?
- Is there a deadline driving the sale (1031 exchange, divorce, estate, relocation)? That informs how much negotiation room exists.
- Schools are F-rated, which usually means shorter tenancies and higher turnover. Who's the typical renter profile here, and what's been the actual vacancy rate?
- What's the average days-on-market for RENTAL listings here right now (not sales)? A rising rental-DOM trend means longer vacancies and softer asking-rent achievability than the comps imply.
- What's the recent tenant-quality profile in this submarket — average credit score on applications, eviction rate, late-payment / NSF rate, and stable-employment percentage? A property-management company in the area should have these aggregated.
- How much new for-sale + rental construction is in the pipeline within 1–3 miles? Heavy new supply typically softens prices + rents 12–24 months out; constrained supply supports both.
Investment metrics
- 1% rule
- 1.42% ✓
- Cap rate
- 12.28%
- Cash-on-cash
- 21.37%
- DSCR
- 1.95
- GRM
- 5.8
CMA / ARV
No comps found within radius.
Projected returns pro-forma
-3.0% appreciation · 5.59% rent growth · sell at horizon
- IRR
- 11.8%
- Equity multiple
- 1.48×
- Total profit
- $62,087
- Equity at exit
- $68,573
- IRR
- 22.8%
- Equity multiple
- 3.20×
- Total profit
- $283,705
- Equity at exit
- $39,764
Cash invested: $128,772 (down + closing). Projections, not guarantees.
Landlord ↔ Tenant lean methodology
- Overall (STATE)
- 87 Strongly Landlord-Friendly
- State Florida
- 87 Strongly Landlord-Friendly · R+3
- County
- — inherits STATE
- City
- — inherits STATE
ZIP-level market 34113
- Rents YoY
- 5.6%
- Active inventory
- 597
- Price-to-rent
- 5.8×
Monthly cashflow live
- Estimated rent
- $6,551 high interval (Pro) →
- Mortgage (P&I)
- −$2,412
- Tax from tax record
- −$279 /mo · $3,342/yr
- Insurance
- −$192
- Flood insurance flood zone
- −$427 /mo · $5,118/yr
- HOA
- −$0
- Vacancy / Maint / Mgmt
- −$1,376
- Net cashflow
- $1,867
Break-even live
UW: 25.0% down · 7.5% · 30yr · 1.5% tax · 5.0% vac · 8.0% maint · 8.0% mgmt
Financing live
Cash to close
- Down payment
- $114,975
- Closing costs
- $13,797
- Reserves months
- —
- Total cash needed
- —
Loan-product check · same deal, 3 products live
Conventional
25% down · 7.5% · 30yr
- Down + closing
- —
- Monthly P&I
- —
- Monthly cashflow
- —
- DSCR
- —
- Eligible?
- —
Personal DTI + credit; lowest rate.
DSCR
20% down · 8.5% · 30yr
- Down + closing
- —
- Monthly P&I
- —
- Monthly cashflow
- —
- DSCR
- —
- Eligible?
- —
No personal income docs; deal must DSCR.
Hard money
10% down · 12.0% · 12mo
- Down + closing
- —
- Monthly P&I
- —
- Monthly cashflow
- —
- DSCR
- —
- Eligible?
- —
Short-term bridge; refi at stabilization.
Rent comps 40 comps
| Address | Beds | Baths | Sqft | Rent | $/sqft | DOM | Units | Dist |
|---|---|---|---|---|---|---|---|---|
| 11496 Sumter Grove Cir Naples, FL | 1.0–2.0 | 1.0–2.0 | 1067 | $2,134 | $2.00 | 13d | 14 | 0.23mi |
| 9844 Venezia Cir Naples, FL | 2.0 | 2.0 | 1661 | $10,250 | $6.17 | 23d | 2 | 0.65mi |
| 9832 Venezia Cir #1013 Naples, FL | 2.0 | 2.0 | 1454 | $7,000 | $4.81 | 23d | 1 | 0.73mi |
| 5237 Jennings St Naples, FL | 3.0 | 2.0 | 1971 | $2,500 | $1.27 | 23d | 1 | 0.73mi |
| 8888 Mustang Island Cir Naples, FL | 3.0 | 2.5 | 2028 | $10,000 | $4.93 | 23d | 1 | 0.77mi |
| 8884 Mustang Island Cir Naples, FL | 3.0 | 2.0 | 2000 | $12,500 | $6.25 | 21d | 1 | 0.77mi |
| 9815 Giaveno Ct #1234 Naples, FL | 2.0 | 2.0 | 1107 | $2,000 | $1.81 | 23d | 1 | 0.78mi |
| 9834 Giaveno Cir Naples, FL | 2.0 | 2.0 | 1272 | $5,225 | $4.11 | 13d | 3 | 0.78mi |
| 9834 Giaveno Cir Naples, FL | 2.0 | 2.0 | 1272 | $5,350 | $4.20 | 23d | 2 | 0.78mi |
| 9816 Giaveno Cir Naples, FL | 2.0 | 2.0 | 1213 | $3,375 | $2.78 | 23d | 2 | 0.79mi |
| 8963 Appaloosa Ct Naples, FL | 4.0 | 2.0 | 2023 | $15,000 | $7.41 | 23d | 1 | 0.79mi |
| 9830 Giaveno Cir Naples, FL | 2.0 | 2.0 | 1165 | $5,100 | $4.38 | 23d | 2 | 0.82mi |
| 9826 Giaveno Cir Naples, FL | 2.0 | 2.0 | 1320 | $4,500 | $3.41 | 21d | 3 | 0.82mi |
| 9820 Giaveno Cir Naples, FL | 2.0 | 2.0 | 1232 | $8,500 | $6.90 | 23d | 4 | 0.88mi |
| 9175 Michael Cir #4 Naples, FL | 3.0 | 2.0 | 1639 | $3,195 | $1.95 | 13d | 1 | 0.95mi |
| 9022 Michael Cir Unit 2-205 Naples, FL | 2.0 | 2.0 | 1450 | $3,500 | $2.41 | 23d | 1 | 1.00mi |
| 6065 Divot Ct Naples, FL | 3.0 | 2.0 | 1738 | $10,000 | $5.75 | 23d | 1 | 1.04mi |
| 6088 Dogleg Dr Naples, FL | 3.0 | 3.0 | 1965 | $2,890 | $1.47 | 23d | 1 | 1.06mi |
| 8468 Indian Wells Way Naples, FL | 3.0 | 2.0 | 1704 | $10,500 | $6.16 | 23d | 1 | 1.07mi |
| 8540 Mystic Greens Way #305 Naples, FL | 2.0 | 2.0 | 1710 | $4,995 | $2.92 | 13d | 1 | 1.09mi |
| 8432 Indian Wells Way Naples, FL | 3.0 | 2.0 | 1746 | $3,495 | $2.00 | 13d | 1 | 1.09mi |
| 6101 Dogleg Dr Naples, FL | 3.0 | 2.0 | 1694 | $12,000 | $7.08 | 23d | 1 | 1.09mi |
| 9715 Acqua Ct Naples, FL | 2.0 | 2.0 | 1184 | $5,500 | $4.64 | 23d | 3 | 1.09mi |
| 6105 Dogleg Dr Naples, FL | 3.0 | 3.0 | 1945 | $12,000 | $6.17 | 23d | 1 | 1.10mi |
| 1342 Kendari Ter Naples, FL | 3.0 | 2.5 | 2122 | $2,995 | $1.41 | 21d | 1 | 1.14mi |
| 9719 Acqua Ct Naples, FL | 2.0 | 2.0 | 1374 | $5,200 | $3.78 | 23d | 2 | 1.14mi |
| 1435 Santiago Cir #2003 Naples, FL | 3.0 | 2.5 | 1315 | $2,600 | $1.98 | 23d | 1 | 1.14mi |
| 8340 Mystic Greens Way #1501 Naples, FL | 2.0 | 2.0 | 1880 | $4,995 | $2.66 | 23d | 1 | 1.14mi |
| 1423 Santiago Cir #1702 Naples, FL | 2.0 | 2.5 | 1583 | $6,500 | $4.11 | 23d | 1 | 1.15mi |
| 1326 Kendari Ter Naples, FL | 3.0 | 3.5 | 2100 | $6,500 | $3.10 | 13d | 1 | 1.16mi |
| 1320 Kendari Ter Naples, FL | 3.0 | 2.5 | 2122 | $3,100 | $1.46 | 23d | 1 | 1.17mi |
| 1555 Marton Ct Naples, FL | 3.0 | 2.0 | 1908 | $6,720 | $3.52 | 23d | 1 | 1.18mi |
| 1308 Kendari Ter Naples, FL | 3.0 | 3.5 | 2115 | $4,000 | $1.89 | 21d | 1 | 1.19mi |
| 6737 Bent Grass Dr Naples, FL | 3.0 | 2.0 | 1745 | $12,000 | $6.88 | 23d | 1 | 1.20mi |
| 8161 Twelve Oaks Cir #512 Naples, FL | 2.0 | 2.0 | 1066 | $5,000 | $4.69 | 23d | 1 | 1.20mi |
| 6753 Bent Grass Dr Naples, FL | 3.0 | 3.0 | 1945 | $8,000 | $4.11 | 23d | 1 | 1.20mi |
| 6757 Bent Grass Dr Naples, FL | 3.0 | 2.0 | 1719 | $3,650 | $2.12 | 23d | 1 | 1.20mi |
| 6769 Bent Grass Dr Naples, FL | 2.0 | 2.0 | 1719 | $10,500 | $6.11 | 23d | 1 | 1.20mi |
| 1599 Marton Ct Naples, FL | 2.0 | 2.0 | 1900 | $3,000 | $1.58 | 23d | 1 | 1.20mi |
| 1330 Oceania Dr N #2 Naples, FL | 3.0 | 2.5 | 2022 | $7,000 | $3.46 | 23d | 1 | 1.23mi |
Listing history 23 events
-
2026-06-18days on market $459,900 Active 136 DOM
-
2026-06-17days on market $459,900 Active 135 DOM
-
2026-06-16days on market $459,900 Active 134 DOM
-
2026-06-15days on market $459,900 Active 133 DOM
-
2026-06-14days on market $459,900 Active 131 DOM
-
2026-06-10days on market $459,900 Active 128 DOM
-
2026-06-09days on market $459,900 Active 127 DOM
-
2026-06-08days on market $459,900 Active 126 DOM
-
2026-06-07days on market $459,900 Active 125 DOM
-
2026-06-03days on market $459,900 Active 121 DOM
-
2026-06-02days on market $459,900 Active 120 DOM
-
2026-06-01days on market $459,900 Active 119 DOM
-
2026-05-31days on market $459,900 Active 118 DOM
-
2026-05-30days on market $459,900 Active 117 DOM
-
2026-02-02$459,900 Active
-
2025-08-27historical
-
2024-12-04$469,900 Active
-
2024-05-07soldstatus $375,000
-
2024-05-03soldstatus $375,000 Sold 581-char remark
Show marketing remark (581 chars)
This may be one of the best deals in Naples. Close to town, NO HOA, Trail Acres. Built in 1992, Brand New Roof and newer a/c system! Seller is having interior of home painted and new luxury vinyl plank flooring installed throughout. This 3 bedroom, 2 bath, has over 1500 square feet of living area a 1 car garage, 1 car carport, covered porch, and private rear yard with above ground pool. The home has high ceilings, and tons of character. You cant beat this deal this close to town. This one wont last. Seller may consider paying up to 3% towards buyers closing cost and prepaids
-
2024-03-25status Pending With Contingencies 581-char remark
Show marketing remark (581 chars)
This may be one of the best deals in Naples. Close to town, NO HOA, Trail Acres. Built in 1992, Brand New Roof and newer a/c system! Seller is having interior of home painted and new luxury vinyl plank flooring installed throughout. This 3 bedroom, 2 bath, has over 1500 square feet of living area a 1 car garage, 1 car carport, covered porch, and private rear yard with above ground pool. The home has high ceilings, and tons of character. You cant beat this deal this close to town. This one wont last. Seller may consider paying up to 3% towards buyers closing cost and prepaids
-
2024-03-13$384,900 Active 581-char remark
Show marketing remark (581 chars)
This may be one of the best deals in Naples. Close to town, NO HOA, Trail Acres. Built in 1992, Brand New Roof and newer a/c system! Seller is having interior of home painted and new luxury vinyl plank flooring installed throughout. This 3 bedroom, 2 bath, has over 1500 square feet of living area a 1 car garage, 1 car carport, covered porch, and private rear yard with above ground pool. The home has high ceilings, and tons of character. You cant beat this deal this close to town. This one wont last. Seller may consider paying up to 3% towards buyers closing cost and prepaids
-
2024-02-16soldstatus $255,000
-
2003-12-10soldstatus $159,800
ⓘ Source: listings_history table (triggers on properties + properties_extension) + one-shot
backfill from property_details.listing_events for pre-trigger history.
Tax reassessment forecast FL · Resets to sale price
- Current annual tax
- $3,342 · $279/mo
- Projected year-2 tax
- $3,817 · $318/mo
- Expected delta
- +$475/yr (+$40/mo · 14.2%)
ⓘ Screening estimate from a state-policy table — verify with the county assessor before closing.
Climate risk First Street
- Flood 9/10 Extreme FEMA zone AE · 99% chance over 30 yrs
- Wildfire 3/10 Moderate
- Heat 10/10 Extreme 7 d/yr ≥108°F today · 28 d/yr by 30 yrs out
- Wind 10/10 Extreme 99% chance of damaging wind over 30 yrs
- Air quality 2/10 Low 2 unhealthy d/yr today · 2 by 30 yrs out
Nearby sold comps map
Loading sold comps map…
Walkable amenities ~0.75 mi
Loading nearby amenities…
Taxation est. · year 1
- Rental income
- $78,616
- − Mortgage interest
- −$25,762
- − Property taxes
- −$3,342
- − Insurance
- −$7,418
- − Repairs & maintenance
- −$6,289
- − Management
- −$6,289
- − Depreciation
- −$13,379
- Taxable income
- $16,137
- Est. tax owed @ 24.0%
- −$3,873
- After-tax cash flow
- $18,533/yr
For passive investors: Depreciation is non-cash, so a rental often shows a tax loss while cash-flowing — sheltering income. Rental losses are passive: they offset passive income freely, and up to $25,000/yr can offset ordinary (W-2) income if you actively participate and your MAGI is under $100k (phasing out to $0 by $150k); unused losses carry forward. On sale, claimed depreciation is recaptured at up to 25%, and gains may owe capital-gains tax (a 1031 exchange can defer both). Figures are a year-1 estimate at your 24.0% rate — not tax advice; consult a CPA.
Schools (NCES district)
- District
- Collier
- NCES district ID
- 1200330
- Math proficiency
- 60% ▼ -4.00%
- Reading proficiency
- 56% ▼ -2.00%
- Median HH income
- $58,275
- Composite
- 50.23/100
- National rank
- #1892
- State rank
- #16 of 73 in FL
Livability — Lely Resort
- Score
- 61/100
- State rank
- #786
- US rank
- #17981
Category grades
Schools grade is shown separately in the Schools card above.
Census & demographics
- County
- Collier County · 396,295 people
- Metro
- Naples-Marco Island, FL
- Population (ZIP)
- 26,056
- Household income
- $81,674
- Rent vs Own
- Severe rent burden
- 954.0
Population outlook (Collier County) Hauer SSP2
- Today (2025)
- 420,858 people
- By 2030
- 450,054 · +6.9%
- By 2040
- 502,232 · +19.3%
- By 2050
- 544,932 · +29.5%
- By 2075
- 627,203 · +49.0%
- By 2100
- 659,015 · +56.6%
Race, ethnicity, and origin ACS 2023
- Neighborhood character
- Diverse neighborhood (Simpson 0.59)
- Race & ethnicity
- White 56% Hispanic / Latino 28% Black 12% Two or more races 11% Asian 2%
- Hispanic origin (detail)
- Mexican 17% Puerto Rican 3% Cuban 2%
- Common ancestry
- Hispanic 10% Romanian 3% Lithuanian 2%
- Foreign-born
- 26% · Canada, Jamaica, Vietnam
- Languages at home
- 63% English-only · Spanish 24% French/Haitian/Cajun 9% Other Indo-European 2%
Political lean MEDSL · Collier
- 2024 margin
- Solid R (+33.1) · D 33.1% · R 66.2%
- 2008→2024 swing
- -10.6pp toward R · 2008: -22.5pp · 2024: -33.1pp
- All cycles
- 2024: R+33.1 2020: R+24.7 2016: R+26.0 2012: R+30.1 2008: R+22.5
Not yet ingested
- Civics
- —
Market trends
- HPI YoY
- ▼ -194.86%
- Current HPI
- 279.4232
- Rent YoY
- ▲ 5.59%
- Metro
- Naples-Marco Island, FL
- State GDP YoY
- ▲ 3.28%
- F500 in state
- 36
Industry mix (Fortune 500 HQ in FL)
| Industry | F500 HQs | Revenue |
|---|---|---|
| Industrial Technology | 2 | $29B |
|
||
| Insurance | 2 | $17B |
|
||
| Retail | 1 | $60B |
|
||
| Technology Distribution | 1 | $58B |
|
||
| Homebuilding | 1 | $35B |
|
||
| Technology Manufacturing | 1 | $35B |
|
||
Price history
+187.8% since first listed9 events — show timeline
- 2026-02-02 Listed $459,900 NAPLESMLS
- 2025-08-27 Listing Removed — NAPLESMLS
- 2024-12-04 Listed $469,900 NAPLESMLS
- 2024-05-07 Sold (Public Records) $375,000 Public Records
- 2024-05-03 Sold (MLS) $375,000 NAPLESMLS
- 2024-03-25 Pending — NAPLESMLS
- 2024-03-13 Listed $384,900 NAPLESMLS
- 2024-02-16 Sold (Public Records) $255,000 Public Records
- 2003-12-10 Sold (Public Records) $159,800 Public Records
Property tax history
+15.0%/yrLatest (2025): $3,342 · +209.5% YoY. Source: county tax records.
Cash-flow waterfall
monthlySold comps — $/sqft
last 12 mo · ≤1 miLoading sold comps…