 Duplex
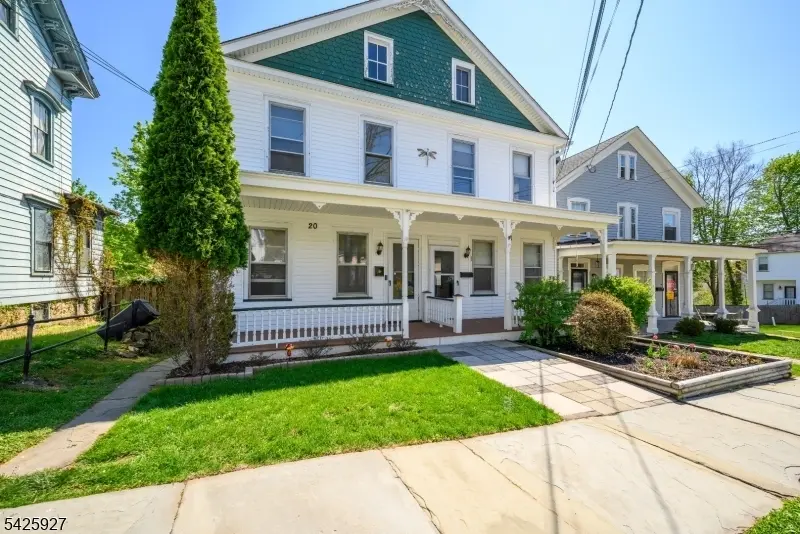
18 Church St · High Bridge, NJ
Flood risk 1/10 · Minimal
- FEMA flood zone
- X (unshaded)
- Chance of flooding over 30 yrs
- 0.0%
- Est. flood insurance / yr
- $507 – $1,088
Fire risk 2/10 · Minimal
- Est. fire insurance / yr
- $526 – $976
Heat risk 5/10 · Moderate
- Hot days now (above 100°F)
- 7 days/yr
- Hot days in 30 yrs
- 15 days/yr
Wind risk 5/10 · Moderate
- Chance of severe wind over 30 yrs
- 23.0%
Air-quality risk 3/10 · Minor
- Unhealthy air days now
- 2 days/yr
- Unhealthy air days in 30 yrs
- 3 days/yr
Risk factors via First Street. Map © Google.
Why this score? — see what drove the C grade
The composite is a weighted blend of 9 inputs, each scored 0–100. Each bar is that input's sub-score; the figure is the points it added to the 100-point composite (weight × sub-score).
- Cash flow +19.5/30.0
- ARV discount +7.5/15.0
- DSCR +6.2/10.0
- 1% rule +5.2/10.0
- Appreciation +5.0/10.0
- Schools +4.9/10.0
- Condition / age +4.0/5.0
- Livability +3.7/5.0
- Rent growth +2.5/5.0
$525,000
🖨 Deal sheet (PDF) 📄 Offer letter ✓ Due diligence
Multi-family units
County records classify this as Multi-Family (2-4 Unit). Listing-text estimate: 2 units. confirmed
Listing remarks
Excellent opportunity in High Bridge! This well-maintained 2-family duplex is perfect for investors or owner-occupants looking to generate rental income while building equity. Each spacious unit features 3 bedrooms, 1 full bath, a bright living room, formal dining room, Kitchen, and. freshly painted interiors ready for immediate occupancy. Both sides offer their own walkout basement plus walk-up attic space, providing ample storage or future potential. Conveniently located close to the center of town, shopping, dining, and local amenities. On-street parking available. A rare multi-family opportunity with strong income potential in a desirable location don't miss this one!
Key facts
- Walkout basement
- Walk up attic
- Desirable location
Tags
Property features AI
Finance
- Financial info: Two-unit property; Reported net operating income: $0; Reported gross operating income: $0; Reported total operating expenses: $0; Unit 1 rent: $0; Unit 2 rent: $0
Exterior
- Parking: On-street parking
- Security: Carbon monoxide detectors; Smoke detectors
- Utilities: Electric service; Natural gas service; Public water; Public sewer
- Home design: Duplex (side-by-side)
- Construction: Approximate year built
- Exterior features: Open porch(es); Vinyl siding; Asphalt shingle roof
Interior
- Kitchen: Refrigerator (Unit 1); Refrigerator (Unit 2)
- Bedrooms: Unit 1: 3 bedrooms; Unit 2: 3 bedrooms
- Flooring: Wood floors
- Bathrooms: 2 full bathrooms (total); Unit 1: 1 bathroom; Unit 2: 1 bathroom
- Heating & cooling: Two heating units; Natural gas heating; Window air conditioners
- Interior features: Carbon monoxide detector; Smoke detector; Wood floors; Gas water heater; Full unfinished walkout basement
- Laundry & utility: Washer and dryer (Unit 1); Washer and dryer (Unit 2)
Neighborhood map
What this means for you Summary
Snapshot
- This is a 2 × 3-bed/1.0-bath units multifamily listed at $525k. Condition is rated good.
Deal economics
- At list price, monthly cash flow is $598 ($7k/yr) — positive. Per door: $299/mo.
- The deal already cash-flows at list — no discount required.
- Meets the 1% rule at list price ($5k rent vs $525k).
Location & tenants
- Location reads 74/100 on livability (#178 in NJ, #4,717 nationally) — a middle-class / working-renter tenant base. Strengths: crime A+, employment A+, housing A+; Watch: health & safety D, amenities F, commute F.
- North Hunterdon-Voorhees Regional High School District (suburban): math 37% / reading 63% proficiency, ranked #103 of 472 in NJ (top 22%) — acceptable for families but not a draw, mixed tenant base, ~2y average lease.
- Market conditions: 1 active listings in the ZIP; 389 units permitted in Hunterdon County in 2024 (180 in 5+ unit buildings).
Forward outlook
- In year one you build about $19k of equity ($4k loan paydown + $16k appreciation (3.0% local appreciation)).
- Hunterdon County population projected to shrink 8% by 2050 — rents likely to lag national; underwrite the cash flow, not the appreciation.
- At projected returns (3.0% appreciation + 3.0% rent growth), your $147k cash investment doubles in ~5 years — after that, you're playing with house money.
- By year 2, paydown + projected appreciation supports a ~$32k cash-out refi (75% LTV) — recoverable capital for the next deal without selling this one.
Negotiation context
- Only 14 days on market — expect competitive offers; lowballing is unlikely to land.
- 2 sale attempts since 8y ago with the ask held roughly flat each time — persistent listings suggest the price (not the market) is what's stuck; bring a comps-based counter.
- Current owner paid $235k; list at $525k implies a 123% gain — meaningful room to come down on a strong offer.
Risks & watch-outs
- Watch-outs: built in 1870 — expect roof / HVAC / electrical / plumbing capex.
- Climate carrying-cost: moderate wind risk, 23% chance of damaging wind over 30y; extreme-heat days projected 7→15/yr by 2055 (HVAC capex compounding) — expect insurance premiums to compound above CPI over the hold.
Questions for the listing agent
- Can we see the unit-by-unit rent roll, current vacancy, and any below-market leases? What's the average tenancy length?
- What capital expenditures (roof, boiler, parking lot, exteriors) have been made in the last 5 years, and what's planned in the next 2?
- Built in 1870 — when were the roof, HVAC, electrical panel, plumbing, and water heater last replaced?
- Is there a deadline driving the sale (1031 exchange, divorce, estate, relocation)? That informs how much negotiation room exists.
- Schools are B-rated — typically a magnet for longer-tenancy family renters. What's the average tenant stay here, and is there a school-zone premium baked into asking?
- What's the average days-on-market for RENTAL listings here right now (not sales)? A rising rental-DOM trend means longer vacancies and softer asking-rent achievability than the comps imply.
- What's the recent tenant-quality profile in this submarket — average credit score on applications, eviction rate, late-payment / NSF rate, and stable-employment percentage? A property-management company in the area should have these aggregated.
- How much new apartment / multifamily construction is in the pipeline within 1–3 miles? Heavy new supply (>2% of stock underway) typically softens rents 12–24 months out; light construction supports rent growth.
Investment metrics
- 1% rule
- 1.02% ✓
- Cap rate
- 7.66%
- Cash-on-cash
- 4.88%
- DSCR
- 1.22
- GRM
- 8.2
CMA / ARV
No comps found within radius.
Projected returns pro-forma
3.0% appreciation · 3.0% rent growth · sell at horizon
- IRR
- 12.1%
- Equity multiple
- 1.69×
- Total profit
- $101,433
- Equity at exit
- $236,063
- IRR
- 14.1%
- Equity multiple
- 3.09×
- Total profit
- $307,878
- Equity at exit
- $363,801
Cash invested: $147,000 (down + closing). Projections, not guarantees.
Landlord ↔ Tenant lean methodology
- Overall (STATE)
- 21 Tenant-Leaning
- State New Jersey
- 21 Tenant-Leaning · D+6
- County
- — inherits STATE
- City
- — inherits STATE
ZIP-level market 08829-1506
- Active inventory
- 1
- Price-to-rent
- 16.4×
Monthly cashflow live
- Estimated rent
- $5,350 medium interval (Pro) →
- Mortgage (P&I)
- −$2,753
- Tax est. 1.5%
- −$656 /mo · $7,875/yr
- Insurance
- −$219
- HOA
- −$0
- Vacancy / Maint / Mgmt
- −$1,124
- Net cashflow
- $598
Break-even live
Sensitivity live
| Price | -10% $961 | -5% $780 | +0% $598 | +5% $417 | +10% $236 |
|---|---|---|---|---|---|
| Rent | -10% $176 | -5% $387 | +0% $598 | +5% $810 | +10% $1,021 |
| Rate | -1.0pp $863 | -0.5pp $732 | base $598 | +0.5pp $462 | +1.0pp $324 |
2-unit breakdown (identical units grouped — click to expand)
| Units | Beds | Baths | Est. rent |
|---|---|---|---|
| 2× units | 3 | 1 | $5,350 |
| #1 | 3 | 1 | $2,675 |
| #2 | 3 | 1 | $2,675 |
| Total (2 units) | $5,350 | ||
UW: 25.0% down · 7.5% · 30yr · 1.5% tax · 5.0% vac · 8.0% maint · 8.0% mgmt
Financing live
Cash to close
- Down payment
- $131,250
- Closing costs
- $15,750
- Reserves months
- —
- Total cash needed
- —
Loan-product check · same deal, 3 products live
Conventional
25% down · 7.5% · 30yr
- Down + closing
- —
- Monthly P&I
- —
- Monthly cashflow
- —
- DSCR
- —
- Eligible?
- —
Personal DTI + credit; lowest rate.
DSCR
20% down · 8.5% · 30yr
- Down + closing
- —
- Monthly P&I
- —
- Monthly cashflow
- —
- DSCR
- —
- Eligible?
- —
No personal income docs; deal must DSCR.
Hard money
10% down · 12.0% · 12mo
- Down + closing
- —
- Monthly P&I
- —
- Monthly cashflow
- —
- DSCR
- —
- Eligible?
- —
Short-term bridge; refi at stabilization.
Listing history 5 events
-
2026-05-08status Under Contract
-
2026-04-24$525,000 Active
-
2018-05-10soldstatus $235,000 Sold
-
2018-03-06historical
-
2018-02-10$235,000 Active
ⓘ Source: listings_history table (triggers on properties + properties_extension) + one-shot
backfill from property_details.listing_events for pre-trigger history.
Climate risk First Street
- Flood 1/10 Low FEMA zone X (unshaded) · 0% chance over 30 yrs
- Wildfire 2/10 Low
- Heat 5/10 Major 7 d/yr ≥100°F today · 15 d/yr by 30 yrs out
- Wind 5/10 Major 23% chance of damaging wind over 30 yrs
- Air quality 3/10 Moderate 2 unhealthy d/yr today · 3 by 30 yrs out
Nearby sold comps map
Loading sold comps map…
Walkable amenities ~0.75 mi
Loading nearby amenities…
Taxation est. · year 1
- Rental income
- $64,200
- − Mortgage interest
- −$29,408
- − Property taxes
- −$7,875
- − Insurance
- −$2,625
- − Repairs & maintenance
- −$5,136
- − Management
- −$5,136
- − Depreciation
- −$15,273
- Taxable loss
- −$1,253
- Est. tax savings @ 24.0%
- +$301
- After-tax cash flow
- $7,481/yr
For passive investors: Depreciation is non-cash, so a rental often shows a tax loss while cash-flowing — sheltering income. Rental losses are passive: they offset passive income freely, and up to $25,000/yr can offset ordinary (W-2) income if you actively participate and your MAGI is under $100k (phasing out to $0 by $150k); unused losses carry forward. On sale, claimed depreciation is recaptured at up to 25%, and gains may owe capital-gains tax (a 1031 exchange can defer both). Figures are a year-1 estimate at your 24.0% rate — not tax advice; consult a CPA.
Condition & rehab AI · 12 photos
This well-maintained 2-family duplex is ready for immediate occupancy and offers strong income potential in a desirable location.
Value-add opportunities
- Both Painting exterior and interior — Fresh paint enhances curb appeal and interior aesthetics
- Both Landscaping improvements — Enhances curb appeal and adds value
- Both New roof inspection and maintenance — Ensures long-term durability and value
- Both HVAC system inspection and maintenance — Ensures comfort and energy efficiency
- Both Kitchen and bathroom updates — Modernizes spaces and adds value
Renovation cost estimate screening
Value-add ROI direction
- Both Painting exterior and interior — Fresh paint enhances curb appeal and interior aesthetics ↑
- Both Landscaping improvements — Enhances curb appeal and adds value ↑
- Both New roof inspection and maintenance — Ensures long-term durability and value ↑
- Both HVAC system inspection and maintenance — Ensures comfort and energy efficiency ↑
- Both Kitchen and bathroom updates — Modernizes spaces and adds value ↑
ⓘ Cost ranges are severity-bucket heuristics (US national rule-of-thumb). Get contractor quotes + a written scope before underwriting a rehab budget.
Schools (NCES district)
- District
- North Hunterdon-Voorhees Regional High School District
- NCES district ID
- 3411610
- Math proficiency
- 37% ▼ -17.00%
- Reading proficiency
- 63% ▼ -8.00%
- Median HH income
- $112,200
- Composite
- 48.63/100
- National rank
- #2108
- State rank
- #103 of 472 in NJ
Livability — High Bridge
- Score
- 74/100
- State rank
- #178
- US rank
- #4717
Category grades
Schools grade is shown separately in the Schools card above.
Census & demographics
- Census place
- High Bridge, NJ
Population outlook (Hunterdon County) Hauer SSP2
- Today (2025)
- 122,644 people
- By 2030
- 121,131 · -1.2%
- By 2040
- 117,753 · -4.0%
- By 2050
- 112,601 · -8.2%
- By 2075
- 104,371 · -14.9%
- By 2100
- 93,364 · -23.9%
Not yet ingested
- Political lean
- —
- Race & ethnicity
- —
- Common origin
- —
- Civics
- —
Market trends
- HPI YoY
- —
- Current HPI
- —
- Rent YoY
- —
- Metro
- —
- State GDP YoY
- ▲ 2.05%
- F500 in state
- 34
Industry mix (Fortune 500 HQ in NJ)
| Industry | F500 HQs | Revenue |
|---|---|---|
| Consumer Goods | 3 | $31B |
|
||
| Pharmaceuticals | 2 | $153B |
|
||
| Technology | 2 | $21B |
|
||
| Insurance | 2 | $20B |
|
||
| Healthcare | 2 | $19B |
|
||
| Financial Services | 1 | $70B |
|
||
Price history
+123.4% since first listed5 events — show timeline
- 2026-05-08 Pending — GSMLS
- 2026-04-24 Listed $525,000 GSMLS
- 2018-05-10 Sold (MLS) $235,000 GSMLS
- 2018-03-06 Delisted — GSMLS
- 2018-02-10 Listed $235,000 GSMLS
Cash-flow waterfall
monthlySold comps — $/sqft
last 12 mo · ≤1 miLoading sold comps…