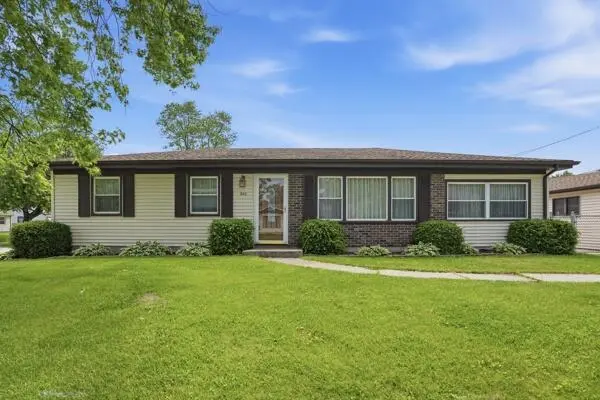
340 Midway Dr · South Haven, IN
Flood risk 1/10 · Minimal
- FEMA flood zone
- X (unshaded)
- Chance of flooding over 30 yrs
- 0.0%
- Est. flood insurance / yr
- $507 – $1,088
Fire risk 1/10 · Minimal
- Est. fire insurance / yr
- $717 – $1,331
Heat risk 2/10 · Minimal
- Hot days now (above 101°F)
- 7 days/yr
- Hot days in 30 yrs
- 15 days/yr
Wind risk 2/10 · Minimal
- Chance of severe wind over 30 yrs
- —
Air-quality risk 2/10 · Minimal
- Unhealthy air days now
- 1 days/yr
- Unhealthy air days in 30 yrs
- 2 days/yr
Risk factors via First Street. Map © Google.
Why this score? — see what drove the D- grade
The composite is a weighted blend of 9 inputs, each scored 0–100. Each bar is that input's sub-score; the figure is the points it added to the 100-point composite (weight × sub-score).
- Cash flow +14.2/30.0
- ARV discount +5.7/15.0
- DSCR +4.3/10.0
- Livability +3.6/5.0
- 1% rule +2.9/10.0
- Schools +2.7/10.0
- Rent growth +2.5/5.0
- Condition / age +2.5/5.0
- Appreciation +0.0/10.0
$240,000
🖨 Deal sheet 📄 Offer letter ✓ Due diligence
Listing remarks
Beautifully maintained 3-bedroom, 1.5-bath home in a convenient Valparaiso location! This inviting property features a spacious kitchen with plenty of room for cooking, dining, and gathering. The home also offers additional living space with the attached garage thoughtfully converted into a versatile bonus room perfect for a family room, home office, playroom, or entertainment area. Outside, you'll find a detached 2-car garage, a large backyard ideal for relaxing or entertaining, and a spacious concrete patio ready for summer gatherings and outdoor enjoyment. Conveniently located close to schools, parks, shopping, dining, and major highways, this home combines comfort, functionality, and ac
Key facts
- Spacious kitchen
- Large backyard
- Concrete patio
Tags
Property features AI
Finance
- HOA & community: South Haven HOA; Quarterly HOA fee of $105 (includes trash); Association has no listed amenities
Exterior
- Parking: Detached garage; Garage faces front; Driveway; 2-car garage
- Utilities: Electricity connected (100 amp service); Public water; Public sewer; Natural gas connected
- Home design: Single-story home; Built in 1965
- Construction: Built in 1965
- Exterior features: Neighborhood view; Asphalt/shingle roof
Interior
- Kitchen: Gas range; Microwave; Refrigerator
- Bedrooms: Primary bedroom; Bedroom 2; Bedroom 3; Bonus room
- Bathrooms: 1 full bathroom; 1 half bathroom
- Heating & cooling: Forced air heating (natural gas); Central air conditioning
- Interior features: Ceiling fan(s); Crawl space basement
- Laundry & utility: Washer and dryer on main level; Gas water heater
Neighborhood map
What this means for you Summary
Snapshot
- This is a 3-bed/1.5-bath single-family listed at $240k.
Deal economics
- At list price, monthly cash flow is $37 ($449/yr) — positive.
- The deal already cash-flows at list — no discount required.
- To meet the 1% rule (rent ≥ 1% of price), the offer needs to be $190k (20.8% below list).
- Recommended offer: $190k (20.8% below list) — sets the bar for 1% rule.
Location & tenants
- Location reads 72/100 on livability (#119 in IN) — a middle-class / working-renter tenant base. Strengths: cost of living A+, housing A+, health & safety A; Watch: amenities F, commute F.
- Portage Township Schools (suburban): math 26% / reading 36% proficiency, ranked #221 of 301 in IN (top 73%) — families likely to look elsewhere, expect single-tenant / working-renter base with shorter leases.
- Market conditions: 375 active listings in the ZIP; 7 comparable units currently listed for rent nearby; rentals leasing fast (median 11d on market — plan ~1-2 weeks tenant-placement turnaround); solid renter incomes; 542 units permitted in Porter County in 2024 (0 in 5+ unit buildings).
Forward outlook
- Local home prices are declining (-3.0%/yr); year-one equity from $2k of loan paydown is wiped out by about $7k of value loss. Plan a longer hold.
- Porter County population projected at +6% by 2050 — modest demand growth; plan on rents tracking national, not racing it.
Negotiation context
- It's been on market 26 days — a 2% lower offer ($236k) is reasonable based on typical stale-listing flexibility.
Questions for the listing agent
- Built in 1965 — when were the roof, HVAC, electrical panel, plumbing, and water heater last replaced?
- What does the HOA fee cover, when was the last increase, and are there any pending special assessments or reserve-fund shortfalls?
- Is there a deadline driving the sale (1031 exchange, divorce, estate, relocation)? That informs how much negotiation room exists.
- The area grade is low — what's the realistic commute time and amenity access for the typical tenant pool here? Any planned neighborhood developments (good or bad) we should know about?
- What's the average days-on-market for RENTAL listings here right now (not sales)? A rising rental-DOM trend means longer vacancies and softer asking-rent achievability than the comps imply.
- What's the recent tenant-quality profile in this submarket — average credit score on applications, eviction rate, late-payment / NSF rate, and stable-employment percentage? A property-management company in the area should have these aggregated.
- How much new for-sale + rental construction is in the pipeline within 1–3 miles? Heavy new supply typically softens prices + rents 12–24 months out; constrained supply supports both.
Investment metrics
- 1% rule
- 0.79% ✗
- Cap rate
- 6.48%
- Cash-on-cash
- 0.67%
- DSCR
- 1.03
- GRM
- 10.5
CMA / ARV
- ARV (on-the-fly)
- $231,000
- Comps found
- 12
Show comp detail 12 sales within ~0.75 mi
| Address | Dist | Beds/Ba | Sqft | Sold | Price | $/sf | Match |
|---|---|---|---|---|---|---|---|
| 740 Imperial Rd | 0.12mi | 4/1.5 (+1) | 1,400 (0%) | 1mo | $219,000 | $156 | 88 |
| 754 Governor Rd | 0.14mi | 3/2.0 | 1,484 (+6%) | 1mo | $230,000 | $155 | 80 |
| 767-1 Heritage Rd | 0.20mi | 3/1.0 | 1,344 (-4%) | 4mo | $160,000 | $119 | 79 |
| 721 Fox River Rd | 0.20mi | 4/1.5 (+1) | 1,316 (-6%) | 1mo | $240,000 | $182 | 75 |
| 775-1 Eagle Creek Rd | 0.40mi | 3/1.5 | 1,512 (+8%) | 0mo | $255,000 | $169 | 68 |
| 763 Timberline Pkwy | 0.36mi | 3/1.5 | 1,280 (-9%) | 4mo | $197,000 | $154 | 66 |
| 376 Briarwood Dr | 0.37mi | 3/1.5 | 1,280 (-9%) | 3mo | $211,000 | $165 | 66 |
| 722-1 Capitol Rd | 0.33mi | 4/2.0 (+1) | 1,316 (-6%) | 2mo | $239,900 | $182 | 66 |
| 746-1 Acadia Rd | 0.38mi | 3/1.5 | 1,534 (+10%) | 4mo | $215,000 | $140 | 63 |
| 711 Juniper Rd | 0.26mi | 4/1.0 (+1) | 1,240 (-11%) | 3mo | $251,000 | $202 | 59 |
| 384 Lahonda Dr | 0.53mi | 3/1.0 | 1,280 (-9%) | 1mo | $205,000 | $160 | 58 |
| 768 Devonshire Rd | 0.33mi | 4/1.0 (+1) | 1,248 (-11%) | 2mo | $240,000 | $192 | 58 |
Match score weights: distance 35% · size 25% · config 20% · recency 20%. Top-matched comps best support the ARV.
Projected returns pro-forma
-3.0% appreciation · 3.0% rent growth · sell at horizon
- IRR
- -15.3%
- Equity multiple
- 0.46×
- Total profit
- $-36,596
- Equity at exit
- $35,785
- IRR
- -6.8%
- Equity multiple
- 0.57×
- Total profit
- $-29,164
- Equity at exit
- $20,751
Cash invested: $67,200 (down + closing). Projections, not guarantees.
Landlord ↔ Tenant lean methodology
- Overall (STATE)
- 90 Strongly Landlord-Friendly
- State Indiana
- 90 Strongly Landlord-Friendly · R+11
- County
- — inherits STATE
- City
- — inherits STATE
ZIP-level market 46385
- Active inventory
- 375
- Price-to-rent
- 10.5×
Monthly cashflow live
- Estimated rent
- $1,901 high interval (Pro) →
- Mortgage (P&I)
- −$1,259
- Tax from tax record
- −$71 /mo · $847/yr
- Insurance
- −$100
- HOA
- −$35
- Vacancy / Maint / Mgmt
- −$399
- Net cashflow
- $37
Break-even live
UW: 25.0% down · 7.5% · 30yr · 1.5% tax · 5.0% vac · 8.0% maint · 8.0% mgmt
Financing live
Cash to close
- Down payment
- $60,000
- Closing costs
- $7,200
- Reserves months
- —
- Total cash needed
- —
Loan-product check · same deal, 3 products live
Conventional
25% down · 7.5% · 30yr
- Down + closing
- —
- Monthly P&I
- —
- Monthly cashflow
- —
- DSCR
- —
- Eligible?
- —
Personal DTI + credit; lowest rate.
DSCR
20% down · 8.5% · 30yr
- Down + closing
- —
- Monthly P&I
- —
- Monthly cashflow
- —
- DSCR
- —
- Eligible?
- —
No personal income docs; deal must DSCR.
Hard money
10% down · 12.0% · 12mo
- Down + closing
- —
- Monthly P&I
- —
- Monthly cashflow
- —
- DSCR
- —
- Eligible?
- —
Short-term bridge; refi at stabilization.
Rent comps 7 comps
| Address | Beds | Baths | Sqft | Rent | $/sqft | DOM | Units | Dist |
|---|---|---|---|---|---|---|---|---|
| 774 Fox River Rd Valparaiso, IN | 3.0 | 1.5 | 1176 | $1,725 | $1.47 | 44d | 1 | 0.34mi |
| 732 N State Road 149 Valparaiso, IN | 3.0 | 1.0 | 1008 | $1,650 | $1.64 | 1d | 1 | 0.44mi |
| 778 Capitol Rd Valparaiso, IN | 4.0 | 1.5 | 1114 | $1,895 | $1.70 | 17d | 1 | 0.47mi |
| 374 Raritan Dr Valparaiso, IN | 3.0 | 1.0 | 960 | $1,800 | $1.88 | 10d | 1 | 0.53mi |
| 678 Dearborn Rd Unit B Valparaiso, IN | 2.0 | 1.5 | 1000 | $1,395 | $1.40 | 10d | 1 | 0.81mi |
| 397 Plymouth Rd Unit B Valparaiso, IN | 3.0 | 2.0 | 1300 | $1,795 | $1.38 | 44d | 1 | 0.87mi |
| 3471 Sunnyside Dr Portage, IN | 1.0–2.0 | 1.0–2.0 | 1083 | $1,940 | $1.79 | 1d | 11 | 1.41mi |
HOA detail
- Monthly dues
- $35 · $420/yr
Listing history 15 events
-
2026-06-18days on market $240,000 Active 26 DOM
-
2026-06-17days on market $240,000 Active 25 DOM
-
2026-06-16days on market $240,000 Active 24 DOM
-
2026-06-15days on market $240,000 Active 23 DOM
-
2026-06-13days on market $240,000 Active 21 DOM
-
2026-06-13days on market $240,000 Active 20 DOM
-
2026-06-09days on market $240,000 Active 17 DOM
-
2026-06-08days on market $240,000 Active 16 DOM
-
2026-06-07days on market $240,000 Active 15 DOM
-
2026-06-04days on market $240,000 Active 12 DOM
-
2026-06-03days on market $240,000 Active 11 DOM
-
2026-06-02days on market $240,000 Active 10 DOM
-
2026-06-01days on market $240,000 Active 9 DOM
-
2026-05-31days on market $240,000 Active 8 DOM
-
2026-05-23$240,000 Active
ⓘ Source: listings_history table (triggers on properties + properties_extension) + one-shot
backfill from property_details.listing_events for pre-trigger history.
Tax reassessment forecast IN · Partial reset (capped growth)
- Current annual tax
- $847 · $71/mo
- Projected year-2 tax
- $1,444 · $120/mo
- Expected delta
- +$596/yr (+$50/mo · 70.4%)
ⓘ Screening estimate from a state-policy table — verify with the county assessor before closing.
Climate risk First Street
- Flood 1/10 Low FEMA zone X (unshaded) · 0% chance over 30 yrs
- Wildfire 1/10 Low
- Heat 2/10 Low 7 d/yr ≥101°F today · 15 d/yr by 30 yrs out
- Wind 2/10 Low
- Air quality 2/10 Low 1 unhealthy d/yr today · 2 by 30 yrs out
Nearby sold comps map
Loading sold comps map…
Walkable amenities ~0.75 mi
Loading nearby amenities…
Taxation est. · year 1
- Rental income
- $22,810
- − Mortgage interest
- −$13,444
- − Property taxes
- −$847
- − Insurance
- −$1,200
- − Repairs & maintenance
- −$1,825
- − Management
- −$1,825
- − HOA
- −$420
- − Depreciation
- −$6,982
- Taxable loss
- −$3,733
- Est. tax savings @ 24.0%
- +$896
- After-tax cash flow
- $1,345/yr
For passive investors: Depreciation is non-cash, so a rental often shows a tax loss while cash-flowing — sheltering income. Rental losses are passive: they offset passive income freely, and up to $25,000/yr can offset ordinary (W-2) income if you actively participate and your MAGI is under $100k (phasing out to $0 by $150k); unused losses carry forward. On sale, claimed depreciation is recaptured at up to 25%, and gains may owe capital-gains tax (a 1031 exchange can defer both). Figures are a year-1 estimate at your 24.0% rate — not tax advice; consult a CPA.
Schools (NCES district)
- District
- Portage Township Schools
- NCES district ID
- 1809150
- Math proficiency
- 26% ▼ -15.00%
- Reading proficiency
- 36% ▼ -10.00%
- Median HH income
- $53,880
- Composite
- 27.37/100
- National rank
- #6978
- State rank
- #221 of 301 in IN
Livability — South Haven
- Score
- 72/100
- State rank
- #119
- US rank
- #6424
Category grades
Schools grade is shown separately in the Schools card above.
Census & demographics
- Census place
- South Haven, IN
- County
- Porter County · 151,647 people
- Metro
- Chicago-Naperville-Elgin, IL-IN-WI
- Population (ZIP)
- 40,856
- Household income
- $98,957
- Rent vs Own
- Severe rent burden
- 304.0
Population outlook (Porter County) Hauer SSP2
- Today (2025)
- 177,804 people
- By 2030
- 181,552 · +2.1%
- By 2040
- 185,830 · +4.5%
- By 2050
- 187,498 · +5.5%
- By 2075
- 189,585 · +6.6%
- By 2100
- 183,722 · +3.3%
Race, ethnicity, and origin ACS 2023
- Neighborhood character
- Predominantly White (83%)
- Race & ethnicity
- White 83% Hispanic / Latino 9% Two or more races 7% Black 2% Asian 2%
- Hispanic origin (detail)
- Mexican 6% Puerto Rican 2%
- Common ancestry
- Romanian 9% Italian 2% Lithuanian 2%
- Foreign-born
- 3% · Canada, Philippines
- Languages at home
- 94% English-only · Spanish 2% Other Indo-European 1% Russian/Polish/Slavic 1%
Political lean MEDSL · Porter
- 2024 margin
- R (+10.5) · D 43.8% · R 54.3% · Other 1.8%
- 2008→2024 swing
- -17.7pp toward R · 2008: 7.2pp · 2024: -10.5pp
- All cycles
- 2024: R+10.5 2020: R+6.1 2016: R+6.8 2012: D+3.8 2008: D+7.2
Not yet ingested
- Civics
- —
Market trends
- HPI YoY
- ▼ -151.11%
- Current HPI
- 201.7039
- Rent YoY
- —
- Metro
- Chicago-Naperville-Elgin, IL-IN-WI
- State GDP YoY
- ▲ 2.90%
- F500 in state
- 18
Industry mix (Fortune 500 HQ in IN)
| Industry | F500 HQs | Revenue |
|---|---|---|
| Industrial Machinery | 2 | $37B |
|
||
| Healthcare | 1 | $177B |
|
||
| Pharmaceuticals | 1 | $45B |
|
||
| Metals / Steel | 1 | $18B |
|
||
| Agriculture | 1 | $17B |
|
||
| Packaging | 1 | $12B |
|
||
Price history
1 event — show timeline
- 2026-05-23 Listed $240,000 NIRA MLS as Distributed by MLS Grid
Property tax history
+18.9%/yrLatest (2024): $847 · +13.0% YoY. Source: county tax records.
Cash-flow waterfall
monthlySold comps — $/sqft
last 12 mo · ≤1 miLoading sold comps…