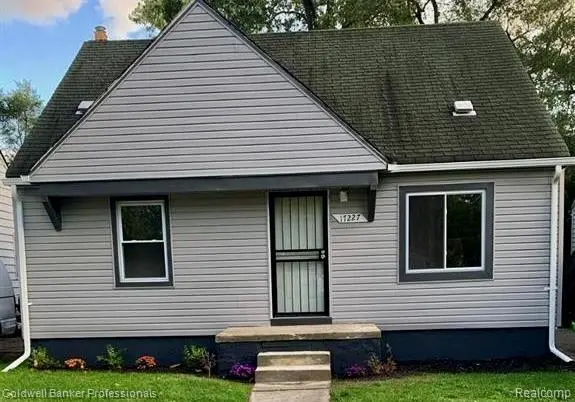
17227 Curtis St · Detroit, MI
Flood risk 1/10 · Minimal
- FEMA flood zone
- X (unshaded)
- Chance of flooding over 30 yrs
- 0.0%
- Est. flood insurance / yr
- $473 – $860
Fire risk 1/10 · Minimal
- Est. fire insurance / yr
- $784 – $1,456
Heat risk 3/10 · Minor
- Hot days now (above 98°F)
- 7 days/yr
- Hot days in 30 yrs
- 14 days/yr
Wind risk 2/10 · Minimal
- Chance of severe wind over 30 yrs
- —
Air-quality risk 3/10 · Minor
- Unhealthy air days now
- 2 days/yr
- Unhealthy air days in 30 yrs
- 5 days/yr
Risk factors via First Street. Map © Google.
Why this score? — see what drove the C+ grade
The composite is a weighted blend of 9 inputs, each scored 0–100. Each bar is that input's sub-score; the figure is the points it added to the 100-point composite (weight × sub-score).
- Cash flow +29.4/30.0
- 1% rule +10.0/10.0
- DSCR +10.0/10.0
- Livability +3.7/5.0
- Rent growth +3.3/5.0
- Condition / age +2.5/5.0
- Schools +1.3/10.0
- ARV discount +0.0/15.0
- Appreciation +0.0/10.0
$84,000
🖨 Deal sheet 📄 Offer letter ✓ Due diligence
Listing remarks MLS
Investors: Don't Miss Out on Tenant Occupied Bungalow This beautifully remodeled 3-bedroom, 1-bathroom bungalow is primed for your portfolio. Situated on a well-maintained block, the home boasts new doors, windows, fresh paint, and updated electrical and plumbing systems. Enjoy modern living with new light fixtures throughout, along with a newer hot water tank and furnace. The bathroom features stylish new tile and a contemporary vanity, while the kitchen shines with a tiled backsplash and brand-new countertops. This gem won't last long - reach out today to seize this opportunity! Currently rented at $1100 a month.
Key facts
- Updated electrical
- New doors
- Fresh paint
Tags
Property features AI
Exterior
- Parking: Detached 2-car garage
- Utilities: Public water; Public sewer
- Home design: Single-family residence; One and one-half stories; Ground-level entry with steps
- Construction: Vinyl siding construction; Asphalt roof
- Exterior features: Paved road access; Lot approximately 0.1 acres (40 x 110)
Interior
- Bathrooms: 1 full bathroom
- Heating & cooling: Forced air heating (natural gas); No cooling
- Interior features: 5 total rooms; Basement present
Neighborhood map
What this means for you Summary
Snapshot
- This is a 3-bed/1.0-bath single-family listed at $84k.
Deal economics
- At list price, monthly cash flow is $298 ($4k/yr) — positive.
- The deal already cash-flows at list — no discount required.
- Meets the 1% rule at list price ($1k rent vs $84k).
Location & tenants
- Location reads 73/100 on livability (#218 in MI) — a middle-class / working-renter tenant base. Strengths: amenities A+, commute A+, cost of living A+; Watch: schools F, crime F, employment F.
- Detroit Public Schools Community District (urban): math 10% / reading 24% proficiency, ranked #499 of 540 in MI (top 92%) — low school quality limits family demand, transient renter base, plan for 1-2y turnover; 90% free/reduced lunch — lower-income household profile, screen leases tightly.
- Market conditions: Rents rising (+3.2%/yr); 283 active listings in the ZIP; 4 comparable units currently listed for rent nearby; rentals at typical pace (median 24d on market — plan ~3-4 weeks tenant-placement turnaround); lower-income renter base — watch delinquency; 2,639 units permitted in Wayne County in 2024 (1,216 in 5+ unit buildings).
- This rent runs 40% of the median local income ($39k/yr) — at the standard rent-burdened threshold; future hikes will face affordability resistance.
Forward outlook
- Local home prices are declining (-3.0%/yr); year-one equity from $581 of loan paydown is wiped out by about $3k of value loss. Plan a longer hold.
- Wayne County population projected at -17% by 2050 — secular population decline; favor cash flow + early exit over multi-decade hold.
- At projected returns (-3.0% appreciation + 3.2% rent growth), your $24k cash investment doubles in ~8 years — after that, you're playing with house money.
Negotiation context
- Only 13 days on market — expect competitive offers; lowballing is unlikely to land.
- 12 sale attempts since 7y ago with the ask held roughly flat each time — persistent listings suggest the price (not the market) is what's stuck; bring a comps-based counter.
Risks & watch-outs
- Watch-outs: property tax is 3.8% of price; built in 1947 — expect roof / HVAC / electrical / plumbing capex.
Questions for the listing agent
- Built in 1947 — when were the roof, HVAC, electrical panel, plumbing, and water heater last replaced?
- Property tax is high relative to price — has the assessment been appealed recently, and will the sale trigger a re-assessment?
- Is there a deadline driving the sale (1031 exchange, divorce, estate, relocation)? That informs how much negotiation room exists.
- Schools are F-rated, which usually means shorter tenancies and higher turnover. Who's the typical renter profile here, and what's been the actual vacancy rate?
- Crime grade is F in this area — have there been break-ins, vandalism, or insurance claims at this property in the last 3 years? What carrier currently insures it and at what premium?
- What's the average days-on-market for RENTAL listings here right now (not sales)? A rising rental-DOM trend means longer vacancies and softer asking-rent achievability than the comps imply.
- What's the recent tenant-quality profile in this submarket — average credit score on applications, eviction rate, late-payment / NSF rate, and stable-employment percentage? A property-management company in the area should have these aggregated.
- How much new for-sale + rental construction is in the pipeline within 1–3 miles? Heavy new supply typically softens prices + rents 12–24 months out; constrained supply supports both.
Investment metrics
- 1% rule
- 1.57% ✓
- Cap rate
- 10.55%
- Cash-on-cash
- 15.20%
- DSCR
- 1.68
- GRM
- 5.3
CMA / ARV
- ARV (on-the-fly)
- $70,983
- Comps found
- 12
Show comp detail 12 sales within ~0.75 mi
| Address | Dist | Beds/Ba | Sqft | Sold | Price | $/sf | Match |
|---|---|---|---|---|---|---|---|
| 17227 Curtis St | 0.00mi | 3/1.0 | 717 (0%) | 2mo | $77,000 | $107 | 98 |
| 18262 Gilchrist St | 0.09mi | 2/1.0 (-1) | 728 (+2%) | 8mo | $55,000 | $76 | 81 |
| 18247 Harlow St | 0.18mi | 2/1.0 (-1) | 728 (+2%) | 10mo | $90,000 | $124 | 76 |
| 18410 Forrer St | 0.57mi | 3/1.0 | 689 (-4%) | 2mo | $60,000 | $87 | 65 |
| 19307 Fenmore St | 0.71mi | 2/1.0 (-1) | 725 (+1%) | 3mo | $72,500 | $100 | 58 |
| 18950 Biltmore St | 0.46mi | 2/1.0 (-1) | 781 (+9%) | 1mo | $46,000 | $59 | 58 |
| 19195 Fenmore St | 0.67mi | 2/1.0 (-1) | 720 (+0%) | 8mo | $79,500 | $110 | 57 |
| 7648 Outer Dr | 0.22mi | 2/1.0 (-1) | 808 (+13%) | 14mo | $80,000 | $99 | 52 |
| 18416 Curtis St | 0.53mi | 3/1.0 | 820 (+14%) | 5mo | $72,500 | $88 | 47 |
| 19213 Ashton Ave | 0.74mi | 2/1.0 (-1) | 710 (-1%) | 15mo | $32,000 | $45 | 46 |
| 17706 Stahelin Ave | 0.72mi | 3/1.0 | 818 (+14%) | 0mo | $106,000 | $130 | 43 |
| 18509 Prevost St | 0.51mi | 2/1.0 (-1) | 793 (+11%) | 13mo | $32,500 | $41 | 42 |
Match score weights: distance 35% · size 25% · config 20% · recency 20%. Top-matched comps best support the ARV.
Projected returns pro-forma
-3.0% appreciation · 3.25% rent growth · sell at horizon
- IRR
- 6.3%
- Equity multiple
- 1.25×
- Total profit
- $5,819
- Equity at exit
- $12,525
- IRR
- 16.0%
- Equity multiple
- 2.33×
- Total profit
- $31,356
- Equity at exit
- $7,263
Cash invested: $23,520 (down + closing). Projections, not guarantees.
Landlord ↔ Tenant lean methodology
- Overall (STATE)
- 62 Landlord-Friendly
- State Michigan
- 62 Landlord-Friendly · EVEN
- County
- — inherits STATE
- City
- — inherits STATE
ZIP-level market 48235
- Rents YoY
- 3.2%
- Active inventory
- 283
- Price-to-rent
- 5.3×
Monthly cashflow live
- Estimated rent
- $1,315 medium interval (Pro) →
- Mortgage (P&I)
- −$441
- Tax from tax record
- −$265 /mo · $3,182/yr
- Insurance
- −$35
- HOA
- −$0
- Vacancy / Maint / Mgmt
- −$276
- Net cashflow
- $298
Break-even live
UW: 25.0% down · 7.5% · 30yr · 1.5% tax · 5.0% vac · 8.0% maint · 8.0% mgmt
Financing live
Cash to close
- Down payment
- $21,000
- Closing costs
- $2,520
- Reserves months
- —
- Total cash needed
- —
Loan-product check · same deal, 3 products live
Conventional
25% down · 7.5% · 30yr
- Down + closing
- —
- Monthly P&I
- —
- Monthly cashflow
- —
- DSCR
- —
- Eligible?
- —
Personal DTI + credit; lowest rate.
DSCR
20% down · 8.5% · 30yr
- Down + closing
- —
- Monthly P&I
- —
- Monthly cashflow
- —
- DSCR
- —
- Eligible?
- —
No personal income docs; deal must DSCR.
Hard money
10% down · 12.0% · 12mo
- Down + closing
- —
- Monthly P&I
- —
- Monthly cashflow
- —
- DSCR
- —
- Eligible?
- —
Short-term bridge; refi at stabilization.
Rent comps 4 comps
| Address | Beds | Baths | Sqft | Rent | $/sqft | DOM | Units | Dist |
|---|---|---|---|---|---|---|---|---|
| 18276 Oakfield St Detroit, MI | 2.0 | 1.0 | 726 | $1,175 | $1.62 | 43d | 1 | 0.11mi |
| 19736 Gilchrist St Detroit, MI | 2.0 | 1.0 | 696 | $995 | $1.43 | 12d | 1 | 0.91mi |
| 19372 Grandville Ave Detroit, MI | 2.0 | 1.5 | 733 | $1,050 | $1.43 | 14d | 1 | 1.20mi |
| 20068 Faust Ave Detroit, MI | 2.0 | 1.0 | 750 | $1,100 | $1.47 | 24d | 1 | 1.30mi |
Listing history 10 events
-
2026-06-18days on market $84,000 Active 13 DOM
-
2026-06-17days on market $84,000 Active 12 DOM
-
2026-06-16days on market $84,000 Active 11 DOM
-
2026-06-15days on market $84,000 Active 10 DOM
-
2026-06-13days on market $84,000 Active 8 DOM
-
2026-06-13days on market $84,000 Active 7 DOM
-
2026-06-09days on market $84,000 Active 4 DOM
-
2026-06-08days on market $84,000 Active 3 DOM
-
2026-06-07remarks 621-char remark
-
2026-06-07$84,000 Active 2 DOM
ⓘ Source: listings_history table (triggers on properties + properties_extension) + one-shot
backfill from property_details.listing_events for pre-trigger history.
Tax reassessment forecast MI · Partial reset (capped growth)
- Current annual tax
- $3,182 · $265/mo
- Projected year-2 tax
- $3,182 · $265/mo
- Expected delta
- $0/yr ($0/mo · 0.0%)
ⓘ Screening estimate from a state-policy table — verify with the county assessor before closing.
Climate risk First Street
- Flood 1/10 Low FEMA zone X (unshaded) · 0% chance over 30 yrs
- Wildfire 1/10 Low
- Heat 3/10 Moderate 7 d/yr ≥98°F today · 14 d/yr by 30 yrs out
- Wind 2/10 Low
- Air quality 3/10 Moderate 2 unhealthy d/yr today · 5 by 30 yrs out
Nearby sold comps map
Loading sold comps map…
Walkable amenities ~0.75 mi
Loading nearby amenities…
Taxation est. · year 1
- Rental income
- $15,778
- − Mortgage interest
- −$4,705
- − Property taxes
- −$3,182
- − Insurance
- −$420
- − Repairs & maintenance
- −$1,262
- − Management
- −$1,262
- − Depreciation
- −$2,444
- Taxable income
- $2,502
- Est. tax owed @ 24.0%
- −$601
- After-tax cash flow
- $2,976/yr
For passive investors: Depreciation is non-cash, so a rental often shows a tax loss while cash-flowing — sheltering income. Rental losses are passive: they offset passive income freely, and up to $25,000/yr can offset ordinary (W-2) income if you actively participate and your MAGI is under $100k (phasing out to $0 by $150k); unused losses carry forward. On sale, claimed depreciation is recaptured at up to 25%, and gains may owe capital-gains tax (a 1031 exchange can defer both). Figures are a year-1 estimate at your 24.0% rate — not tax advice; consult a CPA.
Schools (NCES district)
- District
- Detroit Public Schools Community District
- NCES district ID
- 2601103
- Math proficiency
- 10% ▼ -2.00%
- Reading proficiency
- 24% ▲ 6.00%
- Median HH income
- $25,815
- Composite
- 13.06/100
- National rank
- #9564
- State rank
- #499 of 540 in MI
Livability — Detroit
- Score
- 73/100
- State rank
- #218
- US rank
- #5427
Category grades
Schools grade is shown separately in the Schools card above.
Census & demographics
- Census place
- Detroit, MI
- County
- Wayne County · 1,562,939 people
- City population
- 572,865
- Metro
- Detroit-Warren-Dearborn, MI
- Population (ZIP)
- 45,600
- Household income
- $39,265
- Rent vs Own
- Severe rent burden
- 3064.0
Population outlook (Wayne County) Hauer SSP2
- Today (2025)
- 1,675,273 people
- By 2030
- 1,620,300 · -3.3%
- By 2040
- 1,502,341 · -10.3%
- By 2050
- 1,384,039 · -17.4%
- By 2075
- 1,124,592 · -32.9%
- By 2100
- 881,193 · -47.4%
Race, ethnicity, and origin ACS 2023
- Neighborhood character
- Predominantly Black (94%)
- Race & ethnicity
- Black 94% White 3% Two or more races 2% Hispanic / Latino 1%
- Foreign-born
- 1% · Canada
- Languages at home
- 98% English-only · Spanish 1%
Political lean MEDSL · Wayne
- 2024 margin
- Strong D (+29.0) · D 62.7% · R 33.7% · Other 3.6%
- 2008→2024 swing
- -20.5pp toward R · 2008: 49.5pp · 2024: 29.0pp
- All cycles
- 2024: D+29.0 2020: D+38.1 2016: D+37.3 2012: D+46.9 2008: D+49.5
Not yet ingested
- Civics
- —
Market trends
- HPI YoY
- ▼ -153.02%
- Current HPI
- 263.6326
- Rent YoY
- ▲ 3.25%
- Metro
- Detroit-Warren-Dearborn, MI
- State GDP YoY
- ▲ 1.37%
- F500 in state
- 28
Industry mix (Fortune 500 HQ in MI)
| Industry | F500 HQs | Revenue |
|---|---|---|
| Automotive Parts | 3 | $48B |
|
||
| Automotive | 2 | $372B |
|
||
| Chemicals | 1 | $45B |
|
||
| Automotive Retail | 1 | $29B |
|
||
| Healthcare / Medical Devices | 1 | $23B |
|
||
| Automotive Technology | 1 | $20B |
|
||
Price history
+34.4% since first listed44 events — show timeline
- 2026-06-05 Listed $84,000 MiRealSource-MiMLS
- 2026-06-05 Listed $84,000 REALCOMP
- 2026-04-17 Sold (MLS) $77,000 REALCOMP
- 2026-04-17 Sold (MLS) $77,000 MiRealSource-MiMLS
- 2026-04-17 Sold (MLS) $77,000 SW Michigan MLS
- 2026-04-07 Pending — REALCOMP
- 2026-04-07 Pending — MiRealSource-MiMLS
- 2026-04-07 Pending — SW Michigan MLS
- 2026-03-31 Relisted — REALCOMP
- 2026-03-27 Listing Removed — REALCOMP
- 2026-03-17 Price Changed $85,000 MiRealSource-MiMLS
- 2026-03-17 Relisted — REALCOMP
- 2026-03-17 Price Changed $85,000 REALCOMP
- 2026-03-17 Relisted — MiRealSource-MiMLS
- 2026-03-17 Price Changed $85,000 SW Michigan MLS
- 2026-03-17 Relisted — SW Michigan MLS
- 2026-02-12 Listing Removed — SW Michigan MLS
- 2026-02-12 Listing Removed — MiRealSource-MiMLS
- 2026-02-10 Price Changed $89,000 MiRealSource-MiMLS
- 2026-02-09 Price Changed $89,000 REALCOMP
- 2026-02-09 Price Changed $89,000 SW Michigan MLS
- 2025-10-23 Price Changed $90,000 MiRealSource-MiMLS
- 2025-10-23 Price Changed $90,000 REALCOMP
- 2025-10-23 Price Changed $90,000 SW Michigan MLS
- 2025-09-27 Price Changed $93,000 MiRealSource-MiMLS
- 2025-09-26 Price Changed $93,000 REALCOMP
- 2025-09-26 Price Changed $93,000 SW Michigan MLS
- 2025-08-13 Listed $93,500 REALCOMP
- 2025-08-13 Listed $93,500 MiRealSource-MiMLS
- 2025-08-13 Listed $93,500 SW Michigan MLS
- 2021-03-22 Sold (Public Records) $64,500 Public Records
- 2019-12-06 Pending — REALCOMP
- 2019-12-05 Sold (Public Records) $52,500 Public Records
- 2019-12-03 Listing Removed — REALCOMP
- 2019-11-22 Sold (MLS) $52,500 MiRealSource-MiMLS
- 2019-11-22 Sold (MLS) $52,500 REALCOMP
- 2019-10-25 Pending — MiRealSource-MiMLS
- 2019-10-25 Pending — REALCOMP
- 2019-10-23 Relisted — REALCOMP
- 2019-10-15 Listing Removed — REALCOMP
- 2019-10-02 Price Changed $58,000 MiRealSource-MiMLS
- 2019-10-02 Price Changed $58,000 REALCOMP
- 2019-09-26 Listed $62,500 MiRealSource-MiMLS
- 2019-09-26 Listed $62,500 REALCOMP
Property tax history
+11.0%/yrLatest (2025): $3,182 · -1.9% YoY. Source: county tax records.
Cash-flow waterfall
monthlySold comps — $/sqft
last 12 mo · ≤1 miLoading sold comps…