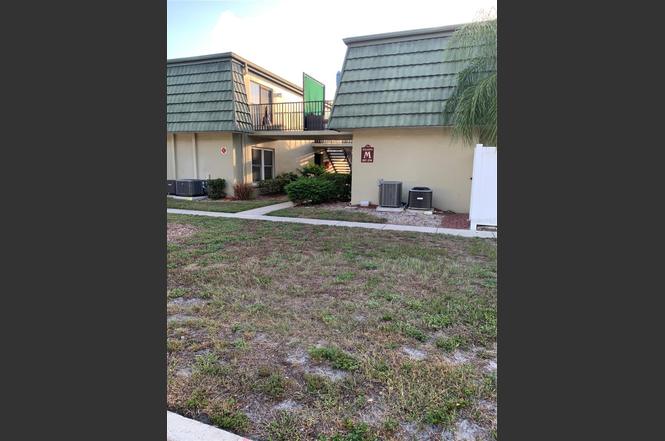
1799 N Highland Ave #170 · Clearwater, FL
Flood risk 1/10 · Minimal
- FEMA flood zone
- X (unshaded)
- Chance of flooding over 30 yrs
- 0.0%
- Est. flood insurance / yr
- $507 – $1,088
Fire risk 1/10 · Minimal
- Est. fire insurance / yr
- $947 – $1,759
Heat risk 10/10 · Severe
- Hot days now (above 107°F)
- 7 days/yr
- Hot days in 30 yrs
- 27 days/yr
Wind risk 10/10 · Severe
- Chance of severe wind over 30 yrs
- 99.0%
Air-quality risk 3/10 · Minor
- Unhealthy air days now
- 2 days/yr
- Unhealthy air days in 30 yrs
- 3 days/yr
Risk factors via First Street. Map © Google.
Why this score? — see what drove the D grade
The composite is a weighted blend of 9 inputs, each scored 0–100. Each bar is that input's sub-score; the figure is the points it added to the 100-point composite (weight × sub-score).
- Cash flow +12.3/30.0
- 1% rule +8.1/10.0
- ARV discount +7.5/15.0
- Schools +4.3/10.0
- Livability +4.1/5.0
- DSCR +3.7/10.0
- Condition / age +2.5/5.0
- Rent growth +2.0/5.0
- Appreciation +0.0/10.0
$124,900
🖨 Deal sheet (PDF) 📄 Offer letter ✓ Due diligence
Listing remarks
HELLO! NEW PRICE REDUCTION! COME AND FIND OUT MORE. .. PRICE REDUCTION. .. No Flood Zone. GREAT LOCATION! LIGHT and BRIGHT UNIT! Live where convenience meets coastal beauty. Hello!!! Nature enthusiasts, beach lovers will enjoy relaxing walks along the sandy warm beaches at your convenience located a short driving distance from this condo community. Looking for shelling experience to enjoy will be found in the nearby State Parks easily reachable offering great natural settings of their own as you will discover. Hello!!! This unit is a Second Floor unit located on the east side of the community offering natural lighting, low maintenance, charming condo located in a well maintained community w
Key facts
- Natural lighting
- Upgraded flooring
- Community amenities
Tags
Property features AI
Finance
- Financial info: Total annual fees: $5,417.04; Lease restrictions apply
- HOA & community: Monthly HOA fee: $451.42 (includes pool, maintenance - structure and grounds, management, pest control, sewer, trash, water); Association name: Colette Ciliberti; Association fee requirement: Required; Community amenities: Clubhouse, fitness center, pool, sidewalks, street lights, association-owned recreation; Buyer approval required; Deed restrictions; Pets allowed with restrictions (cats OK, dogs OK, breed restrictions apply)
Exterior
- Parking: Asphalt road access
- Utilities: Electricity available and connected; Water available and connected; Public sewer (available and connected)
- Home design: Attached condominium; West-facing; Two-story building; unit on second floor; Entry level: One
- Construction: Block and stucco construction; Built-up roof; Slab/other foundation; Building M
- Exterior features: Balcony; Exterior lighting; Rain gutters; Sidewalk; Sliding doors; Other exterior features
Interior
- Kitchen: Dishwasher; Range; Range hood; Refrigerator
- Bedrooms: 2 bedrooms (one located on the second floor of building M)
- Flooring: Concrete; Tile
- Bathrooms: 1 full bath; 1 half bath
- Heating & cooling: Central heating (electric); Central air conditioning
- Interior features: Ceiling fans; Living room/dining room combo; Thermostat
- Laundry & utility: Laundry: Other
Neighborhood map
What this means for you Summary
Snapshot
- This is a 2-bed/1.5-bath condo listed at $125k.
Deal economics
- At list price, monthly cash flow is $-22 ($-263/yr) — negative.
- To cash-flow at today's rent, offer at most $122k (2.5% below list).
- Meets the 1% rule at list price ($2k rent vs $125k).
- Recommended offer: $110k (12.0% below list) — sets the bar for market timing.
- Cap rate 6.1% vs local median 2.9% in Clearwater — top-decile yield for the area; either an underpriced asset or a hidden risk that comps aren't pricing in. Stress-test before assuming the spread holds.
Location & tenants
- Location reads 82/100 on livability (#60 in FL, #988 nationally) — a professional / high-income tenant draw. Strengths: commute A+, housing A+, health & safety A+; Watch: employment C-.
- Pinellas (suburban): math 51% / reading 51% proficiency, ranked #31 of 73 in FL (top 42%) — acceptable for families but not a draw, mixed tenant base, ~2y average lease.
- Zoned schools: Sandy Lane Elementary School (math 32% / reading 22%, grade F, #1,969 of 2,144 statewide, top 94%, 304 students, 85% FRL); Dunedin Highland Middle School (math 53% / reading 52%, grade C+, #213 of 571 statewide, top 38%, 899 students, 53% FRL); Dunedin High School (math 36% / reading 45%, grade F, #294 of 667 statewide, top 44%, 1,203 students, 48% FRL).
- Market conditions: Rents soft (-2.2%/yr); 265 active listings in the ZIP; 40 comparable units currently listed for rent nearby; rentals at typical pace (median 20d on market — plan ~3-4 weeks tenant-placement turnaround); 2,676 units permitted in Pinellas County in 2024 (1,422 in 5+ unit buildings).
- This rent runs 31% of the median local income ($63k/yr) — at the standard rent-burdened threshold; future hikes will face affordability resistance.
Forward outlook
- Local home prices are declining (-3.0%/yr); year-one equity from $864 of loan paydown is wiped out by about $4k of value loss. Plan a longer hold.
- Pinellas County population projected at +14% by 2050 — modest demand growth; plan on rents tracking national, not racing it.
Negotiation context
- It's been on market 354 days — a 12% lower offer ($110k) is reasonable based on typical stale-listing flexibility.
- 4 sale attempts since 3y ago; this cycle's ask has dropped $29k (19%) from the opening price — seller is motivated, your offer sets the floor, not the list.
- Current owner paid $64k; list at $125k implies a 95% gain — meaningful room to come down on a strong offer.
Risks & watch-outs
- Watch-outs: HOA is 28% of rent.
- Climate carrying-cost: severe wind risk, 99% chance of damaging wind over 30y; extreme-heat days projected 7→27/yr by 2055 (HVAC capex compounding) — expect insurance premiums to compound above CPI over the hold.
Questions for the listing agent
- What do current leases actually rent for vs. the listed asking? Can we see a recent rent roll and the last 12 months of T-12 income?
- It's been on market 354 days. Have you received any prior offers? Is the seller open to a 12% concession, seller financing, or rate buy-down credit?
- Built in 1971 — when were the roof, HVAC, electrical panel, plumbing, and water heater last replaced?
- What does the HOA fee cover, when was the last increase, and are there any pending special assessments or reserve-fund shortfalls?
- Any open or pending special assessments — roof, HVAC, plumbing, elevator, façade? What's the per-unit balance and payoff schedule, and is the seller paying it off at close or rolling it to the buyer?
- Why hasn't it sold? Are there any deal-killer items the seller is aware of (foundation, flood, title, zoning, code violations)?
- Is there a deadline driving the sale (1031 exchange, divorce, estate, relocation)? That informs how much negotiation room exists.
- The area grade is low — what's the realistic commute time and amenity access for the typical tenant pool here? Any planned neighborhood developments (good or bad) we should know about?
- What's the average days-on-market for RENTAL listings here right now (not sales)? A rising rental-DOM trend means longer vacancies and softer asking-rent achievability than the comps imply.
- What's the recent tenant-quality profile in this submarket — average credit score on applications, eviction rate, late-payment / NSF rate, and stable-employment percentage? A property-management company in the area should have these aggregated.
- How much new apartment / multifamily construction is in the pipeline within 1–3 miles? Heavy new supply (>2% of stock underway) typically softens rents 12–24 months out; light construction supports rent growth.
Investment metrics
- 1% rule
- 1.31% ✓
- Cap rate
- 6.08%
- Cash-on-cash
- -0.75%
- DSCR
- 0.97
- GRM
- 6.4
CMA / ARV
No comps found within radius.
Projected returns pro-forma
-3.0% appreciation · 0.0% rent growth · sell at horizon
- IRR
- -22.6%
- Equity multiple
- 0.25×
- Total profit
- $-26,129
- Equity at exit
- $18,623
- IRR
- -37.3%
- Equity multiple
- -0.20×
- Total profit
- $-41,851
- Equity at exit
- $10,799
Cash invested: $34,972 (down + closing). Projections, not guarantees.
Landlord ↔ Tenant lean methodology
- Overall (STATE)
- 87 Strongly Landlord-Friendly
- State Florida
- 87 Strongly Landlord-Friendly · R+3
- County
- — inherits STATE
- City
- — inherits STATE
ZIP-level market 33755
- Rents YoY
- -2.2%
- Active inventory
- 265
- Price-to-rent
- 6.4×
Monthly cashflow live
- Estimated rent
- $1,636 high interval (Pro) →
- Mortgage (P&I)
- −$655
- Tax est. 1.5%
- −$156 /mo · $1,874/yr
- Insurance
- −$52
- HOA
- −$451
- Vacancy / Maint / Mgmt
- −$343
- Net cashflow
- $-22
Break-even live
Sensitivity live
| Price | -10% $64 | -5% $21 | +0% $-22 | +5% $-65 | +10% $-108 |
|---|---|---|---|---|---|
| Rent | -10% $-151 | -5% $-87 | +0% $-22 | +5% $43 | +10% $107 |
| Rate | -1.0pp $41 | -0.5pp $10 | base $-22 | +0.5pp $-54 | +1.0pp $-87 |
UW: 25.0% down · 7.5% · 30yr · 1.5% tax · 5.0% vac · 8.0% maint · 8.0% mgmt
Financing live
Cash to close
- Down payment
- $31,225
- Closing costs
- $3,747
- Reserves months
- —
- Total cash needed
- —
Loan-product check · same deal, 3 products live
Conventional
25% down · 7.5% · 30yr
- Down + closing
- —
- Monthly P&I
- —
- Monthly cashflow
- —
- DSCR
- —
- Eligible?
- —
Personal DTI + credit; lowest rate.
DSCR
20% down · 8.5% · 30yr
- Down + closing
- —
- Monthly P&I
- —
- Monthly cashflow
- —
- DSCR
- —
- Eligible?
- —
No personal income docs; deal must DSCR.
Hard money
10% down · 12.0% · 12mo
- Down + closing
- —
- Monthly P&I
- —
- Monthly cashflow
- —
- DSCR
- —
- Eligible?
- —
Short-term bridge; refi at stabilization.
Rent comps 40 comps
| Address | Beds | Baths | Sqft | Rent | $/sqft | DOM | Units | Dist |
|---|---|---|---|---|---|---|---|---|
| 1799 N Highland Ave #5 Clearwater, FL | 2.0 | 1.5 | 813 | $1,690 | $2.08 | 18d | 1 | 0.02mi |
| 1799 N Highland Ave #74 Clearwater, FL | 1.0 | 1.0 | 571 | $1,195 | $2.09 | 26d | 1 | 0.02mi |
| 1799 N Highland Ave #114 Clearwater, FL | 2.0 | 1.5 | 813 | $1,575 | $1.94 | 14d | 1 | 0.02mi |
| 1577 Greenlea Dr Clearwater, FL | 1.0 | 1.0 | 900 | $1,350 | $1.50 | 26d | 1 | 0.10mi |
| 1589 Greenlea Dr #3 Clearwater, FL | 1.0 | 1.0 | 777 | $1,350 | $1.74 | 20d | 1 | 0.15mi |
| 1406 N Saturn Ave Clearwater, FL | 2.0 | 2.0 | 1104 | $2,650 | $2.40 | 26d | 1 | 0.64mi |
| 1419 Aries Ln Unit 1423 Clearwater, FL | 2.0 | 1.0 | 1015 | $1,600 | $1.58 | 5d | 1 | 0.66mi |
| 1423 Aries Ln Unit 3 Clearwater, FL | 2.0 | 1.0 | 1015 | $1,600 | $1.58 | 6d | 1 | 0.67mi |
| 2035 Alpine Rd Apt 3 Clearwater, FL | 2.0 | 1.0 | 825 | $1,400 | $1.70 | 9d | 1 | 0.69mi |
| 2035 Alpine Rd Apt 3 Clearwater, FL | 2.0 | 1.0 | 825 | $1,500 | $1.82 | 26d | 1 | 0.69mi |
| 2035 Alpine Rd Clearwater, FL | 2.0 | 1.0 | 825 | $1,400 | $1.70 | 5d | 1 | 0.69mi |
| 2035 Alpine Rd Clearwater, FL | 2.0 | 1.0 | 825 | $1,500 | $1.82 | 6d | 1 | 0.69mi |
| 2035 Kings Hwy Clearwater, FL | 1.0–2.0 | 1.0–2.0 | 904 | $1,520 | $1.68 | 26d | 1 | 0.70mi |
| 2045 Alpine Rd Unit 1 Clearwater, FL | 2.0 | 1.5 | 983 | $1,675 | $1.70 | 6d | 1 | 0.71mi |
| 2045 Alpine Rd Unit 1 Clearwater, FL | 2.0 | 1.5 | 983 | $1,675 | $1.70 | 26d | 1 | 0.71mi |
| 2045 Alpine Rd Apt 3 Clearwater, FL | 2.0 | 1.0 | 825 | $1,400 | $1.70 | 26d | 1 | 0.71mi |
| 2045 Alpine Rd Clearwater, FL | 2.0 | 1.0 | 983 | $1,675 | $1.70 | 6d | 1 | 0.71mi |
| 1767 Leo Ln S Unit 104 Clearwater, FL | 1.0 | 1.0 | 710 | $1,395 | $1.96 | 5d | 1 | 0.73mi |
| 1731 Overbrook Ave Clearwater, FL | 2.0 | 1.0 | 702 | $1,245 | $1.77 | 26d | 1 | 0.74mi |
| 1302 Amble Ln Clearwater, FL | 2.0 | 2.0 | 1013 | $2,275 | $2.25 | 0d | 1 | 0.74mi |
| 1009 Pine Brook Dr Unit B Clearwater, FL | 2.0 | 2.0 | 1000 | $2,200 | $2.20 | 24d | 1 | 0.78mi |
| 1280 Bertland Way Clearwater, FL | 3.0 | 1.0 | 922 | $1,800 | $1.95 | 0d | 1 | 0.78mi |
| 2099 Kings Hwy #1 Clearwater, FL | 1.0 | 1.0 | 686 | $1,450 | $2.11 | 9d | 1 | 0.83mi |
| 1108 Amble Ln Unit 1110 Clearwater, FL | 2.0 | 1.0 | 850 | $1,650 | $1.94 | 20d | 1 | 0.86mi |
| 1820 Sunset Point Rd Clearwater, FL | 1.0–3.0 | 1.0–2.0 | 918 | $1,764 | $1.92 | 0d | 16 | 0.89mi |
| 1005 Egret Ct Dunedin, FL | 2.0 | 2.0 | 996 | $1,400 | $1.41 | 6d | 1 | 0.90mi |
| 1262 Woodlawn Ter Clearwater, FL | 2.0 | 1.0 | 1076 | $2,000 | $1.86 | 26d | 1 | 0.90mi |
| 662 Union St Unit 1A Dunedin, FL | 3.0 | 1.0 | 1100 | $1,749 | $1.59 | 24d | 1 | 0.92mi |
| 1922 Springtime Ave Clearwater, FL | 2.0 | 1.0 | 800 | $1,575 | $1.97 | 26d | 1 | 0.96mi |
| 1420 Oak Hill Dr #104 Dunedin, FL | 1.0 | 1.0 | 610 | $1,600 | $2.62 | 26d | 1 | 1.02mi |
| 1142 Sunset Point Rd Clearwater, FL | 2.0 | 1.0 | 650 | $1,518 | $2.33 | 4d | 6 | 1.03mi |
| 1109 1/2 Grant St Clearwater, FL | 2.0 | 1.0 | 550 | $1,295 | $2.35 | 21d | 1 | 1.12mi |
| 1109 Grant St Clearwater, FL | 2.0 | 1.0 | 550 | $1,295 | $2.35 | 6d | 1 | 1.12mi |
| 1102 Sunset Point Rd #2 Clearwater, FL | 1.0 | 1.0 | 700 | $1,377 | $1.97 | 26d | 1 | 1.13mi |
| 541 Roanoke St Dunedin, FL | 2.0 | 2.0 | 912 | $2,345 | $2.57 | 16d | 1 | 1.16mi |
| 509 N Saturn Ave Clearwater, FL | 2.0 | 1.0 | 800 | $1,850 | $2.31 | 22d | 1 | 1.16mi |
| 1003 West Ave Clearwater, FL | 2.0 | 1.0 | 800 | $1,195 | $1.49 | 4d | 4 | 1.19mi |
| 2070 Loma Linda Way N Clearwater, FL | 2.0 | 1.0 | 980 | $1,928 | $1.97 | 26d | 1 | 1.19mi |
| 631 N Keene Rd Unit S8 Clearwater, FL | 1.0 | 1.0 | 710 | $1,650 | $2.32 | 26d | 1 | 1.19mi |
| 2701 Dunedin Commons Pl Dunedin, FL | 1.0–2.0 | 1.0–2.0 | 932 | $3,250 | $3.49 | 0d | 13 | 1.19mi |
HOA detail condo
- Monthly dues
- $451 · $5,412/yr
- Assessments
- None detected in remarks — confirm with the listing agent.
Listing history 27 events
-
2026-06-22days on market $124,900 Active 354 DOM
-
2026-06-18days on market $124,900 Active 351 DOM
-
2026-06-17days on market $124,900 Active 350 DOM
-
2026-06-16days on market $124,900 Active 349 DOM
-
2026-06-15days on market $124,900 Active 348 DOM
-
2026-06-13pricedays on market $124,900 Active 346 DOM
-
2026-06-09days on market $135,000 Active 342 DOM
-
2026-06-08days on market $135,000 Active 341 DOM
-
2026-06-07days on market $135,000 Active 340 DOM
-
2026-06-04days on market $135,000 Active 337 DOM
-
2026-06-03days on market $135,000 Active 336 DOM
-
2026-06-01days on market $135,000 Active 334 DOM
-
2026-05-31days on market $135,000 Active 333 DOM
-
2026-05-19price $137,500
-
2026-05-02price $139,900
-
2026-04-12price $149,900
-
2025-07-02$153,800 Active
-
2025-02-07historical
-
2024-12-30status Active
-
2024-08-12status Active
-
2024-08-10historical
-
2024-02-15price $187,000
-
2024-02-15price $187,500
-
2023-08-11$187,900 Active
-
2004-05-13soldstatus $64,000
-
1998-08-05soldstatus $27,500
-
1988-08-18soldstatus $31,000
ⓘ Source: listings_history table (triggers on properties + properties_extension) + one-shot
backfill from property_details.listing_events for pre-trigger history.
Climate risk First Street
- Flood 1/10 Low FEMA zone X (unshaded) · 0% chance over 30 yrs
- Wildfire 1/10 Low
- Heat 10/10 Extreme 7 d/yr ≥107°F today · 27 d/yr by 30 yrs out
- Wind 10/10 Extreme 99% chance of damaging wind over 30 yrs
- Air quality 3/10 Moderate 2 unhealthy d/yr today · 3 by 30 yrs out
Nearby sold comps map
Loading sold comps map…
Walkable amenities ~0.75 mi
Loading nearby amenities…
Taxation est. · year 1
- Rental income
- $19,629
- − Mortgage interest
- −$6,996
- − Property taxes
- −$1,874
- − Insurance
- −$624
- − Repairs & maintenance
- −$1,570
- − Management
- −$1,570
- − HOA
- −$5,412
- − Depreciation
- −$3,633
- Taxable loss
- −$2,052
- Est. tax savings @ 24.0%
- +$492
- After-tax cash flow
- $229/yr
For passive investors: Depreciation is non-cash, so a rental often shows a tax loss while cash-flowing — sheltering income. Rental losses are passive: they offset passive income freely, and up to $25,000/yr can offset ordinary (W-2) income if you actively participate and your MAGI is under $100k (phasing out to $0 by $150k); unused losses carry forward. On sale, claimed depreciation is recaptured at up to 25%, and gains may owe capital-gains tax (a 1031 exchange can defer both). Figures are a year-1 estimate at your 24.0% rate — not tax advice; consult a CPA.
Schools (NCES district)
- District
- Pinellas
- NCES district ID
- 1201560
- Math proficiency
- 51% ▼ -5.00%
- Reading proficiency
- 51% ▼ -3.00%
- Median HH income
- $46,270
- Composite
- 43.27/100
- National rank
- #3046
- State rank
- #31 of 73 in FL
Livability — Clearwater
- Score
- 82/100
- State rank
- #60
- US rank
- #988
Category grades
Schools grade is shown separately in the Schools card above.
Census & demographics
- Census place
- Clearwater, FL
- County
- Pinellas County · 939,478 people
- City population
- 170,933
- Metro
- Tampa-St. Petersburg-Clearwater, FL
- Population (ZIP)
- 27,476
- Household income
- $62,886
- Rent vs Own
- Severe rent burden
- 1511.0
Population outlook (Pinellas County) Hauer SSP2
- Today (2025)
- 1,027,532 people
- By 2030
- 1,063,586 · +3.5%
- By 2040
- 1,125,020 · +9.5%
- By 2050
- 1,168,637 · +13.7%
- By 2075
- 1,265,188 · +23.1%
- By 2100
- 1,260,357 · +22.7%
Race, ethnicity, and origin ACS 2023
- Neighborhood character
- Diverse neighborhood (Simpson 0.63)
- Race & ethnicity
- White 54% Black 22% Hispanic / Latino 17% Two or more races 10% Asian 3%
- Hispanic origin (detail)
- Mexican 6% Puerto Rican 5% Cuban 1%
- Common ancestry
- Romanian 2% Italian 2% Arab 1%
- Foreign-born
- 15% · Canada
- Languages at home
- 78% English-only · Spanish 13% Other Indo-European 3% Russian/Polish/Slavic 2%
Political lean MEDSL · Pinellas
- 2024 margin
- Lean R (+5.2) · D 46.9% · R 52.1%
- 2008→2024 swing
- -13.5pp toward R · 2008: 8.3pp · 2024: -5.2pp
- All cycles
- 2024: R+5.2 2020: D+0.2 2016: R+1.1 2012: D+5.6 2008: D+8.3
Not yet ingested
- Civics
- —
Market trends
- HPI YoY
- ▼ -472.62%
- Current HPI
- 351.4973
- Rent YoY
- ▼ -2.20%
- Metro
- Tampa-St. Petersburg-Clearwater, FL
- State GDP YoY
- ▲ 3.28%
- F500 in state
- 36
Industry mix (Fortune 500 HQ in FL)
| Industry | F500 HQs | Revenue |
|---|---|---|
| Industrial Technology | 2 | $29B |
|
||
| Insurance | 2 | $17B |
|
||
| Retail | 1 | $60B |
|
||
| Technology Distribution | 1 | $58B |
|
||
| Homebuilding | 1 | $35B |
|
||
| Technology Manufacturing | 1 | $35B |
|
||
Price history
+343.5% since first listed14 events — show timeline
- 2026-05-19 Price Changed $137,500 Stellar MLS as Distributed by MLS Grid
- 2026-05-02 Price Changed $139,900 Stellar MLS as Distributed by MLS Grid
- 2026-04-12 Price Changed $149,900 Stellar MLS as Distributed by MLS Grid
- 2025-07-02 Listed $153,800 Stellar MLS as Distributed by MLS Grid
- 2025-02-07 Listing Removed — Stellar MLS as Distributed by MLS Grid
- 2024-12-30 Relisted — Stellar MLS as Distributed by MLS Grid
- 2024-08-12 Relisted — Stellar MLS as Distributed by MLS Grid
- 2024-08-10 Listing Removed — Stellar MLS as Distributed by MLS Grid
- 2024-02-15 Price Changed $187,000 Stellar MLS as Distributed by MLS Grid
- 2024-02-15 Price Changed $187,500 Stellar MLS as Distributed by MLS Grid
- 2023-08-11 Listed $187,900 Stellar MLS as Distributed by MLS Grid
- 2004-05-13 Sold (Public Records) $64,000 Public Records
- 1998-08-05 Sold (Public Records) $27,500 Public Records
- 1988-08-18 Sold (Public Records) $31,000 Public Records
Property tax history
-7.5%/yrLatest (2025): $216 · +12.4% YoY. Source: county tax records.
Cash-flow waterfall
monthlySold comps — $/sqft
last 12 mo · ≤1 miLoading sold comps…