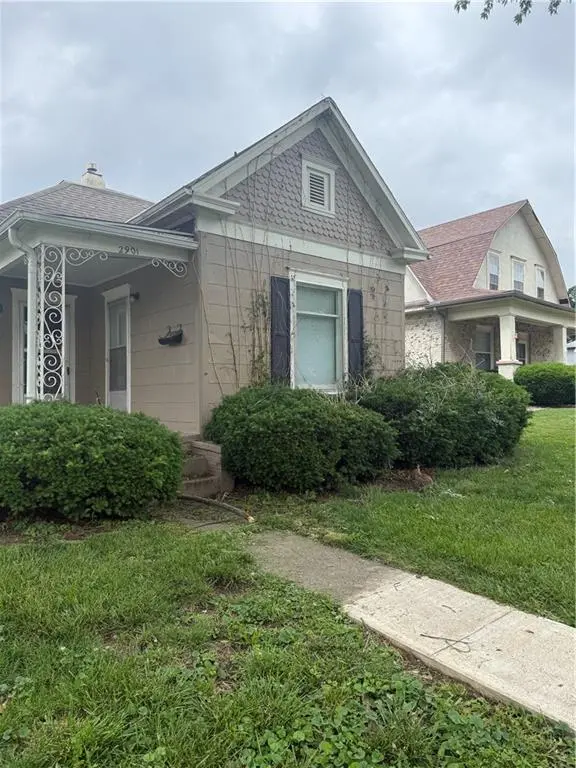
2901 Messanie St · St. Joseph, MO
Flood risk 1/10 · Minimal
- FEMA flood zone
- X
- Chance of flooding over 30 yrs
- 0.0%
- Est. flood insurance / yr
- $473 – $860
Fire risk 1/10 · Minimal
- Est. fire insurance / yr
- $1,054 – $1,958
Heat risk 4/10 · Minor
- Hot days now (above 106°F)
- 7 days/yr
- Hot days in 30 yrs
- 16 days/yr
Wind risk 2/10 · Minimal
- Chance of severe wind over 30 yrs
- —
Air-quality risk 2/10 · Minimal
- Unhealthy air days now
- 1 days/yr
- Unhealthy air days in 30 yrs
- 1 days/yr
Risk factors via First Street. Map © Google.
Why this score? — see what drove the B grade
The composite is a weighted blend of 9 inputs, each scored 0–100. Each bar is that input's sub-score; the figure is the points it added to the 100-point composite (weight × sub-score).
- Cash flow +28.1/30.0
- ARV discount +15.0/15.0
- DSCR +10.0/10.0
- 1% rule +6.7/10.0
- Schools +2.8/10.0
- Rent growth +2.5/5.0
- Livability +2.5/5.0
- Condition / age +2.5/5.0
- Appreciation +0.0/10.0
$85,000
🖨 Deal sheet 📄 Offer letter ✓ Due diligence
Listing remarks
East end location-Corner lot-Level floor plan-3 bedroom Home-Newer Carpet and Linoleum in Kitchen and Bath. Home has Forced air gas furnace, Newer central air and electric panel. Property being sold in As-Is Condition. Listing Broker and Executor of Trust are related and are Missouri licensed Real Estate Brokers in the State of Missouri and each hold an interest in the property. No rent to Own. No Owner finance, Must be a Conventional sale or Cash.
Key facts
- Level floor plan
- Newer carpet
- Electric panel
Tags
Property features AI
Finance
- HOA & community: No association fees
Exterior
- Parking: Off-street parking
- Utilities: Public water; Public sewer
- Home design: Single family residential; Residential property; Bungalow style; One-story (main level living)
- Construction: Brick/mortar construction; Composition roof
- Exterior features: Porch; City lot on a corner; Paved road access
Interior
- Kitchen: Refrigerator; Gas range
- Bedrooms: 3 bedrooms (all on main level)
- Flooring: Carpet; Vinyl
- Bathrooms: 1 full bathroom
- Heating & cooling: Baseboard heating; Natural gas heating; Forced air; Electric cooling
- Interior features: Partial basement; Bungalow floor plan; 6 total rooms
- Laundry & utility: Laundry located in kitchen on main level
Neighborhood map
What this means for you Summary
Snapshot
- This is a 3-bed/1.0-bath single-family listed at $85k.
Deal economics
- At list price, monthly cash flow is $266 ($3k/yr) — positive.
- The deal already cash-flows at list — no discount required.
- Meets the 1% rule at list price ($993 rent vs $85k).
- Cap rate 10.0% vs local median 4.7% in St. Joseph — top-decile yield for the area; either an underpriced asset or a hidden risk that comps aren't pricing in. Stress-test before assuming the spread holds.
Location & tenants
- Location reads: area grade B — affects rentability + tenant quality, not the cash-flow math above.
- St. Joseph (urban): math 28% / reading 38% proficiency, ranked #241 of 324 in MO (top 74%) — families likely to look elsewhere, expect single-tenant / working-renter base with shorter leases.
- Market conditions: 97 active listings in the ZIP; 9 comparable units currently listed for rent nearby; rentals lingering (median 44d on market — plan ~5-8 weeks vacancy on turnover, expect pricing pressure); 100% of comp listings sitting > 30 days — soft ceiling on asking rent; 70 units permitted in Buchanan County in 2024 (0 in 5+ unit buildings).
Forward outlook
- Local home prices are declining (-3.0%/yr); year-one equity from $588 of loan paydown is wiped out by about $3k of value loss. Plan a longer hold.
- Buchanan County population projected to shrink 6% by 2050 — rents likely to lag national; underwrite the cash flow, not the appreciation.
- At projected returns (-3.0% appreciation + 3.0% rent growth), your $24k cash investment doubles in ~9 years — after that, you're playing with house money.
Negotiation context
- Only 2 days on market — expect competitive offers; lowballing is unlikely to land.
- 3 sale attempts with the ask held roughly flat each time — persistent listings suggest the price (not the market) is what's stuck; bring a comps-based counter.
Risks & watch-outs
- Watch-outs: built in 1915 — expect roof / HVAC / electrical / plumbing capex.
Questions for the listing agent
- Built in 1915 — when were the roof, HVAC, electrical panel, plumbing, and water heater last replaced?
- Is there a deadline driving the sale (1031 exchange, divorce, estate, relocation)? That informs how much negotiation room exists.
- What's the average days-on-market for RENTAL listings here right now (not sales)? A rising rental-DOM trend means longer vacancies and softer asking-rent achievability than the comps imply.
- What's the recent tenant-quality profile in this submarket — average credit score on applications, eviction rate, late-payment / NSF rate, and stable-employment percentage? A property-management company in the area should have these aggregated.
- How much new for-sale + rental construction is in the pipeline within 1–3 miles? Heavy new supply typically softens prices + rents 12–24 months out; constrained supply supports both.
Investment metrics
- 1% rule
- 1.17% ✓
- Cap rate
- 10.05%
- Cash-on-cash
- 13.41%
- DSCR
- 1.60
- GRM
- 7.1
CMA / ARV
- ARV (on-the-fly)
- $140,220
- Comps found
- 12
Show comp detail 12 sales within ~0.75 mi
| Address | Dist | Beds/Ba | Sqft | Sold | Price | $/sf | Match |
|---|---|---|---|---|---|---|---|
| 2918 Seneca St | 0.39mi | 3/2.0 | 838 (-2%) | 0mo | $137,500 | $164 | 74 |
| 2829 Penn St | 0.43mi | 2/1.0 (-1) | 850 (-1%) | 2mo | $144,900 | $170 | 72 |
| 406 S 31st St | 0.23mi | 2/1.0 (-1) | 820 (-4%) | 7mo | $150,000 | $183 | 72 |
| 3114 Olive St | 0.41mi | 3/1.0 | 900 (+5%) | 1mo | $138,900 | $154 | 71 |
| 2831 Penn St | 0.43mi | 3/1.0 | 900 (+5%) | 4mo | $95,000 | $106 | 68 |
| 415 N 26th St | 0.59mi | 2/1.0 (-1) | 864 (+1%) | 2mo | $139,900 | $162 | 65 |
| 3022 Faraon St | 0.48mi | 2/1.0 (-1) | 780 (-9%) | 0mo | $130,000 | $167 | 58 |
| 2826 Faraon St | 0.43mi | 2/1.0 (-1) | 940 (+10%) | 3mo | $99,900 | $106 | 56 |
| 3215 Locust St | 0.44mi | 2/1.0 (-1) | 949 (+11%) | 1mo | $159,900 | $168 | 55 |
| 2234 Felix St | 0.64mi | 3/1.5 | 912 (+7%) | 3mo | $115,000 | $126 | 55 |
| 3134 Faraon St | 0.54mi | 2/1.0 (-1) | 760 (-11%) | 1mo | $142,000 | $187 | 50 |
| 3303 Messanie St | 0.50mi | 3/1.0 | 972 (+14%) | 7mo | $90,000 | $93 | 48 |
Match score weights: distance 35% · size 25% · config 20% · recency 20%. Top-matched comps best support the ARV.
Projected returns pro-forma
-3.0% appreciation · 3.0% rent growth · sell at horizon
- IRR
- 3.4%
- Equity multiple
- 1.13×
- Total profit
- $3,143
- Equity at exit
- $12,674
- IRR
- 12.9%
- Equity multiple
- 2.03×
- Total profit
- $24,443
- Equity at exit
- $7,349
Cash invested: $23,800 (down + closing). Projections, not guarantees.
Landlord ↔ Tenant lean methodology
- Overall (STATE)
- 81 Strongly Landlord-Friendly
- State Missouri
- 81 Strongly Landlord-Friendly · R+10
- County
- — inherits STATE
- City
- — inherits STATE
ZIP-level market 64501
- Active inventory
- 97
- Price-to-rent
- 7.1×
Monthly cashflow live
- Estimated rent
- $993 high interval (Pro) →
- Mortgage (P&I)
- −$446
- Tax from tax record
- −$37 /mo · $447/yr
- Insurance
- −$35
- HOA
- −$0
- Vacancy / Maint / Mgmt
- −$209
- Net cashflow
- $266
Break-even live
UW: 25.0% down · 7.5% · 30yr · 1.5% tax · 5.0% vac · 8.0% maint · 8.0% mgmt
Financing live
Cash to close
- Down payment
- $21,250
- Closing costs
- $2,550
- Reserves months
- —
- Total cash needed
- —
Loan-product check · same deal, 3 products live
Conventional
25% down · 7.5% · 30yr
- Down + closing
- —
- Monthly P&I
- —
- Monthly cashflow
- —
- DSCR
- —
- Eligible?
- —
Personal DTI + credit; lowest rate.
DSCR
20% down · 8.5% · 30yr
- Down + closing
- —
- Monthly P&I
- —
- Monthly cashflow
- —
- DSCR
- —
- Eligible?
- —
No personal income docs; deal must DSCR.
Hard money
10% down · 12.0% · 12mo
- Down + closing
- —
- Monthly P&I
- —
- Monthly cashflow
- —
- DSCR
- —
- Eligible?
- —
Short-term bridge; refi at stabilization.
Rent comps 9 comps
| Address | Beds | Baths | Sqft | Rent | $/sqft | DOM | Units | Dist |
|---|---|---|---|---|---|---|---|---|
| 3128 Midland St Saint Joseph, MO | 2.0 | 1.0 | 1104 | $975 | $0.88 | 43d | 1 | 0.30mi |
| 2408 Jules St Saint Joseph, MO | 2.0 | 1.0 | 1032 | $1,100 | $1.07 | 43d | 1 | 0.60mi |
| 425 N 25th St St Joseph, MO | 2.0 | 1.0 | 800 | $850 | $1.06 | 43d | 1 | 0.64mi |
| 917 N 24th St Unit 1 St Joseph, MO | 2.0 | 1.0 | 933 | $925 | $0.99 | 43d | 1 | 1.00mi |
| 2901 Frederick Ave Saint Joseph, MO | 2.0–3.0 | 1.0 | 900 | $1,000 | $1.11 | 43d | 1 | 1.05mi |
| 303 S 13th St St Joseph, MO | 3.0 | 1.5 | 1000 | $950 | $0.95 | 43d | 1 | 1.17mi |
| 1106 Olive St Saint Joseph, MO | 2.0 | 1.0 | 700 | $725 | $1.04 | 43d | 1 | 1.34mi |
| 201 S 10th St Saint Joseph, MO | 2.0 | 1.0 | 600 | $1,000 | $1.67 | 43d | 1 | 1.38mi |
| 1300 S 11th St Apt 22 St Joseph, MO | 2.0 | 1.0 | 866 | $998 | $1.15 | 43d | 1 | 1.44mi |
Listing history 7 events
-
2026-05-24$85,000 Active
-
2025-11-18historical
-
2025-05-23price $99,950
-
2025-04-13status Active
-
2025-04-09status Pending
-
2025-01-20$106,900 Active
-
2001-03-29soldstatus
ⓘ Source: listings_history table (triggers on properties + properties_extension) + one-shot
backfill from property_details.listing_events for pre-trigger history.
Tax reassessment forecast MO · Resets to sale price
- Current annual tax
- $447 · $37/mo
- Projected year-2 tax
- $824 · $69/mo
- Expected delta
- +$377/yr (+$31/mo · 84.3%)
ⓘ Screening estimate from a state-policy table — verify with the county assessor before closing.
Climate risk First Street
- Flood 1/10 Low FEMA zone X · 0% chance over 30 yrs
- Wildfire 1/10 Low
- Heat 4/10 Moderate 7 d/yr ≥106°F today · 16 d/yr by 30 yrs out
- Wind 2/10 Low
- Air quality 2/10 Low 1 unhealthy d/yr today · 1 by 30 yrs out
Nearby sold comps map
Loading sold comps map…
Walkable amenities ~0.75 mi
Loading nearby amenities…
Taxation est. · year 1
- Rental income
- $11,916
- − Mortgage interest
- −$4,761
- − Property taxes
- −$447
- − Insurance
- −$425
- − Repairs & maintenance
- −$953
- − Management
- −$953
- − Depreciation
- −$2,473
- Taxable income
- $1,903
- Est. tax owed @ 24.0%
- −$457
- After-tax cash flow
- $2,736/yr
For passive investors: Depreciation is non-cash, so a rental often shows a tax loss while cash-flowing — sheltering income. Rental losses are passive: they offset passive income freely, and up to $25,000/yr can offset ordinary (W-2) income if you actively participate and your MAGI is under $100k (phasing out to $0 by $150k); unused losses carry forward. On sale, claimed depreciation is recaptured at up to 25%, and gains may owe capital-gains tax (a 1031 exchange can defer both). Figures are a year-1 estimate at your 24.0% rate — not tax advice; consult a CPA.
Schools (NCES district)
- District
- St. Joseph
- NCES district ID
- 2927060
- Math proficiency
- 28% ▼ -6.00%
- Reading proficiency
- 38% ▼ -1.00%
- Median HH income
- $43,007
- Composite
- 27.99/100
- National rank
- #6853
- State rank
- #241 of 324 in MO
Livability — St. Joseph
No livability data for this city. (Only ~50 U.S. cities are tracked.)
Census & demographics
- Census place
- St. Joseph, MO
- County
- Buchanan County · 32,150 people
- City population
- 44,382
- Metro
- St. Joseph, MO-KS
- Population (ZIP)
- 10,689
- Household income
- $46,731
- Rent vs Own
- Severe rent burden
- 721.0
Population outlook (Buchanan County) Hauer SSP2
- Today (2025)
- 89,041 people
- By 2030
- 88,401 · -0.7%
- By 2040
- 86,220 · -3.2%
- By 2050
- 83,603 · -6.1%
- By 2075
- 76,750 · -13.8%
- By 2100
- 67,623 · -24.1%
Race, ethnicity, and origin ACS 2023
- Neighborhood character
- Predominantly White (69%)
- Race & ethnicity
- White 69% Black 12% Hispanic / Latino 11% Two or more races 9%
- Hispanic origin (detail)
- Mexican 6% Puerto Rican 1%
- Common ancestry
- Italian 3% Romanian 1% Slovak 1%
- Foreign-born
- 7% · Canada, China
- Languages at home
- 89% English-only · Spanish 7% Arabic 1%
Political lean MEDSL · Buchanan
- 2024 margin
- Strong R (+28.0) · D 35.2% · R 63.3% · Other 1.5%
- 2008→2024 swing
- -28.2pp toward R · 2008: 0.1pp · 2024: -28.0pp
- All cycles
- 2024: R+28.0 2020: R+24.6 2016: R+26.2 2012: R+8.7 2008: D+0.1
Not yet ingested
- Civics
- —
Market trends
- HPI YoY
- ▼ -150.20%
- Current HPI
- 157.8706
- Rent YoY
- —
- Metro
- St. Joseph, MO-KS
- State GDP YoY
- ▲ 1.84%
- F500 in state
- 20
Industry mix (Fortune 500 HQ in MO)
| Industry | F500 HQs | Revenue |
|---|---|---|
| Healthcare | 1 | $163B |
|
||
| Insurance | 1 | $21B |
|
||
| Industrial Technology | 1 | $17B |
|
||
| Retail | 1 | $16B |
|
||
| Industrial Distribution | 1 | $10B |
|
||
| Utilities | 1 | $9B |
|
||
Price history
-20.5% since first listed7 events — show timeline
- 2026-05-24 Listed $85,000 Heartland MLS as Distributed by MLS Grid
- 2025-11-18 Listing Removed — Heartland MLS as Distributed by MLS Grid
- 2025-05-23 Price Changed $99,950 Heartland MLS as Distributed by MLS Grid
- 2025-04-13 Relisted — Heartland MLS as Distributed by MLS Grid
- 2025-04-09 Pending — Heartland MLS as Distributed by MLS Grid
- 2025-01-20 Listed $106,900 Heartland MLS as Distributed by MLS Grid
- 2001-03-29 Sold (Public Records) — Public Records
Property tax history
+2.3%/yrLatest (2025): $447 · +17.8% YoY. Source: county tax records.
Cash-flow waterfall
monthlySold comps — $/sqft
last 12 mo · ≤1 miLoading sold comps…