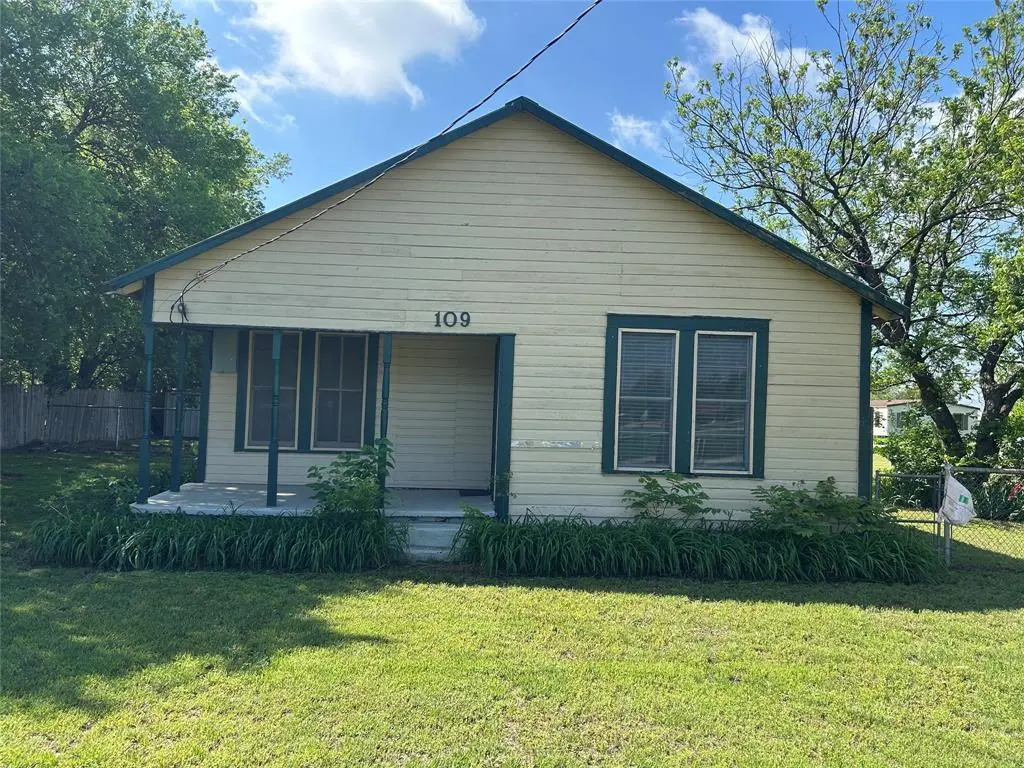
109 Harrison Ave · Newcastle, TX
Flood risk 1/10 · Minimal
- FEMA flood zone
- X (unshaded)
- Chance of flooding over 30 yrs
- 0.0%
- Est. flood insurance / yr
- $507 – $1,088
Fire risk 8/10 · Major
- Est. fire insurance / yr
- $1,222 – $2,270
Heat risk 7/10 · Major
- Hot days now (above 109°F)
- 7 days/yr
- Hot days in 30 yrs
- 21 days/yr
Wind risk 4/10 · Minor
- Chance of severe wind over 30 yrs
- 14.0%
Air-quality risk 1/10 · Minimal
- Unhealthy air days now
- 0 days/yr
- Unhealthy air days in 30 yrs
- 0 days/yr
Risk factors via First Street. Map © Google.
Why this score? — see what drove the A- grade
The composite is a weighted blend of 9 inputs, each scored 0–100. Each bar is that input's sub-score; the figure is the points it added to the 100-point composite (weight × sub-score).
- Cash flow +30.0/30.0
- ARV discount +15.0/15.0
- 1% rule +10.0/10.0
- DSCR +10.0/10.0
- Appreciation +5.4/10.0
- Schools +4.4/10.0
- Livability +3.0/5.0
- Rent growth +2.5/5.0
- Condition / age +2.5/5.0
$59,000
🖨 Deal sheet 📄 Offer letter ✓ Due diligence
Listing remarks MLS
2 bedroom and 1 bathroom fixer upper that needs some TLC. An opportunity to purchase a home that needs some updating and repairs at an affordable price. Has a metal roof and small shed for extra storage. Large lot with lots of potential. Sold AS IS. This property targets an investor or cash buyer who can handle the renovations needed.
Key facts
- Metal roof
- Small shed
- Large lot
Tags
Neighborhood map
What this means for you Summary
Snapshot
- This is a 3-bed/1.0-bath single-family listed at $59k.
Deal economics
- At list price, monthly cash flow is $399 ($5k/yr) — positive.
- The deal already cash-flows at list — no discount required.
- Meets the 1% rule at list price ($988 rent vs $59k).
- Recommended offer: $55k (6.0% below list) — sets the bar for market timing.
Location & tenants
- Location reads 59/100 on livability (#1,162 in TX) — a working-class tenant base; expect higher turnover. Strengths: cost of living A+, housing A+; Watch: health & safety C-, schools D, crime F.
- Newcastle ISD (rural): math 55% / reading 45% proficiency, ranked #389 of 1,141 in TX (top 34%) — acceptable for families but not a draw, mixed tenant base, ~2y average lease.
- Market conditions: 10 active listings in the ZIP; 5 units permitted in Young County in 2024 (0 in 5+ unit buildings).
Forward outlook
- In year one you build about $889 of equity ($408 loan paydown + $481 appreciation (0.8% local appreciation)).
- Young County population projected to shrink 7% by 2050 — rents likely to lag national; underwrite the cash flow, not the appreciation.
- At projected returns (0.8% appreciation + 3.0% rent growth), your $17k cash investment doubles in ~3 years — after that, you're playing with house money.
Negotiation context
- It's been on market 62 days — a 6% lower offer ($55k) is reasonable based on typical stale-listing flexibility.
Risks & watch-outs
- Watch-outs: built in 1930 — expect roof / HVAC / electrical / plumbing capex.
- Climate carrying-cost: severe wildfire risk; extreme-heat days projected 7→21/yr by 2055 (HVAC capex compounding) — expect insurance premiums to compound above CPI over the hold.
Questions for the listing agent
- It's been on market 62 days. Have you received any prior offers? Is the seller open to a 6% concession, seller financing, or rate buy-down credit?
- Built in 1930 — when were the roof, HVAC, electrical panel, plumbing, and water heater last replaced?
- Why hasn't it sold? Are there any deal-killer items the seller is aware of (foundation, flood, title, zoning, code violations)?
- Is there a deadline driving the sale (1031 exchange, divorce, estate, relocation)? That informs how much negotiation room exists.
- Schools are D-rated, which usually means shorter tenancies and higher turnover. Who's the typical renter profile here, and what's been the actual vacancy rate?
- Crime grade is F in this area — have there been break-ins, vandalism, or insurance claims at this property in the last 3 years? What carrier currently insures it and at what premium?
- What's the average days-on-market for RENTAL listings here right now (not sales)? A rising rental-DOM trend means longer vacancies and softer asking-rent achievability than the comps imply.
- What's the recent tenant-quality profile in this submarket — average credit score on applications, eviction rate, late-payment / NSF rate, and stable-employment percentage? A property-management company in the area should have these aggregated.
- How much new for-sale + rental construction is in the pipeline within 1–3 miles? Heavy new supply typically softens prices + rents 12–24 months out; constrained supply supports both.
Investment metrics
- 1% rule
- 1.67% ✓
- Cap rate
- 14.40%
- Cash-on-cash
- 28.96%
- DSCR
- 2.29
- GRM
- 5.0
CMA / ARV
- ARV (median comp)
- $90,016
- List price
- $59,000
- Delta
- -34.46%
- Verdict
- UNDERPRICED
- Comps
- 2 within 1.0 mi
Show comp detail 1 sale within ~0.75 mi
| Address | Dist | Beds/Ba | Sqft | Sold | Price | $/sf | Match |
|---|---|---|---|---|---|---|---|
| 100 Broadway Ave | 0.12mi | 3/2.0 | 1,004 (+6%) | 13mo | $72,500 | $72 | 71 |
Match score weights: distance 35% · size 25% · config 20% · recency 20%. Top-matched comps best support the ARV.
Projected returns pro-forma
0.82% appreciation · 3.0% rent growth · sell at horizon
- IRR
- 30.9%
- Equity multiple
- 2.57×
- Total profit
- $25,965
- Equity at exit
- $19,576
- IRR
- 33.6%
- Equity multiple
- 4.98×
- Total profit
- $65,734
- Equity at exit
- $25,584
Cash invested: $16,520 (down + closing). Projections, not guarantees.
Landlord ↔ Tenant lean methodology
- Overall (STATE)
- 87 Strongly Landlord-Friendly
- State Texas
- 87 Strongly Landlord-Friendly · R+5
- County
- — inherits STATE
- City
- — inherits STATE
ZIP-level market 76372
- Home prices YoY
- 0.6%
- Active inventory
- 10
- Price-to-rent
- 5.0×
Monthly cashflow live
- Estimated rent
- $988 medium interval (Pro) →
- Mortgage (P&I)
- −$309
- Tax from tax record
- −$48 /mo · $572/yr
- Insurance
- −$25
- HOA
- −$0
- Vacancy / Maint / Mgmt
- −$207
- Net cashflow
- $399
Break-even live
UW: 25.0% down · 7.5% · 30yr · 1.5% tax · 5.0% vac · 8.0% maint · 8.0% mgmt
Financing live
Cash to close
- Down payment
- $14,750
- Closing costs
- $1,770
- Reserves months
- —
- Total cash needed
- —
Loan-product check · same deal, 3 products live
Conventional
25% down · 7.5% · 30yr
- Down + closing
- —
- Monthly P&I
- —
- Monthly cashflow
- —
- DSCR
- —
- Eligible?
- —
Personal DTI + credit; lowest rate.
DSCR
20% down · 8.5% · 30yr
- Down + closing
- —
- Monthly P&I
- —
- Monthly cashflow
- —
- DSCR
- —
- Eligible?
- —
No personal income docs; deal must DSCR.
Hard money
10% down · 12.0% · 12mo
- Down + closing
- —
- Monthly P&I
- —
- Monthly cashflow
- —
- DSCR
- —
- Eligible?
- —
Short-term bridge; refi at stabilization.
Listing history 18 events
-
2026-06-18days on market $59,000 Active 62 DOM
-
2026-06-17days on market $59,000 Active 61 DOM
-
2026-06-16days on market $59,000 Active 60 DOM
-
2026-06-15days on market $59,000 Active 59 DOM
-
2026-06-15days on market $59,000 Active 58 DOM
-
2026-06-13days on market $59,000 Active 57 DOM
-
2026-06-12days on market $59,000 Active 56 DOM
-
2026-06-10days on market $59,000 Active 53 DOM
-
2026-06-08days on market $59,000 Active 52 DOM
-
2026-06-08days on market $59,000 Active 51 DOM
-
2026-06-05days on market $59,000 Active 49 DOM
-
2026-06-03days on market $59,000 Active 47 DOM
-
2026-06-02days on market $59,000 Active 46 DOM
-
2026-06-01days on market $59,000 Active 45 DOM
-
2026-05-31days on market $59,000 Active 44 DOM
-
2026-04-17$59,000 Active 341-char remark
Show marketing remark (341 chars)
2 bedroom and 1 bathroom fixer upper that needs some TLC. An opportunity to purchase a home that needs some updating and repairs at an affordable price. Has a metal roof and small shed for extra storage. Large lot with lots of potential. Sold AS IS. This property targets an investor or cash buyer who can handle the renovations needed.
-
2004-12-13soldstatus
-
2002-11-22soldstatus
ⓘ Source: listings_history table (triggers on properties + properties_extension) + one-shot
backfill from property_details.listing_events for pre-trigger history.
Tax reassessment forecast TX · Resets to sale price
- Current annual tax
- $572 · $48/mo
- Projected year-2 tax
- $1,080 · $90/mo
- Expected delta
- +$507/yr (+$42/mo · 88.6%)
ⓘ Screening estimate from a state-policy table — verify with the county assessor before closing.
Climate risk First Street
- Flood 1/10 Low FEMA zone X (unshaded) · 0% chance over 30 yrs
- Wildfire 8/10 Severe
- Heat 7/10 Severe 7 d/yr ≥109°F today · 21 d/yr by 30 yrs out
- Wind 4/10 Moderate 14% chance of damaging wind over 30 yrs
- Air quality 1/10 Low 0 unhealthy d/yr today · 0 by 30 yrs out
Nearby sold comps map
Loading sold comps map…
Walkable amenities ~0.75 mi
Loading nearby amenities…
Taxation est. · year 1
- Rental income
- $11,854
- − Mortgage interest
- −$3,305
- − Property taxes
- −$572
- − Insurance
- −$295
- − Repairs & maintenance
- −$948
- − Management
- −$948
- − Depreciation
- −$1,716
- Taxable income
- $4,069
- Est. tax owed @ 24.0%
- −$976
- After-tax cash flow
- $3,808/yr
For passive investors: Depreciation is non-cash, so a rental often shows a tax loss while cash-flowing — sheltering income. Rental losses are passive: they offset passive income freely, and up to $25,000/yr can offset ordinary (W-2) income if you actively participate and your MAGI is under $100k (phasing out to $0 by $150k); unused losses carry forward. On sale, claimed depreciation is recaptured at up to 25%, and gains may owe capital-gains tax (a 1031 exchange can defer both). Figures are a year-1 estimate at your 24.0% rate — not tax advice; consult a CPA.
Schools (NCES district)
- District
- Newcastle ISD
- NCES district ID
- 4832700
- Math proficiency
- 55% ▲ 10.00%
- Reading proficiency
- 45% ▬ 0.00%
- Median HH income
- $40,623
- Composite
- 43.93/100
- National rank
- #6284
- State rank
- #389 of 1141 in TX
Livability — Newcastle
- Score
- 59/100
- State rank
- #1162
- US rank
- #20307
Category grades
Schools grade is shown separately in the Schools card above.
Census & demographics
- Census place
- Newcastle, TX
- Population (ZIP)
- 1,024
Population outlook (Young County) Hauer SSP2
- Today (2025)
- 17,860 people
- By 2030
- 17,620 · -1.3%
- By 2040
- 17,054 · -4.5%
- By 2050
- 16,551 · -7.3%
- By 2075
- 15,667 · -12.3%
- By 2100
- 14,066 · -21.2%
Race, ethnicity, and origin ACS 2023
- Neighborhood character
- Predominantly White (87%)
- Race & ethnicity
- White 87% Hispanic / Latino 8% Two or more races 6%
- Hispanic origin (detail)
- Mexican 7%
- Common ancestry
- Serbian 3% Slovak 2% Lithuanian 1%
- Foreign-born
- 3% · Canada
- Languages at home
- 94% English-only · Spanish 5%
Political lean MEDSL · Young
- 2024 margin
- Solid R (+76.2) · D 11.6% · R 87.8%
- 2008→2024 swing
- -12.8pp toward R · 2008: -63.5pp · 2024: -76.2pp
- All cycles
- 2024: R+76.2 2020: R+73.8 2016: R+74.6 2012: R+71.5 2008: R+63.5
Not yet ingested
- Civics
- —
Market trends
- HPI YoY
- ▲ 0.82%
- Current HPI
- 140.2425
- Rent YoY
- —
- Metro
- —
- State GDP YoY
- ▲ 3.95%
- F500 in state
- 110
Industry mix (Fortune 500 HQ in TX)
| Industry | F500 HQs | Revenue |
|---|---|---|
| Energy | 16 | $1,198B |
|
||
| Technology | 5 | $198B |
|
||
| Engineering / Construction | 4 | $72B |
|
||
| Energy Services | 3 | $60B |
|
||
| Utilities | 3 | $41B |
|
||
| Healthcare | 2 | $330B |
|
||
Price history
3 events — show timeline
- 2026-04-17 Listed $59,000 NTREIS
- 2004-12-13 Sold (Public Records) — Public Records
- 2002-11-22 Sold (Public Records) — Public Records
Property tax history
+9.1%/yrLatest (2025): $572 · +3.9% YoY. Source: county tax records.
Cash-flow waterfall
monthlySold comps — $/sqft
last 12 mo · ≤1 miLoading sold comps…