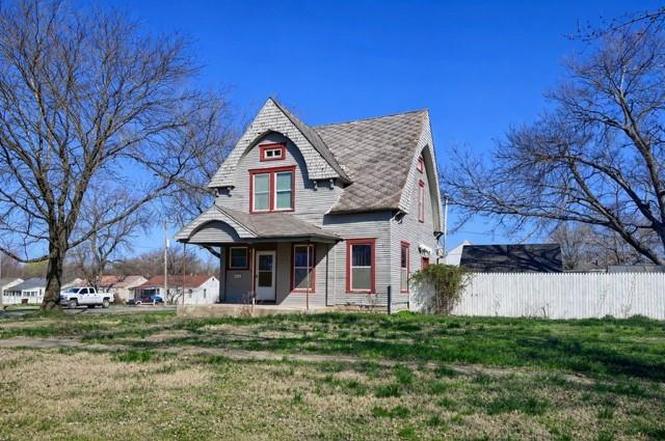
802 Sycamore St · Humboldt, KS
Flood risk 1/10 · Minimal
- FEMA flood zone
- X (unshaded)
- Chance of flooding over 30 yrs
- 0.0%
- Est. flood insurance / yr
- $507 – $1,088
Fire risk 2/10 · Minimal
- Est. fire insurance / yr
- $1,154 – $2,142
Heat risk 5/10 · Moderate
- Hot days now (above 108°F)
- 7 days/yr
- Hot days in 30 yrs
- 19 days/yr
Wind risk 2/10 · Minimal
- Chance of severe wind over 30 yrs
- 1.0%
Air-quality risk 2/10 · Minimal
- Unhealthy air days now
- 1 days/yr
- Unhealthy air days in 30 yrs
- 1 days/yr
Risk factors via First Street. Map © Google.
Why this score? — see what drove the D grade
The composite is a weighted blend of 9 inputs, each scored 0–100. Each bar is that input's sub-score; the figure is the points it added to the 100-point composite (weight × sub-score).
- Cash flow +17.1/30.0
- Appreciation +7.2/10.0
- DSCR +5.3/10.0
- 1% rule +4.6/10.0
- Livability +3.6/5.0
- Rent growth +2.5/5.0
- Condition / age +2.5/5.0
- Schools +2.0/10.0
- ARV discount +0.0/15.0
$119,900
🖨 Deal sheet 📄 Offer letter ✓ Due diligence
Key facts
- Detached shop
- Privacy fenced yard
- Corner lot
Tags
Property features AI
Finance
- Other: Not in a flood plain
- HOA & community: No association fees
Exterior
- Parking: Other parking type
- Utilities: Public water; Public sewer
- Home design: Single-family residential home; South-facing; Two stories; Living area approximately 1,408 (above grade finished area)
- Construction: Frame construction; Other roof type; Originally built 101 years ago or more
- Exterior features: Privacy fencing; Paved public road access
Interior
- Bedrooms: Three bedrooms on the second floor
- Bathrooms: Two full bathrooms (one on the first floor, one on the second floor)
- Heating & cooling: Natural gas heating; Electric cooling (central cooling present)
- Interior features: Crawl space basement; Two-story floor plan; Five total rooms
- Laundry & utility: Laundry located on the lower level
Neighborhood map
What this means for you Summary
Snapshot
- This is a 3-bed/1.5-bath single-family listed at $120k.
Deal economics
- At list price, monthly cash flow is $84 ($1k/yr) — positive.
- The deal already cash-flows at list — no discount required.
- To meet the 1% rule (rent ≥ 1% of price), the offer needs to be $116k (3.6% below list).
- Recommended offer: $109k (9.0% below list) — sets the bar for market timing.
Location & tenants
- Location reads 72/100 on livability (#112 in KS) — a middle-class / working-renter tenant base. Strengths: cost of living A+, housing A+, health & safety A+; Watch: employment D, schools D-, amenities F.
- Humboldt (rural): math 18% / reading 29% proficiency, ranked #148 of 169 in KS (top 88%) — low school quality limits family demand, transient renter base, plan for 1-2y turnover.
- Market conditions: 11 active listings in the ZIP; 18 units permitted in Allen County in 2024 (0 in 5+ unit buildings).
Forward outlook
- In year one you build about $6k of equity ($829 loan paydown + $5k appreciation (4.5% local appreciation)).
- Allen County population projected at -21% by 2050 — secular population decline; favor cash flow + early exit over multi-decade hold.
- At projected returns (4.5% appreciation + 3.0% rent growth), your $34k cash investment doubles in ~5 years — after that, you're playing with house money.
- By year 6, paydown + projected appreciation supports a ~$33k cash-out refi (75% LTV) — recoverable capital for the next deal without selling this one.
Negotiation context
- It's been on market 101 days — a 9% lower offer ($109k) is reasonable based on typical stale-listing flexibility.
- Current owner paid $18k; list at $120k implies a 585% gain — meaningful room to come down on a strong offer.
Risks & watch-outs
- Watch-outs: built in 1890 — expect roof / HVAC / electrical / plumbing capex.
- Climate carrying-cost: extreme-heat days projected 7→19/yr by 2055 (HVAC capex compounding) — expect insurance premiums to compound above CPI over the hold.
Questions for the listing agent
- It's been on market 101 days. Have you received any prior offers? Is the seller open to a 9% concession, seller financing, or rate buy-down credit?
- Built in 1890 — when were the roof, HVAC, electrical panel, plumbing, and water heater last replaced?
- Why hasn't it sold? Are there any deal-killer items the seller is aware of (foundation, flood, title, zoning, code violations)?
- Is there a deadline driving the sale (1031 exchange, divorce, estate, relocation)? That informs how much negotiation room exists.
- Schools are D-rated, which usually means shorter tenancies and higher turnover. Who's the typical renter profile here, and what's been the actual vacancy rate?
- The area grade is low — what's the realistic commute time and amenity access for the typical tenant pool here? Any planned neighborhood developments (good or bad) we should know about?
- What's the average days-on-market for RENTAL listings here right now (not sales)? A rising rental-DOM trend means longer vacancies and softer asking-rent achievability than the comps imply.
- What's the recent tenant-quality profile in this submarket — average credit score on applications, eviction rate, late-payment / NSF rate, and stable-employment percentage? A property-management company in the area should have these aggregated.
- How much new for-sale + rental construction is in the pipeline within 1–3 miles? Heavy new supply typically softens prices + rents 12–24 months out; constrained supply supports both.
Investment metrics
- 1% rule
- 0.96% ✗
- Cap rate
- 7.14%
- Cash-on-cash
- 3.01%
- DSCR
- 1.13
- GRM
- 8.6
CMA / ARV
- ARV (on-the-fly)
- $95,268
- Comps found
- 11
Show comp detail 11 sales within ~0.75 mi
| Address | Dist | Beds/Ba | Sqft | Sold | Price | $/sf | Match |
|---|---|---|---|---|---|---|---|
| 923 Cherokee St | 0.19mi | 3/2.0 | 1,386 (-1%) | 1mo | $179,000 | $129 | 87 |
| 809 S 9th St | 0.18mi | 3/1.0 | 1,384 (-1%) | 20mo | $53,000 | $38 | 71 |
| 1022 Sycamore St | 0.19mi | 4/1.0 (+1) | 1,456 (+4%) | 10mo | $30,500 | $21 | 69 |
| 120 S 3rd St | 0.46mi | 3/1.0 | 1,479 (+6%) | 2mo | $99,999 | $68 | 66 |
| 1214 Bridge N/A | 0.26mi | 2/1.0 (-1) | 1,320 (-6%) | 16mo | $29,900 | $23 | 58 |
| 414 S 3rd St | 0.40mi | 3/1.0 | 1,459 (+4%) | 20mo | $145,000 | $99 | 56 |
| 913 Sycamore St | 0.10mi | 2/1.0 (-1) | 1,222 (-13%) | 16mo | $99,900 | $82 | 54 |
| 720 N 8th St | 0.73mi | 2/2.0 (-1) | 1,421 (+1%) | 4mo | $147,000 | $103 | 53 |
| 1220 Osage St | 0.50mi | 3/1.0 | 1,474 (+5%) | 16mo | $75,000 | $51 | 52 |
| 922 Pecan St | 0.13mi | 4/2.0 (+1) | 1,577 (+13%) | 21mo | $155,000 | $98 | 48 |
| 214 Central St | 0.60mi | 2/1.5 (-1) | 1,505 (+7%) | 10mo | $87,500 | $58 | 47 |
Match score weights: distance 35% · size 25% · config 20% · recency 20%. Top-matched comps best support the ARV.
Projected returns pro-forma
4.48% appreciation · 3.0% rent growth · sell at horizon
- IRR
- 14.2%
- Equity multiple
- 1.88×
- Total profit
- $29,476
- Equity at exit
- $64,173
- IRR
- 15.1%
- Equity multiple
- 3.57×
- Total profit
- $86,301
- Equity at exit
- $107,754
Cash invested: $33,572 (down + closing). Projections, not guarantees.
Landlord ↔ Tenant lean methodology
- Overall (STATE)
- 83 Strongly Landlord-Friendly
- State Kansas
- 83 Strongly Landlord-Friendly · R+10
- County
- — inherits STATE
- City
- — inherits STATE
ZIP-level market 66748
- Home prices YoY
- 2.5%
- Active inventory
- 11
- Price-to-rent
- 8.6×
Monthly cashflow live
- Estimated rent
- $1,156 medium interval (Pro) →
- Mortgage (P&I)
- −$629
- Tax est. 1.5%
- −$150 /mo · $1,798/yr
- Insurance
- −$50
- HOA
- −$0
- Vacancy / Maint / Mgmt
- −$243
- Net cashflow
- $84
Break-even live
UW: 25.0% down · 7.5% · 30yr · 1.5% tax · 5.0% vac · 8.0% maint · 8.0% mgmt
Financing live
Cash to close
- Down payment
- $29,975
- Closing costs
- $3,597
- Reserves months
- —
- Total cash needed
- —
Loan-product check · same deal, 3 products live
Conventional
25% down · 7.5% · 30yr
- Down + closing
- —
- Monthly P&I
- —
- Monthly cashflow
- —
- DSCR
- —
- Eligible?
- —
Personal DTI + credit; lowest rate.
DSCR
20% down · 8.5% · 30yr
- Down + closing
- —
- Monthly P&I
- —
- Monthly cashflow
- —
- DSCR
- —
- Eligible?
- —
No personal income docs; deal must DSCR.
Hard money
10% down · 12.0% · 12mo
- Down + closing
- —
- Monthly P&I
- —
- Monthly cashflow
- —
- DSCR
- —
- Eligible?
- —
Short-term bridge; refi at stabilization.
Listing history 19 events
-
2026-06-18days on market $119,900 Active 101 DOM
-
2026-06-17days on market $119,900 Active 100 DOM
-
2026-06-16days on market $119,900 Active 99 DOM
-
2026-06-15days on market $119,900 Active 98 DOM
-
2026-06-13days on market $119,900 Active 96 DOM
-
2026-06-12days on market $119,900 Active 95 DOM
-
2026-06-09days on market $119,900 Active 92 DOM
-
2026-06-08days on market $119,900 Active 91 DOM
-
2026-06-07days on market $119,900 Active 90 DOM
-
2026-06-05days on market $119,900 Active 88 DOM
-
2026-06-04days on market $119,900 Active 86 DOM
-
2026-06-02days on market $119,900 Active 85 DOM
-
2026-06-01days on market $119,900 Active 84 DOM
-
2026-05-31days on market $119,900 Active 83 DOM
-
2026-05-31days on market $119,900 Active 82 DOM
-
2026-05-04price $119,900
-
2026-03-09$129,900 Active
-
2020-02-24soldstatus
-
1993-06-01soldstatus $17,500
ⓘ Source: listings_history table (triggers on properties + properties_extension) + one-shot
backfill from property_details.listing_events for pre-trigger history.
Climate risk First Street
- Flood 1/10 Low FEMA zone X (unshaded) · 0% chance over 30 yrs
- Wildfire 2/10 Low
- Heat 5/10 Major 7 d/yr ≥108°F today · 19 d/yr by 30 yrs out
- Wind 2/10 Low 100% chance of damaging wind over 30 yrs
- Air quality 2/10 Low 1 unhealthy d/yr today · 1 by 30 yrs out
Nearby sold comps map
Loading sold comps map…
Walkable amenities ~0.75 mi
Loading nearby amenities…
Taxation est. · year 1
- Rental income
- $13,867
- − Mortgage interest
- −$6,716
- − Property taxes
- −$1,798
- − Insurance
- −$600
- − Repairs & maintenance
- −$1,109
- − Management
- −$1,109
- − Depreciation
- −$3,488
- Taxable loss
- −$954
- Est. tax savings @ 24.0%
- +$229
- After-tax cash flow
- $1,241/yr
For passive investors: Depreciation is non-cash, so a rental often shows a tax loss while cash-flowing — sheltering income. Rental losses are passive: they offset passive income freely, and up to $25,000/yr can offset ordinary (W-2) income if you actively participate and your MAGI is under $100k (phasing out to $0 by $150k); unused losses carry forward. On sale, claimed depreciation is recaptured at up to 25%, and gains may owe capital-gains tax (a 1031 exchange can defer both). Figures are a year-1 estimate at your 24.0% rate — not tax advice; consult a CPA.
Schools (NCES district)
- District
- Humboldt
- NCES district ID
- 2007590
- Math proficiency
- 18% ▼ -6.00%
- Reading proficiency
- 29% ▼ -11.00%
- Median HH income
- $43,599
- Composite
- 20.16/100
- National rank
- #8634
- State rank
- #148 of 169 in KS
Livability — Humboldt
- Score
- 72/100
- State rank
- #112
- US rank
- #6241
Category grades
Schools grade is shown separately in the Schools card above.
Census & demographics
- Census place
- Humboldt, KS
- Population (ZIP)
- 2,864
Population outlook (Allen County) Hauer SSP2
- Today (2025)
- 11,885 people
- By 2030
- 11,352 · -4.5%
- By 2040
- 10,285 · -13.5%
- By 2050
- 9,342 · -21.4%
- By 2075
- 7,482 · -37.0%
- By 2100
- 5,871 · -50.6%
Race, ethnicity, and origin ACS 2023
- Neighborhood character
- Predominantly White (92%)
- Race & ethnicity
- White 92% Hispanic / Latino 4% Two or more races 2% Asian 2% Pacific Islander 1%
- Common ancestry
- Italian 4% Slovak 2% Serbian 2%
- Foreign-born
- 1% · China, Canada
- Languages at home
- 97% English-only · Chinese 2%
Political lean MEDSL · Allen
- 2024 margin
- Solid R (+46.1) · D 25.8% · R 72.0% · Other 2.2%
- 2008→2024 swing
- -22.9pp toward R · 2008: -23.3pp · 2024: -46.1pp
- All cycles
- 2024: R+46.1 2020: R+44.4 2016: R+41.0 2012: R+27.2 2008: R+23.3
Not yet ingested
- Civics
- —
Market trends
- HPI YoY
- ▲ 4.48%
- Current HPI
- 180.3616
- Rent YoY
- —
- Metro
- —
- State GDP YoY
- —
- F500 in state
- 0
Price history
+585.1% since first listed4 events — show timeline
- 2026-05-04 Price Changed $119,900 Heartland MLS as Distributed by MLS Grid
- 2026-03-09 Listed $129,900 Heartland MLS as Distributed by MLS Grid
- 2020-02-24 Sold (Public Records) — Public Records
- 1993-06-01 Sold (Public Records) $17,500 Public Records
Cash-flow waterfall
monthlySold comps — $/sqft
last 12 mo · ≤1 miLoading sold comps…