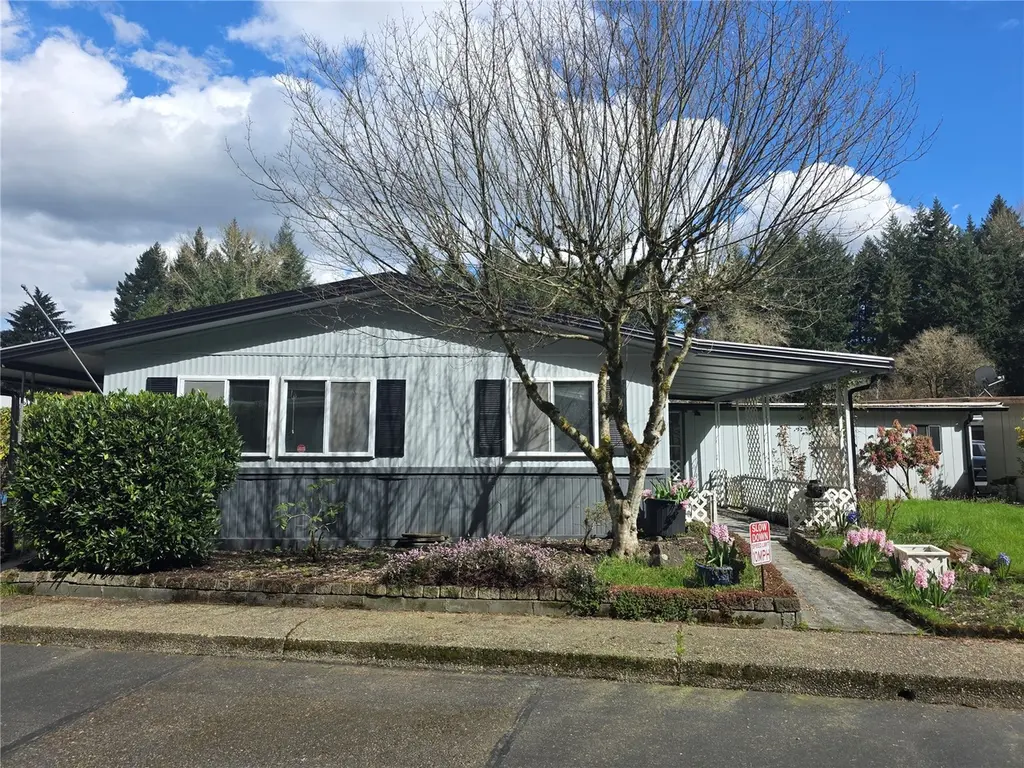
1841 Trosper Rd SW #53 · Tumwater, WA
Flood risk 1/10 · Minimal
- FEMA flood zone
- X (unshaded)
- Chance of flooding over 30 yrs
- 0.0%
- Est. flood insurance / yr
- $507 – $1,088
Fire risk 1/10 · Minimal
- Est. fire insurance / yr
- $604 – $1,122
Heat risk 3/10 · Minor
- Hot days now (above 88°F)
- 7 days/yr
- Hot days in 30 yrs
- 14 days/yr
Wind risk 1/10 · Minimal
- Chance of severe wind over 30 yrs
- —
Air-quality risk 6/10 · Moderate
- Unhealthy air days now
- 7 days/yr
- Unhealthy air days in 30 yrs
- 8 days/yr
Risk factors via First Street. Map © Google.
Why this score? — see what drove the B grade
The composite is a weighted blend of 9 inputs, each scored 0–100. Each bar is that input's sub-score; the figure is the points it added to the 100-point composite (weight × sub-score).
- Cash flow +30.0/30.0
- 1% rule +10.0/10.0
- DSCR +10.0/10.0
- ARV discount +7.5/15.0
- Schools +5.6/10.0
- Livability +4.2/5.0
- Rent growth +3.1/5.0
- Condition / age +2.5/5.0
- Appreciation +0.0/10.0
$79,950
🖨 Deal sheet 📄 Offer letter ✓ Due diligence
Listing remarks
UPDATED! MODERN LOOK, READY TO MOVE-IN, 3 bedroom, 2 bath, located in quite 55+ Western Plaza Community Mobile Home Park. New Exterior and Interior Paint, New Laminate Floor (water proof) Kitchen update with Cabinet Painted, New Countertop, New Sink, New Refrigerator, Gas Stove and Dishwasher. New Gas Furnace just installed, Living room with small cozy Gas Woodstove. 2 Car Carport with Storage Shop, Easy to Freeway, Close to Shopping Center and all other services.
Key facts
- Kitchen update
- New countertop
- New sink
Tags
Neighborhood map
What this means for you Summary
Snapshot
- This is a 3-bed/2.0-bath manufactured listed at $80k.
Deal economics
- At list price, monthly cash flow is $1k ($15k/yr) — positive.
- The deal already cash-flows at list — no discount required.
- Meets the 1% rule at list price ($2k rent vs $80k).
- Recommended offer: $75k (6.0% below list) — sets the bar for market timing.
- Cap rate 25.5% vs local median 2.7% in Tumwater — top-decile yield for the area; either an underpriced asset or a hidden risk that comps aren't pricing in. Stress-test before assuming the spread holds.
Location & tenants
- Location reads 84/100 on livability (#39 in WA, #700 nationally) — a professional / high-income tenant draw. Strengths: commute A+, housing A+, health & safety A+; Watch: amenities D, cost of living D-.
- Tumwater School District (urban): math 57% / reading 69% proficiency, ranked #37 of 291 in WA (top 13%) — acceptable for families but not a draw, mixed tenant base, ~2y average lease.
- Market conditions: Rents rising (+2.3%/yr); 233 active listings in the ZIP; 19 comparable units currently listed for rent nearby; rentals at typical pace (median 21d on market — plan ~3-4 weeks tenant-placement turnaround); solid renter incomes; 1,222 units permitted in Thurston County in 2024 (508 in 5+ unit buildings).
Forward outlook
- Local home prices are declining (-3.0%/yr); year-one equity from $552 of loan paydown is wiped out by about $2k of value loss. Plan a longer hold.
- Thurston County population projected at +27% by 2050 — long-run rental-demand tailwind backs the buy-and-hold thesis.
- At projected returns (-3.0% appreciation + 2.3% rent growth), your $22k cash investment doubles in ~2 years — after that, you're playing with house money.
Negotiation context
- It's been on market 79 days — a 6% lower offer ($75k) is reasonable based on typical stale-listing flexibility.
- 2 sale attempts since 15y ago; this cycle's ask has dropped $20k (20%) from the opening price — seller is motivated, your offer sets the floor, not the list.
- Current owner paid $11k; list at $80k implies a 627% gain — meaningful room to come down on a strong offer.
Questions for the listing agent
- It's been on market 79 days. Have you received any prior offers? Is the seller open to a 6% concession, seller financing, or rate buy-down credit?
- Built in 1975 — when were the roof, HVAC, electrical panel, plumbing, and water heater last replaced?
- Why hasn't it sold? Are there any deal-killer items the seller is aware of (foundation, flood, title, zoning, code violations)?
- Is there a deadline driving the sale (1031 exchange, divorce, estate, relocation)? That informs how much negotiation room exists.
- Schools are A-rated — typically a magnet for longer-tenancy family renters. What's the average tenant stay here, and is there a school-zone premium baked into asking?
- What's the average days-on-market for RENTAL listings here right now (not sales)? A rising rental-DOM trend means longer vacancies and softer asking-rent achievability than the comps imply.
- What's the recent tenant-quality profile in this submarket — average credit score on applications, eviction rate, late-payment / NSF rate, and stable-employment percentage? A property-management company in the area should have these aggregated.
- How much new for-sale + rental construction is in the pipeline within 1–3 miles? Heavy new supply typically softens prices + rents 12–24 months out; constrained supply supports both.
Investment metrics
- 1% rule
- 2.82% ✓
- Cap rate
- 25.51%
- Cash-on-cash
- 68.62%
- DSCR
- 4.05
- GRM
- 3.0
CMA / ARV
- ARV (median comp)
- $167,500
- List price
- $79,950
- Delta
- -52.27%
- Verdict
- UNDERPRICED
- Comps
- 17 within 1.0 mi
Show comp detail 12 sales within ~0.75 mi
| Address | Dist | Beds/Ba | Sqft | Sold | Price | $/sf | Match |
|---|---|---|---|---|---|---|---|
| 1841 Trosper Rd SW #38 | 0.00mi | 2/2.0 (-1) | 1,152 (0%) | 13mo | $37,000 | $32 | 84 |
| 1841 Trosper Rd SW #25 | 0.00mi | 2/2.0 (-1) | 1,152 (0%) | 14mo | $75,000 | $65 | 84 |
| 5705 Littlerock Rd SW #41 | 0.34mi | 3/2.0 | 1,136 (-1%) | 4mo | $85,000 | $75 | 79 |
| 930 Trosper Rd SW #78 | 0.37mi | 3/2.0 | 1,120 (-3%) | 3mo | $85,000 | $76 | 76 |
| 930 Trosper Rd #135 | 0.28mi | 2/2.0 (-1) | 1,188 (+3%) | 12mo | $132,000 | $111 | 67 |
| 930 Trosper Rd SW #64 | 0.40mi | 3/2.0 | 1,248 (+8%) | 2mo | $61,000 | $49 | 66 |
| 5119 Golden Eagle Ln SW | 0.43mi | 3/2.0 | 1,232 (+7%) | 5mo | $196,000 | $159 | 64 |
| 5081 E Gray Sea Eagle Ln SW | 0.41mi | 2/2.0 (-1) | 1,176 (+2%) | 13mo | $100,000 | $85 | 61 |
| 930 Trosper Rd SW #37 | 0.47mi | 2/2.0 (-1) | 1,152 (0%) | 20mo | $100,000 | $87 | 56 |
| 5281 E Eagle Ln SW | 0.30mi | 2/2.0 (-1) | 1,056 (-8%) | 15mo | $235,000 | $223 | 54 |
| 930 Trosper Rd SW #34 | 0.43mi | 2/2.0 (-1) | 1,040 (-10%) | 11mo | $45,400 | $44 | 49 |
| 930 SW Trosper Rd #57 | 0.41mi | 2/2.0 (-1) | 1,260 (+9%) | 22mo | $102,000 | $81 | 42 |
Match score weights: distance 35% · size 25% · config 20% · recency 20%. Top-matched comps best support the ARV.
Projected returns pro-forma
-3.0% appreciation · 2.26% rent growth · sell at horizon
- IRR
- 67.2%
- Equity multiple
- 3.99×
- Total profit
- $66,907
- Equity at exit
- $11,921
- IRR
- 71.2%
- Equity multiple
- 7.99×
- Total profit
- $156,513
- Equity at exit
- $6,913
Cash invested: $22,386 (down + closing). Projections, not guarantees.
Landlord ↔ Tenant lean methodology
- Overall (STATE)
- 28 Tenant-Leaning
- State Washington
- 28 Tenant-Leaning · D+8
- County
- — inherits STATE
- City
- — inherits STATE
ZIP-level market 98512
- Rents YoY
- 2.3%
- Active inventory
- 233
- Price-to-rent
- 3.0×
Monthly cashflow live
- Estimated rent
- $2,255 high interval (Pro) →
- Mortgage (P&I)
- −$419
- Tax from tax record
- −$48 /mo · $582/yr
- Insurance
- −$33
- HOA
- −$0
- Vacancy / Maint / Mgmt
- −$473
- Net cashflow
- $1,280
Break-even live
UW: 25.0% down · 7.5% · 30yr · 1.5% tax · 5.0% vac · 8.0% maint · 8.0% mgmt
Financing live
Cash to close
- Down payment
- $19,988
- Closing costs
- $2,398
- Reserves months
- —
- Total cash needed
- —
Loan-product check · same deal, 3 products live
Conventional
25% down · 7.5% · 30yr
- Down + closing
- —
- Monthly P&I
- —
- Monthly cashflow
- —
- DSCR
- —
- Eligible?
- —
Personal DTI + credit; lowest rate.
DSCR
20% down · 8.5% · 30yr
- Down + closing
- —
- Monthly P&I
- —
- Monthly cashflow
- —
- DSCR
- —
- Eligible?
- —
No personal income docs; deal must DSCR.
Hard money
10% down · 12.0% · 12mo
- Down + closing
- —
- Monthly P&I
- —
- Monthly cashflow
- —
- DSCR
- —
- Eligible?
- —
Short-term bridge; refi at stabilization.
Rent comps 19 comps
| Address | Beds | Baths | Sqft | Rent | $/sqft | DOM | Units | Dist |
|---|---|---|---|---|---|---|---|---|
| 1619 Trosper Rd SW Tumwater, WA | 3.0 | 2.5 | 1295 | $2,495 | $1.93 | 21d | 1 | 0.21mi |
| 1978 Trosper Rd SW Tumwater, WA | 1.0–3.0 | 1.0–2.0 | 1106 | $2,574 | $2.33 | 13d | 4 | 0.25mi |
| 1978 Trosper Rd SW Tumwater, WA | 1.0–3.0 | 1.0–2.0 | 1050 | $2,735 | $2.60 | 43d | 3 | 0.25mi |
| 4822 Rural Rd SW Tumwater, WA | 2.0 | 2.0 | 1025 | $1,995 | $1.95 | 21d | 1 | 0.54mi |
| 1517 Bishop Rd SW Tumwater, WA | 2.0 | 1.0–2.0 | 669 | $1,930 | $2.88 | 13d | 1 | 0.54mi |
| 1500 Lake Park Dr SW #29 Tumwater, WA | 2.0 | 1.5 | 1428 | $1,850 | $1.30 | 21d | 1 | 0.56mi |
| 6705 Linderson Way SW Tumwater, WA | 1.0–3.0 | 1.0–2.0 | 900 | $2,350 | $2.61 | 13d | 6 | 0.68mi |
| 6805 Littlerock Rd SW Tumwater, WA | 2.0 | 1.0 | 1000 | $1,495 | $1.50 | 43d | 1 | 0.72mi |
| 301 T St SW Tumwater, WA | 2.0 | 1.0 | 589 | $1,635 | $2.78 | 13d | 5 | 0.75mi |
| 215 Pinehurst Dr SW Tumwater, WA | 2.0 | 1.0–2.5 | 759 | $1,950 | $2.57 | 13d | 4 | 0.78mi |
| 214 65th Way SW Tumwater, WA | 2.0 | 1.0 | 1000 | $1,850 | $1.85 | 21d | 1 | 0.89mi |
| 829 Israel Rd SW Apt A4 Tumwater, WA | 2.0 | 1.0 | 850 | $1,395 | $1.64 | 13d | 1 | 0.92mi |
| 829 Israel Rd SW Apt B6 Tumwater, WA | 2.0 | 1.0 | 850 | $1,395 | $1.64 | 43d | 1 | 0.92mi |
| 801 Israel Rd SW Tumwater, WA | 2.0 | 1.5 | 965 | $1,860 | $1.93 | 13d | 2 | 0.98mi |
| 220 Israel Rd SW Unit G8 Tumwater, WA | 2.0 | 1.5 | 968 | $1,975 | $2.04 | 43d | 1 | 1.01mi |
| 151 Cherry Ln SE Tumwater, WA | 3.0 | 1.0 | 874 | $2,195 | $2.51 | 21d | 1 | 1.08mi |
| 811 S 3rd Ave SW Unit B Tumwater, WA | 3.0 | 2.0 | 1336 | $2,300 | $1.72 | 43d | 1 | 1.17mi |
| 1704 Barnes Blvd SW Tumwater, WA | 1.0–3.0 | 1.0–2.5 | 920 | $2,500 | $2.72 | 13d | 35 | 1.41mi |
| 1992 Ridgeview Loop SW Unit 204 Tumwater, WA | 2.0 | 1.0 | 804 | $1,700 | $2.11 | 21d | 1 | 1.48mi |
Listing history 21 events
-
2026-06-18days on market $79,950 Active 79 DOM
-
2026-06-17days on market $79,950 Active 78 DOM
-
2026-06-16days on market $79,950 Active 77 DOM
-
2026-06-15pricedays on market $79,950 Active 76 DOM
-
2026-06-14days on market $89,950 Active 74 DOM
-
2026-06-13days on market $89,950 Active 73 DOM
-
2026-06-10days on market $89,950 Active 71 DOM
-
2026-06-09days on market $89,950 Active 70 DOM
-
2026-06-08days on market $89,950 Active 69 DOM
-
2026-06-07days on market $89,950 Active 68 DOM
-
2026-06-05days on market $89,950 Active 65 DOM
-
2026-06-02days on market $89,950 Active 63 DOM
-
2026-06-01days on market $89,950 Active 62 DOM
-
2026-05-31days on market $89,950 Active 61 DOM
-
2026-05-30days on market $89,950 Active 60 DOM
-
2026-03-31$99,950 Active
-
2011-07-14historical
-
2011-07-13soldstatus $11,000 Sold
-
2011-06-15status Pending Inspection
-
2011-06-02price $11,000
-
2011-04-13$15,000 Active
ⓘ Source: listings_history table (triggers on properties + properties_extension) + one-shot
backfill from property_details.listing_events for pre-trigger history.
Tax reassessment forecast WA · Resets to sale price
- Current annual tax
- $582 · $48/mo
- Projected year-2 tax
- $784 · $65/mo
- Expected delta
- +$202/yr (+$17/mo · 34.6%)
ⓘ Screening estimate from a state-policy table — verify with the county assessor before closing.
Climate risk First Street
- Flood 1/10 Low FEMA zone X (unshaded) · 0% chance over 30 yrs
- Wildfire 1/10 Low
- Heat 3/10 Moderate 7 d/yr ≥88°F today · 14 d/yr by 30 yrs out
- Wind 1/10 Low
- Air quality 6/10 Major 7 unhealthy d/yr today · 8 by 30 yrs out
Nearby sold comps map
Loading sold comps map…
Walkable amenities ~0.75 mi
Loading nearby amenities…
Taxation est. · year 1
- Rental income
- $27,055
- − Mortgage interest
- −$4,478
- − Property taxes
- −$582
- − Insurance
- −$400
- − Repairs & maintenance
- −$2,164
- − Management
- −$2,164
- − Depreciation
- −$2,326
- Taxable income
- $14,940
- Est. tax owed @ 24.0%
- −$3,586
- After-tax cash flow
- $11,775/yr
For passive investors: Depreciation is non-cash, so a rental often shows a tax loss while cash-flowing — sheltering income. Rental losses are passive: they offset passive income freely, and up to $25,000/yr can offset ordinary (W-2) income if you actively participate and your MAGI is under $100k (phasing out to $0 by $150k); unused losses carry forward. On sale, claimed depreciation is recaptured at up to 25%, and gains may owe capital-gains tax (a 1031 exchange can defer both). Figures are a year-1 estimate at your 24.0% rate — not tax advice; consult a CPA.
Schools (NCES district)
- District
- Tumwater School District
- NCES district ID
- 5309100
- Math proficiency
- 57% ▬ 0.00%
- Reading proficiency
- 69% ▼ -1.00%
- Median HH income
- $64,209
- Composite
- 56.38/100
- National rank
- #2477
- State rank
- #37 of 291 in WA
Livability — Tumwater
- Score
- 84/100
- State rank
- #39
- US rank
- #700
Category grades
Schools grade is shown separately in the Schools card above.
Census & demographics
- Census place
- Tumwater, WA
- County
- Thurston County · 269,345 people
- City population
- 46,937
- Metro
- Olympia-Lacey-Tumwater, WA
- Population (ZIP)
- 31,864
- Household income
- $101,530
- Rent vs Own
- Severe rent burden
- 784.0
Population outlook (Thurston County) Hauer SSP2
- Today (2025)
- 308,239 people
- By 2030
- 326,483 · +5.9%
- By 2040
- 359,890 · +16.8%
- By 2050
- 391,800 · +27.1%
- By 2075
- 468,024 · +51.8%
- By 2100
- 519,890 · +68.7%
Race, ethnicity, and origin ACS 2023
- Neighborhood character
- Predominantly White (72%)
- Race & ethnicity
- White 72% Two or more races 13% Hispanic / Latino 9% Asian 4% Black 3% Native American 1%
- Hispanic origin (detail)
- Mexican 5%
- Common ancestry
- Portuguese 4% Italian 4% Slovak 4%
- Foreign-born
- 6% · Canada, Vietnam, China
- Languages at home
- 92% English-only · Spanish 3% Vietnamese 1% German/W. Germanic 1%
Political lean MEDSL · Thurston
- 2024 margin
- Strong D (+20.4) · D 58.5% · R 38.1% · Other 3.5%
- 2008→2024 swing
- -1.3pp toward R · 2008: 21.7pp · 2024: 20.4pp
- All cycles
- 2024: D+20.4 2020: D+18.6 2016: D+15.4 2012: D+19.0 2008: D+21.7
Not yet ingested
- Civics
- —
Market trends
- HPI YoY
- ▼ -348.18%
- Current HPI
- 347.121
- Rent YoY
- ▲ 2.26%
- Metro
- Olympia-Lacey-Tumwater, WA
- State GDP YoY
- ▲ 4.65%
- F500 in state
- 22
Industry mix (Fortune 500 HQ in WA)
| Industry | F500 HQs | Revenue |
|---|---|---|
| Retail | 2 | $269B |
|
||
| Technology / Retail | 1 | $638B |
|
||
| Technology | 1 | $245B |
|
||
| Telecommunications | 1 | $38B |
|
||
| Food / Beverage | 1 | $36B |
|
||
| Automotive / Trucks | 1 | $34B |
|
||
Price history
+566.3% since first listed6 events — show timeline
- 2026-03-31 Listed $99,950 NWMLS as Distributed by MLS Grid
- 2011-07-14 Delisted — NWMLS as Distributed by MLS Grid
- 2011-07-13 Sold (MLS) $11,000 NWMLS as Distributed by MLS Grid
- 2011-06-15 Pending — NWMLS as Distributed by MLS Grid
- 2011-06-02 Price Changed $11,000 NWMLS as Distributed by MLS Grid
- 2011-04-13 Listed $15,000 NWMLS as Distributed by MLS Grid
Property tax history
+7.9%/yrLatest (2026): $582 · -29.9% YoY. Source: county tax records.
Cash-flow waterfall
monthlySold comps — $/sqft
last 12 mo · ≤1 miLoading sold comps…