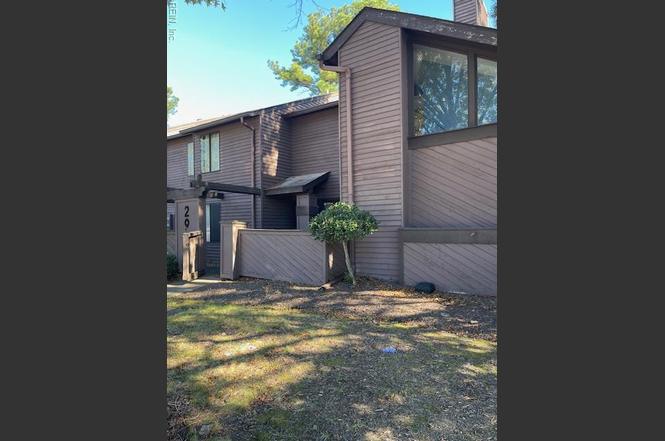
2980 St Albans Cmns · Virginia Beach, VA
Flood risk 1/10 · Minimal
- FEMA flood zone
- X (unshaded)
- Chance of flooding over 30 yrs
- 0.0%
- Est. flood insurance / yr
- $507 – $1,088
Fire risk 1/10 · Minimal
- Est. fire insurance / yr
- $666 – $1,236
Heat risk 9/10 · Severe
- Hot days now (above 104°F)
- 7 days/yr
- Hot days in 30 yrs
- 18 days/yr
Wind risk 8/10 · Major
- Chance of severe wind over 30 yrs
- 98.0%
Air-quality risk 3/10 · Minor
- Unhealthy air days now
- 2 days/yr
- Unhealthy air days in 30 yrs
- 4 days/yr
Risk factors via First Street. Map © Google.
Why this score? — see what drove the D grade
The composite is a weighted blend of 9 inputs, each scored 0–100. Each bar is that input's sub-score; the figure is the points it added to the 100-point composite (weight × sub-score).
- Cash flow +9.6/30.0
- ARV discount +7.5/15.0
- Schools +6.4/10.0
- 1% rule +4.4/10.0
- Livability +4.2/5.0
- Rent growth +3.7/5.0
- DSCR +2.7/10.0
- Condition / age +2.5/5.0
- Appreciation +0.0/10.0
$198,000
🖨 Deal sheet 📄 Offer letter ✓ Due diligence
Listing remarks
Virginia Beach condo with easy access to Malls, shopping and Interstates.
Key facts
- $364 HOA
- 2 parking spots
- Built 1984
Property features AI
Finance
- HOA & community: Condo association: St Albans Glen Condominium Association; Managed by The Select Group; Condo fee $364 monthly; Community amenities include pool, ground maintenance, and trash pickup
Exterior
- Parking: Assigned/reserved parking for 2 spaces
- Utilities: City/County water; City/County sewer; Electric water heater
- Home design: Attached condo; Contemporary, low-rise style; Single-story living level; Unit on condo level 1
- Construction: Asphalt shingle roof; Slab foundation
- Exterior features: Wood siding; Pool (community); Ground maintenance (community); Trash pickup (community)
Interior
- Kitchen: Electric range; Refrigerator; Dishwasher; Garbage disposal; Breakfast area adjacent to kitchen
- Bedrooms: First-floor master bedroom; Master bedroom with bath; Total rooms: 5
- Flooring: Carpet; Laminate
- Bathrooms: One full bathroom; Master bath attached to primary bedroom
- Heating & cooling: Heat pump heating; Electric heating; Central air conditioning
- Interior features: Carpet and laminate flooring; Breakfast area; Utility closet
- Laundry & utility: Washer hookup; Dryer hookup; Utility closet
Neighborhood map
What this means for you Summary
Snapshot
- This is a 2-bed/1.0-bath condo listed at $198k.
Deal economics
- At list price, monthly cash flow is $-133 ($-2k/yr) — negative.
- To cash-flow at today's rent, offer at most $175k (11.8% below list).
- To meet the 1% rule (rent ≥ 1% of price), the offer needs to be $187k (5.6% below list).
- Recommended offer: $174k (12.0% below list) — sets the bar for market timing.
- Cap rate 5.5% vs local median 3.5% in Virginia Beach — top-decile yield for the area; either an underpriced asset or a hidden risk that comps aren't pricing in. Stress-test before assuming the spread holds.
Location & tenants
- Location reads 83/100 on livability (#38 in VA, #880 nationally) — a professional / high-income tenant draw. Strengths: amenities A+, employment A+, housing A+; Watch: cost of living C-, commute F.
- Va Beach City Public School District (urban): math 69% / reading 78% proficiency, ranked #10 of 131 in VA (top 8%) — strong family-tenant draw, lease renewals of 3-5y typical.
- Zoned schools: Brookwood Elementary (math 56% / reading 68%, grade B, #480 of 1,108 statewide, top 46%, 571 students, 66% FRL); Green Run High (math 64% / reading 69%, grade B, #195 of 319 statewide, top 62%, 1,517 students, 69% FRL) — zoned schools average 68% FRL vs 28% district-wide (39 pts higher); higher-poverty schools than district average — tighter screening recommended.
- Market conditions: Rents rising fast (+4.9%/yr); 226 active listings in the ZIP; 19 comparable units currently listed for rent nearby; rentals at typical pace (median 21d on market — plan ~3-4 weeks tenant-placement turnaround); solid renter incomes; 666 units permitted in Virginia Beach city in 2024 (347 in 5+ unit buildings).
Forward outlook
- Local home prices are declining (-3.0%/yr); year-one equity from $1k of loan paydown is wiped out by about $6k of value loss. Plan a longer hold.
- Virginia Beach County population projected at +6% by 2050 — modest demand growth; plan on rents tracking national, not racing it.
Negotiation context
- It's been on market 238 days — a 12% lower offer ($174k) is reasonable based on typical stale-listing flexibility.
- Current owner paid $80k; list at $198k implies a 148% gain — meaningful room to come down on a strong offer.
Risks & watch-outs
- Climate carrying-cost: severe wind risk, 98% chance of damaging wind over 30y; extreme-heat days projected 7→18/yr by 2055 (HVAC capex compounding) — expect insurance premiums to compound above CPI over the hold.
Questions for the listing agent
- What do current leases actually rent for vs. the listed asking? Can we see a recent rent roll and the last 12 months of T-12 income?
- It's been on market 238 days. Have you received any prior offers? Is the seller open to a 12% concession, seller financing, or rate buy-down credit?
- What does the HOA fee cover, when was the last increase, and are there any pending special assessments or reserve-fund shortfalls?
- Any open or pending special assessments — roof, HVAC, plumbing, elevator, façade? What's the per-unit balance and payoff schedule, and is the seller paying it off at close or rolling it to the buyer?
- Why hasn't it sold? Are there any deal-killer items the seller is aware of (foundation, flood, title, zoning, code violations)?
- Is there a deadline driving the sale (1031 exchange, divorce, estate, relocation)? That informs how much negotiation room exists.
- Schools are A-rated — typically a magnet for longer-tenancy family renters. What's the average tenant stay here, and is there a school-zone premium baked into asking?
- The area grade is low — what's the realistic commute time and amenity access for the typical tenant pool here? Any planned neighborhood developments (good or bad) we should know about?
- What's the average days-on-market for RENTAL listings here right now (not sales)? A rising rental-DOM trend means longer vacancies and softer asking-rent achievability than the comps imply.
- What's the recent tenant-quality profile in this submarket — average credit score on applications, eviction rate, late-payment / NSF rate, and stable-employment percentage? A property-management company in the area should have these aggregated.
- How much new apartment / multifamily construction is in the pipeline within 1–3 miles? Heavy new supply (>2% of stock underway) typically softens rents 12–24 months out; light construction supports rent growth.
Investment metrics
- 1% rule
- 0.94% ✗
- Cap rate
- 5.49%
- Cash-on-cash
- -2.87%
- DSCR
- 0.87
- GRM
- 8.8
CMA / ARV
No comps found within radius.
Projected returns pro-forma
-3.0% appreciation · 4.92% rent growth · sell at horizon
- IRR
- -18.5%
- Equity multiple
- 0.34×
- Total profit
- $-36,687
- Equity at exit
- $29,522
- IRR
- -6.8%
- Equity multiple
- 0.52×
- Total profit
- $-26,420
- Equity at exit
- $17,119
Cash invested: $55,440 (down + closing). Projections, not guarantees.
Landlord ↔ Tenant lean methodology
- Overall (STATE)
- 55 Moderately Landlord-Leaning
- State Virginia
- 55 Moderately Landlord-Leaning · D+2
- County
- — inherits STATE
- City
- — inherits STATE
ZIP-level market 23452
- Rents YoY
- 4.9%
- Active inventory
- 226
- Price-to-rent
- 8.8×
Monthly cashflow live
- Estimated rent
- $1,869 high interval (Pro) →
- Mortgage (P&I)
- −$1,038
- Tax from tax record
- −$124 /mo · $1,491/yr
- Insurance
- −$82
- HOA
- −$364
- Vacancy / Maint / Mgmt
- −$392
- Net cashflow
- $-133
Break-even live
UW: 25.0% down · 7.5% · 30yr · 1.5% tax · 5.0% vac · 8.0% maint · 8.0% mgmt
Financing live
Cash to close
- Down payment
- $49,500
- Closing costs
- $5,940
- Reserves months
- —
- Total cash needed
- —
Loan-product check · same deal, 3 products live
Conventional
25% down · 7.5% · 30yr
- Down + closing
- —
- Monthly P&I
- —
- Monthly cashflow
- —
- DSCR
- —
- Eligible?
- —
Personal DTI + credit; lowest rate.
DSCR
20% down · 8.5% · 30yr
- Down + closing
- —
- Monthly P&I
- —
- Monthly cashflow
- —
- DSCR
- —
- Eligible?
- —
No personal income docs; deal must DSCR.
Hard money
10% down · 12.0% · 12mo
- Down + closing
- —
- Monthly P&I
- —
- Monthly cashflow
- —
- DSCR
- —
- Eligible?
- —
Short-term bridge; refi at stabilization.
Rent comps 19 comps
| Address | Beds | Baths | Sqft | Rent | $/sqft | DOM | Units | Dist |
|---|---|---|---|---|---|---|---|---|
| 411 Nottinghill Park Virginia Beach, VA | 1.0 | 1.0 | 846 | $2,200 | $2.60 | 23d | 1 | 0.07mi |
| 526 Glenn Regis Way Virginia Beach, VA | 2.0 | 2.0 | 969 | $1,799 | $1.86 | 4d | 1 | 0.13mi |
| 2933 Lyme Regis Quay Virginia Beach, VA | 2.0 | 2.0 | 1032 | $1,700 | $1.65 | 23d | 1 | 0.15mi |
| 666 Rivers Reach Virginia Beach, VA | 2.0 | 2.0 | 1032 | $1,600 | $1.55 | 14d | 1 | 0.15mi |
| 2914 Lyme Regis Quay Virginia Beach, VA | 2.0 | 2.0 | 1057 | $1,700 | $1.61 | 23d | 1 | 0.20mi |
| 526 Pheasant Run Virginia Beach, VA | 2.0 | 2.0 | 1057 | $1,800 | $1.70 | 23d | 1 | 0.21mi |
| 344 Dillon Dr Virginia Beach, VA | 3.0 | 1.5 | 1042 | $2,400 | $2.30 | 23d | 1 | 0.26mi |
| 3001 Reflections Way Virginia Beach, VA | 1.0–2.0 | 1.0–2.0 | 864 | $2,105 | $2.44 | 1d | 36 | 0.29mi |
| 3321 Rainier Ct Virginia Beach, VA | 2.0 | 2.5 | 1100 | $1,600 | $1.45 | 21d | 1 | 0.68mi |
| 3444 Terrazzo Trl Virginia Beach, VA | 3.0 | 2.0 | 1217 | $1,650 | $1.36 | 4d | 1 | 0.75mi |
| 3424 Rainey Rd Virginia Beach, VA | 3.0 | 1.0 | 1002 | $1,995 | $1.99 | 7d | 1 | 0.79mi |
| 124 Palm Beach Pl Virginia Beach, VA | 1.0–2.0 | 1.0 | 786 | $1,475 | $1.88 | 4d | 5 | 0.84mi |
| 212 Paladin Dr Virginia Beach, VA | 3.0 | 2.0 | 1456 | $2,800 | $1.92 | 23d | 1 | 0.95mi |
| 129 S Plaza Trl Virginia Beach, VA | 3.0 | 1.0 | 1456 | $2,000 | $1.37 | 23d | 1 | 0.95mi |
| 2925 Theodorus Ct Virginia Beach, VA | 3.0 | 1.5 | 1120 | $2,000 | $1.79 | 4d | 1 | 1.37mi |
| 3416 Alcott Rd Virginia Beach, VA | 3.0 | 1.0 | 1043 | $1,800 | $1.73 | 23d | 1 | 1.37mi |
| 3416 Hollygreen Dr Virginia Beach, VA | 2.0 | 1.0 | 960 | $1,754 | $1.83 | 23d | 5 | 1.47mi |
| 932 Gossman Dr Virginia Beach, VA | 3.0 | 1.5 | 1430 | $2,300 | $1.61 | 21d | 1 | 1.47mi |
| 3600 Malibu Palms Dr Virginia Beach, VA | 1.0–3.0 | 1.0–1.5 | 1025 | $1,827 | $1.78 | 2d | 19 | 1.49mi |
HOA detail condo
- Monthly dues
- $364 · $4,368/yr
- Assessments
- None detected in remarks — confirm with the listing agent.
Listing history 15 events
-
2026-06-18days on market $198,000 Active 238 DOM
-
2026-06-17days on market $198,000 Active 237 DOM
-
2026-06-16days on market $198,000 Active 236 DOM
-
2026-06-15days on market $198,000 Active 235 DOM
-
2026-06-13days on market $198,000 Active 233 DOM
-
2026-06-09days on market $198,000 Active 229 DOM
-
2026-06-08days on market $198,000 Active 228 DOM
-
2026-06-07days on market $198,000 Active 227 DOM
-
2026-06-03days on market $198,000 Active 223 DOM
-
2026-06-02days on market $198,000 Active 222 DOM
-
2026-06-01days on market $198,000 Active 221 DOM
-
2026-05-31days on market $198,000 Active 220 DOM
-
2025-10-23$198,000 Active
-
2014-05-12soldstatus $80,000
-
2004-03-17soldstatus $79,000
ⓘ Source: listings_history table (triggers on properties + properties_extension) + one-shot
backfill from property_details.listing_events for pre-trigger history.
Tax reassessment forecast VA · Resets to sale price
- Current annual tax
- $1,491 · $124/mo
- Projected year-2 tax
- $1,624 · $135/mo
- Expected delta
- +$133/yr (+$11/mo · 8.9%)
ⓘ Screening estimate from a state-policy table — verify with the county assessor before closing.
Climate risk First Street
- Flood 1/10 Low FEMA zone X (unshaded) · 0% chance over 30 yrs
- Wildfire 1/10 Low
- Heat 9/10 Extreme 7 d/yr ≥104°F today · 18 d/yr by 30 yrs out
- Wind 8/10 Severe 98% chance of damaging wind over 30 yrs
- Air quality 3/10 Moderate 2 unhealthy d/yr today · 4 by 30 yrs out
Nearby sold comps map
Loading sold comps map…
Walkable amenities ~0.75 mi
Loading nearby amenities…
Taxation est. · year 1
- Rental income
- $22,425
- − Mortgage interest
- −$11,091
- − Property taxes
- −$1,491
- − Insurance
- −$990
- − Repairs & maintenance
- −$1,794
- − Management
- −$1,794
- − HOA
- −$4,368
- − Depreciation
- −$5,760
- Taxable loss
- −$4,863
- Est. tax savings @ 24.0%
- +$1,167
- After-tax cash flow
- $-426/yr
For passive investors: Depreciation is non-cash, so a rental often shows a tax loss while cash-flowing — sheltering income. Rental losses are passive: they offset passive income freely, and up to $25,000/yr can offset ordinary (W-2) income if you actively participate and your MAGI is under $100k (phasing out to $0 by $150k); unused losses carry forward. On sale, claimed depreciation is recaptured at up to 25%, and gains may owe capital-gains tax (a 1031 exchange can defer both). Figures are a year-1 estimate at your 24.0% rate — not tax advice; consult a CPA.
Schools (NCES district)
- District
- Va Beach City Public School District
- NCES district ID
- 5103840
- Math proficiency
- 69% ▼ -19.00%
- Reading proficiency
- 78% ▼ -7.00%
- Median HH income
- $66,452
- Composite
- 63.81/100
- National rank
- #594
- State rank
- #10 of 131 in VA
Livability — Virginia Beach
- Score
- 83/100
- State rank
- #38
- US rank
- #880
Category grades
Schools grade is shown separately in the Schools card above.
Census & demographics
- Census place
- Virginia Beach, VA
- County
- Virginia Beach City · 448,227 people
- City population
- 448,227
- Metro
- Virginia Beach-Norfolk-Newport News, VA-NC
- Population (ZIP)
- 58,455
- Household income
- $79,085
- Rent vs Own
- Severe rent burden
- 2293.0
Population outlook (Virginia Beach County) Hauer SSP2
- Today (2025)
- 480,401 people
- By 2030
- 491,221 · +2.3%
- By 2040
- 504,882 · +5.1%
- By 2050
- 508,847 · +5.9%
- By 2075
- 504,831 · +5.1%
- By 2100
- 465,867 · -3.0%
Race, ethnicity, and origin ACS 2023
- Neighborhood character
- Diverse neighborhood (Simpson 0.59)
- Race & ethnicity
- White 60% Black 20% Two or more races 10% Hispanic / Latino 9% Asian 5%
- Hispanic origin (detail)
- Mexican 2% Puerto Rican 3%
- Common ancestry
- Romanian 2% Italian 2% Lithuanian 2%
- Foreign-born
- 8% · Canada, Jamaica
- Languages at home
- 88% English-only · Spanish 6% Tagalog/Filipino 2% Other Asian/Pacific 1%
Political lean MEDSL · Virginia Beach
- 2024 margin
- Toss-up / Even · D 50.7% · R 48.0% · Other 1.3%
- 2008→2024 swing
- +3.4pp toward D · 2008: -0.7pp · 2024: 2.6pp
- All cycles
- 2024: D+2.6 2020: D+5.4 2016: R+4.5 2012: R+2.5 2008: R+0.7
Not yet ingested
- Civics
- —
Market trends
- HPI YoY
- ▼ -363.80%
- Current HPI
- 328.5435
- Rent YoY
- ▲ 4.92%
- Metro
- Virginia Beach-Norfolk-Newport News, VA-NC
- State GDP YoY
- ▲ 2.40%
- F500 in state
- 50
Industry mix (Fortune 500 HQ in VA)
| Industry | F500 HQs | Revenue |
|---|---|---|
| Aerospace / Defense | 4 | $236B |
|
||
| Technology / Defense | 3 | $32B |
|
||
| Financial Services | 2 | $176B |
|
||
| Utilities | 2 | $27B |
|
||
| Insurance | 2 | $25B |
|
||
| Technology | 2 | $15B |
|
||
Price history
+150.6% since first listed3 events — show timeline
- 2025-10-23 Listed $198,000 REINMLS
- 2014-05-12 Sold (Public Records) $80,000 Public Records
- 2004-03-17 Sold (Public Records) $79,000 Public Records
Property tax history
+2.6%/yrLatest (2025): $1,491 · +5.9% YoY. Source: county tax records.
Cash-flow waterfall
monthlySold comps — $/sqft
last 12 mo · ≤1 miLoading sold comps…