 Duplex
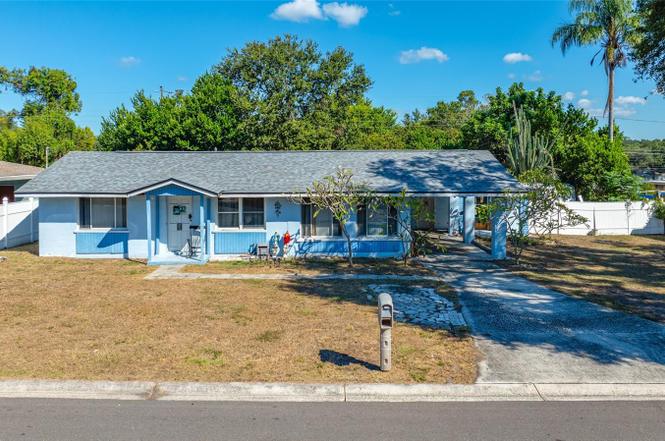
1324 Milton St · Clearwater, FL
Flood risk 1/10 · Minimal
- FEMA flood zone
- X (unshaded)
- Chance of flooding over 30 yrs
- 0.0%
- Est. flood insurance / yr
- $507 – $1,088
Fire risk 1/10 · Minimal
- Est. fire insurance / yr
- $947 – $1,759
Heat risk 10/10 · Severe
- Hot days now (above 107°F)
- 7 days/yr
- Hot days in 30 yrs
- 25 days/yr
Wind risk 10/10 · Severe
- Chance of severe wind over 30 yrs
- 99.0%
Air-quality risk 3/10 · Minor
- Unhealthy air days now
- 2 days/yr
- Unhealthy air days in 30 yrs
- 3 days/yr
Risk factors via First Street. Map © Google.
Why this score? — see what drove the C grade
The composite is a weighted blend of 9 inputs, each scored 0–100. Each bar is that input's sub-score; the figure is the points it added to the 100-point composite (weight × sub-score).
- Cash flow +20.2/30.0
- ARV discount +15.0/15.0
- DSCR +6.4/10.0
- 1% rule +5.1/10.0
- Schools +4.3/10.0
- Livability +4.1/5.0
- Condition / age +2.5/5.0
- Rent growth +1.9/5.0
- Appreciation +0.0/10.0
$349,000
🖨 Deal sheet 📄 Offer letter ✓ Due diligence
Multi-family units
County records classify this as Multi-Family (2-4 Unit). Listing-text estimate: 2 units. confirmed
Listing remarks
Under contract-accepting backup offers. Virtually Staged. Duplex: Welcome to 1324 Milton Street, a legally zoned duplex ideally situated in the heart of Clearwater, Florida. This solid block property rests on a spacious double lot measuring 100 feet wide by 102 feet deep, featuring a large fenced yard with plenty of room to park an RV, boat, or multiple vehicles. Zoned LDMR (Low Medium Density Residential), the property has no HOA restrictions and is located outside of a flood zone, offering added peace of mind and flexibility for both homeowners and investors. The duplex consists of two separate units connected by a covered breezeway and a convenient one-car covered carport. The front unit
Key facts
- Two separate units
- Huge fenced yard
- Large double lot
Tags
Property features AI
Finance
- Other: Two-unit property; One separate water meter; Lot size approximately 0.25 acres (100 x 102); Zoning / future land use: LMDR
- Financial info: Gross income: $34,200; Estimated annual market income: $43,140; Annual net income: $28,112; Annual expenses: $6,088; Total monthly expenses: $507; Gross lease terms; tenant pays electricity, sewer, trash collection, and water; Unfurnished units
- HOA & community: No association fees; Community features: dog park, park, playground; Pets allowed (cats and dogs)
Exterior
- Parking: Attached carport (1 space); Driveway parking; Off-street and on-street parking available; Covered parking and RV/Golf cart parking; Guest parking
- Security: Security lights
- Utilities: Public water; Public sewer; Cable connected and available; Broadband/high-speed internet available; Electricity connected
- Home design: Residential income duplex; Single-story; One building on the lot; Other structures include guest house and storage
- Construction: Block construction; Membrane and shingle roof; Slab foundation; Completed property condition; Built as residential income (duplex)
- Exterior features: Covered front and rear porches; Covered patio/porch areas; Landscaped, level and oversized lot; Near golf course and public transit; Paved, asphalt road access; Public maintained road
Interior
- Kitchen: Range; Electric water heater
- Bedrooms: Four bedrooms total; Unit 1: 3 bedrooms (attached carport, inside private laundry room); Unit 2: 1 bedroom (full kitchen, living room, bedroom)
- Flooring: Carpet; Laminate; Linoleum; Tile; Wood
- Bathrooms: Two full bathrooms (one in each unit)
- Heating & cooling: Central heating (electric); Central air; Wall/window AC units
- Interior features: Eat-in kitchen; Living room / dining room combo; Split bedroom layout; Inside utility and storage rooms; Private mailbox; Security lights
- Laundry & utility: Inside laundry room; Washer hookup; Electric dryer hookup; Outside laundry hookups (for one unit)
Neighborhood map
What this means for you Summary
Snapshot
- This is a 2 × 2-bed/1.0-bath units multifamily listed at $349k.
Deal economics
- At list price, monthly cash flow is $439 ($5k/yr) — positive. Per door: $219/mo.
- The deal already cash-flows at list — no discount required.
- Meets the 1% rule at list price ($4k rent vs $349k).
- Recommended offer: $307k (12.0% below list) — sets the bar for market timing.
- Cap rate 7.8% vs local median 2.9% in Clearwater — top-decile yield for the area; either an underpriced asset or a hidden risk that comps aren't pricing in. Stress-test before assuming the spread holds.
Location & tenants
- Location reads 82/100 on livability (#60 in FL, #988 nationally) — a professional / high-income tenant draw. Strengths: commute A+, housing A+, health & safety A+; Watch: employment C-.
- Pinellas (suburban): math 51% / reading 51% proficiency, ranked #31 of 73 in FL (top 42%) — acceptable for families but not a draw, mixed tenant base, ~2y average lease.
- Zoned schools: Plumb Elementary School (math 56% / reading 54%, grade C, #872 of 2,144 statewide, top 42%, 622 students, 56% FRL); Clearwater High School (math 30% / reading 36%, grade F, #406 of 667 statewide, top 61%, 1,664 students, 59% FRL).
- Market conditions: Rents soft (-2.2%/yr); 355 active listings in the ZIP; 33 comparable units currently listed for rent nearby; rentals leasing fast (median 12d on market — plan ~1-2 weeks tenant-placement turnaround); 2,676 units permitted in Pinellas County in 2024 (1,422 in 5+ unit buildings).
- At $3,534/mo this rent would consume 69% of the median local household income ($62k/yr) (locally 1868% of renters already pay >50% of income on rent) — very limited rent-growth headroom before tenants either downsize or default.
Forward outlook
- Local home prices are declining (-3.0%/yr); year-one equity from $2k of loan paydown is wiped out by about $10k of value loss. Plan a longer hold.
- Pinellas County population projected at +14% by 2050 — modest demand growth; plan on rents tracking national, not racing it.
Negotiation context
- It's been on market 205 days — a 12% lower offer ($307k) is reasonable based on typical stale-listing flexibility.
- Current owner paid $55k; list at $349k implies a 535% gain — meaningful room to come down on a strong offer.
Risks & watch-outs
- Watch-outs: built in 1956 — expect roof / HVAC / electrical / plumbing capex.
- Climate carrying-cost: severe wind risk, 99% chance of damaging wind over 30y; extreme-heat days projected 7→25/yr by 2055 (HVAC capex compounding) — expect insurance premiums to compound above CPI over the hold.
Questions for the listing agent
- It's been on market 205 days. Have you received any prior offers? Is the seller open to a 12% concession, seller financing, or rate buy-down credit?
- Can we see the unit-by-unit rent roll, current vacancy, and any below-market leases? What's the average tenancy length?
- What capital expenditures (roof, boiler, parking lot, exteriors) have been made in the last 5 years, and what's planned in the next 2?
- Built in 1956 — when were the roof, HVAC, electrical panel, plumbing, and water heater last replaced?
- Why hasn't it sold? Are there any deal-killer items the seller is aware of (foundation, flood, title, zoning, code violations)?
- Is there a deadline driving the sale (1031 exchange, divorce, estate, relocation)? That informs how much negotiation room exists.
- What's the average days-on-market for RENTAL listings here right now (not sales)? A rising rental-DOM trend means longer vacancies and softer asking-rent achievability than the comps imply.
- What's the recent tenant-quality profile in this submarket — average credit score on applications, eviction rate, late-payment / NSF rate, and stable-employment percentage? A property-management company in the area should have these aggregated.
- How much new apartment / multifamily construction is in the pipeline within 1–3 miles? Heavy new supply (>2% of stock underway) typically softens rents 12–24 months out; light construction supports rent growth.
Investment metrics
- 1% rule
- 1.01% ✓
- Cap rate
- 7.80%
- Cash-on-cash
- 5.39%
- DSCR
- 1.24
- GRM
- 8.2
CMA / ARV
- ARV (on-the-fly)
- $427,638
- Comps found
- 1
Show comp detail 1 sale within ~0.75 mi
| Address | Dist | Beds/Ba | Sqft | Sold | Price | $/sf | Match |
|---|---|---|---|---|---|---|---|
| 312 S Betty Ln | 0.75mi | 4/4.0 | 1,500 (-5%) | 10mo | $407,000 | $271 | 41 |
Match score weights: distance 35% · size 25% · config 20% · recency 20%. Top-matched comps best support the ARV.
Projected returns pro-forma
-3.0% appreciation · 0.0% rent growth · sell at horizon
- IRR
- -11.3%
- Equity multiple
- 0.60×
- Total profit
- $-38,955
- Equity at exit
- $52,037
- IRR
- -7.0%
- Equity multiple
- 0.61×
- Total profit
- $-37,902
- Equity at exit
- $30,175
Cash invested: $97,720 (down + closing). Projections, not guarantees.
Landlord ↔ Tenant lean methodology
- Overall (STATE)
- 87 Strongly Landlord-Friendly
- State Florida
- 87 Strongly Landlord-Friendly · R+3
- County
- — inherits STATE
- City
- — inherits STATE
ZIP-level market 33756
- Rents YoY
- -2.2%
- Active inventory
- 355
- Price-to-rent
- 16.5×
Monthly cashflow live
- Estimated rent
- $3,534 high interval (Pro) →
- Mortgage (P&I)
- −$1,830
- Tax from tax record
- −$378 /mo · $4,531/yr
- Insurance
- −$145
- HOA
- −$0
- Vacancy / Maint / Mgmt
- −$742
- Net cashflow
- $439
Break-even live
2-unit breakdown (identical units grouped — click to expand)
| Units | Beds | Baths | Est. rent |
|---|---|---|---|
| 2× units | 2 | 1 | $3,534 |
| #1 | 2 | 1 | $1,767 |
| #2 | 2 | 1 | $1,767 |
| Total (2 units) | $3,534 | ||
UW: 25.0% down · 7.5% · 30yr · 1.5% tax · 5.0% vac · 8.0% maint · 8.0% mgmt
Financing live
Cash to close
- Down payment
- $87,250
- Closing costs
- $10,470
- Reserves months
- —
- Total cash needed
- —
Loan-product check · same deal, 3 products live
Conventional
25% down · 7.5% · 30yr
- Down + closing
- —
- Monthly P&I
- —
- Monthly cashflow
- —
- DSCR
- —
- Eligible?
- —
Personal DTI + credit; lowest rate.
DSCR
20% down · 8.5% · 30yr
- Down + closing
- —
- Monthly P&I
- —
- Monthly cashflow
- —
- DSCR
- —
- Eligible?
- —
No personal income docs; deal must DSCR.
Hard money
10% down · 12.0% · 12mo
- Down + closing
- —
- Monthly P&I
- —
- Monthly cashflow
- —
- DSCR
- —
- Eligible?
- —
Short-term bridge; refi at stabilization.
Rent comps 33 comps
| Address | Beds | Baths | Sqft | Rent | $/sqft | DOM | Units | Dist |
|---|---|---|---|---|---|---|---|---|
| 1353 Lakeview Rd Clearwater, FL | 3.0 | 1.0 | 1360 | $1,995 | $1.47 | 24d | 1 | 0.14mi |
| 1009 Chester Dr Clearwater, FL | 3.0 | 2.0 | 1105 | $2,500 | $2.26 | 11d | 1 | 0.27mi |
| 1429 S Evergreen Ave Clearwater, FL | 4.0 | 2.0 | 1782 | $2,781 | $1.56 | 4d | 1 | 0.44mi |
| 1412 Druid Rd E Clearwater, FL | 3.0 | 1.0 | 1239 | $1,995 | $1.61 | 24d | 1 | 0.48mi |
| 1523 S Fredrica Ave Clearwater, FL | 3.0 | 2.0 | 1284 | $2,550 | $1.99 | 24d | 1 | 0.63mi |
| 1581 Lotus Path Clearwater, FL | 3.0 | 2.0 | 1690 | $3,400 | $2.01 | 4d | 1 | 0.67mi |
| 1526 Caldera Ct Clearwater, FL | 3.0 | 2.5 | 1816 | $2,900 | $1.60 | 14d | 1 | 0.80mi |
| 1588 Eunice Ln Clearwater, FL | 4.0 | 2.0 | 1780 | $2,731 | $1.53 | 7d | 1 | 0.81mi |
| 1342 Belleair Rd Clearwater, FL | 4.0 | 2.0 | 1695 | $2,845 | $1.68 | 20d | 1 | 0.82mi |
| 1276 Pierce St Unit 1276 Clearwater, FL | 3.0 | 2.5 | 1450 | $2,550 | $1.76 | 4d | 1 | 0.92mi |
| 1264 Pierce St Clearwater, FL | 3.0 | 2.5 | 1436 | $2,500 | $1.74 | 22d | 1 | 0.92mi |
| 1310 Bayview Dr Clearwater, FL | 3.0 | 2.0 | 1500 | $3,300 | $2.20 | 24d | 1 | 0.95mi |
| 1279 Park St Unit n/a Clearwater, FL | 3.0 | 2.5 | 1300 | $2,450 | $1.88 | 24d | 1 | 0.95mi |
| 1128 Belleair Rd Unit Home Clearwater, FL | 3.0 | 1.0 | 1326 | $1,695 | $1.28 | 24d | 1 | 0.95mi |
| 1574 Ewing Ave Clearwater, FL | 3.0 | 2.0 | 1324 | $2,700 | $2.04 | 4d | 1 | 0.99mi |
| 642 Wells Ct #302 Clearwater, FL | 3.0 | 2.0 | 1588 | $2,795 | $1.76 | 11d | 1 | 1.02mi |
| 1500 Laurel Cir Clearwater, FL | 3.0 | 2.0 | 1530 | $2,650 | $1.73 | 4d | 1 | 1.04mi |
| 1482 Cleveland St Clearwater, FL | 3.0 | 2.0 | 1110 | $2,750 | $2.48 | 4d | 1 | 1.08mi |
| 16 N San Remo Ave Clearwater, FL | 3.0 | 1.0 | 1249 | $1,795 | $1.44 | 24d | 1 | 1.08mi |
| 1571 S Myrtle Ave Clearwater, FL | 3.0 | 2.0 | 1202 | $2,400 | $2.00 | 24d | 1 | 1.13mi |
| 528 Jasmine Way Unit 528 Clearwater, FL | 4.0 | 3.0 | 2083 | $3,000 | $1.44 | 3d | 1 | 1.13mi |
| 113 Kenwood Ave Clearwater, FL | 4.0 | 2.5 | 2217 | $3,000 | $1.35 | 4d | 1 | 1.13mi |
| 1354 Chesterfield Dr Unit 1039504P Clearwater, FL | 4.0 | 2.0 | 1840 | $6,710 | $3.65 | 2d | 1 | 1.27mi |
| 701 Oak Ave Clearwater, FL | 4.0 | 2.0 | 1250 | $3,200 | $2.56 | 24d | 1 | 1.29mi |
| 1773 Eaton Dr Unit 1032113P Clearwater, FL | 3.0 | 2.0 | 1991 | $6,090 | $3.06 | 14d | 1 | 1.30mi |
| 1632 Clearwater Largo Rd Clearwater, FL | 3.0 | 1.0–2.0 | 961 | $2,899 | $3.02 | 2d | 25 | 1.33mi |
| 1321 Chesterfield Dr Unit 1018173P Clearwater, FL | 3.0 | 2.0 | 1356 | $3,967 | $2.93 | 2d | 1 | 1.33mi |
| 1812 Lady Mary Dr Clearwater, FL | 3.0 | 2.0 | 1531 | $2,800 | $1.83 | 3d | 1 | 1.42mi |
| 628 Cleveland St Clearwater, FL | 2.0–3.0 | 2.0 | 1666 | $3,750 | $2.25 | 24d | 2 | 1.42mi |
| 304 Orangewood Ave Clearwater, FL | 3.0 | 2.0 | 1710 | $3,375 | $1.97 | 3d | 1 | 1.45mi |
| 701 Brookside Dr Clearwater, FL | 3.0 | 2.0 | 1787 | $2,755 | $1.54 | 4d | 1 | 1.45mi |
| 905 Jones St Clearwater, FL | 3.0 | 2.0 | 1072 | $2,450 | $2.29 | 24d | 1 | 1.45mi |
| 311 Pennsylvania Ave Clearwater, FL | 3.0 | 2.0 | 1220 | $2,300 | $1.89 | 24d | 1 | 1.46mi |
Listing history 9 events
-
2026-05-11status Pending
-
2026-04-30price $349,000
-
2026-03-13price $369,690
-
2026-02-12price $374,900
-
2025-11-21price $375,000
-
2025-11-04price $399,000
-
2025-10-18$415,000 Active
-
1991-05-28soldstatus $55,000
-
1983-11-01soldstatus $52,000
ⓘ Source: listings_history table (triggers on properties + properties_extension) + one-shot
backfill from property_details.listing_events for pre-trigger history.
Tax reassessment forecast FL · Resets to sale price
- Current annual tax
- $4,531 · $378/mo
- Projected year-2 tax
- $4,531 · $378/mo
- Expected delta
- $0/yr ($0/mo · 0.0%)
ⓘ Screening estimate from a state-policy table — verify with the county assessor before closing.
Climate risk First Street
- Flood 1/10 Low FEMA zone X (unshaded) · 0% chance over 30 yrs
- Wildfire 1/10 Low
- Heat 10/10 Extreme 7 d/yr ≥107°F today · 25 d/yr by 30 yrs out
- Wind 10/10 Extreme 99% chance of damaging wind over 30 yrs
- Air quality 3/10 Moderate 2 unhealthy d/yr today · 3 by 30 yrs out
Nearby sold comps map
Loading sold comps map…
Walkable amenities ~0.75 mi
Loading nearby amenities…
Taxation est. · year 1
- Rental income
- $42,408
- − Mortgage interest
- −$19,549
- − Property taxes
- −$4,531
- − Insurance
- −$1,745
- − Repairs & maintenance
- −$3,393
- − Management
- −$3,393
- − Depreciation
- −$10,153
- Taxable loss
- −$356
- Est. tax savings @ 24.0%
- +$85
- After-tax cash flow
- $5,349/yr
For passive investors: Depreciation is non-cash, so a rental often shows a tax loss while cash-flowing — sheltering income. Rental losses are passive: they offset passive income freely, and up to $25,000/yr can offset ordinary (W-2) income if you actively participate and your MAGI is under $100k (phasing out to $0 by $150k); unused losses carry forward. On sale, claimed depreciation is recaptured at up to 25%, and gains may owe capital-gains tax (a 1031 exchange can defer both). Figures are a year-1 estimate at your 24.0% rate — not tax advice; consult a CPA.
Schools (NCES district)
- District
- Pinellas
- NCES district ID
- 1201560
- Math proficiency
- 51% ▼ -5.00%
- Reading proficiency
- 51% ▼ -3.00%
- Median HH income
- $46,270
- Composite
- 43.27/100
- National rank
- #3046
- State rank
- #31 of 73 in FL
Livability — Clearwater
- Score
- 82/100
- State rank
- #60
- US rank
- #988
Category grades
Schools grade is shown separately in the Schools card above.
Census & demographics
- Census place
- Clearwater, FL
- County
- Pinellas County · 939,478 people
- City population
- 170,933
- Metro
- Tampa-St. Petersburg-Clearwater, FL
- Population (ZIP)
- 32,201
- Household income
- $61,872
- Rent vs Own
- Severe rent burden
- 1868.0
Population outlook (Pinellas County) Hauer SSP2
- Today (2025)
- 1,027,532 people
- By 2030
- 1,063,586 · +3.5%
- By 2040
- 1,125,020 · +9.5%
- By 2050
- 1,168,637 · +13.7%
- By 2075
- 1,265,188 · +23.1%
- By 2100
- 1,260,357 · +22.7%
Race, ethnicity, and origin ACS 2023
- Neighborhood character
- Majority White (64%)
- Race & ethnicity
- White 64% Hispanic / Latino 18% Black 11% Two or more races 9% Asian 3%
- Hispanic origin (detail)
- Mexican 8% Puerto Rican 5%
- Common ancestry
- Romanian 3% Lithuanian 2% Slovak 2%
- Foreign-born
- 16% · Canada
- Languages at home
- 79% English-only · Spanish 14% Other Indo-European 2% Russian/Polish/Slavic 2%
Political lean MEDSL · Pinellas
- 2024 margin
- Lean R (+5.2) · D 46.9% · R 52.1%
- 2008→2024 swing
- -13.5pp toward R · 2008: 8.3pp · 2024: -5.2pp
- All cycles
- 2024: R+5.2 2020: D+0.2 2016: R+1.1 2012: D+5.6 2008: D+8.3
Not yet ingested
- Civics
- —
Market trends
- HPI YoY
- ▼ -438.74%
- Current HPI
- 354.6792
- Rent YoY
- ▼ -2.22%
- Metro
- Tampa-St. Petersburg-Clearwater, FL
- State GDP YoY
- ▲ 3.28%
- F500 in state
- 36
Industry mix (Fortune 500 HQ in FL)
| Industry | F500 HQs | Revenue |
|---|---|---|
| Industrial Technology | 2 | $29B |
|
||
| Insurance | 2 | $17B |
|
||
| Retail | 1 | $60B |
|
||
| Technology Distribution | 1 | $58B |
|
||
| Homebuilding | 1 | $35B |
|
||
| Technology Manufacturing | 1 | $35B |
|
||
Price history
+571.2% since first listed9 events — show timeline
- 2026-05-11 Pending — Stellar MLS as Distributed by MLS Grid
- 2026-04-30 Price Changed $349,000 Stellar MLS as Distributed by MLS Grid
- 2026-03-13 Price Changed $369,690 Stellar MLS as Distributed by MLS Grid
- 2026-02-12 Price Changed $374,900 Stellar MLS as Distributed by MLS Grid
- 2025-11-21 Price Changed $375,000 Stellar MLS as Distributed by MLS Grid
- 2025-11-04 Price Changed $399,000 Stellar MLS as Distributed by MLS Grid
- 2025-10-18 Listed $415,000 Stellar MLS as Distributed by MLS Grid
- 1991-05-28 Sold (Public Records) $55,000 Public Records
- 1983-11-01 Sold (Public Records) $52,000 Public Records
Property tax history
+7.0%/yrLatest (2025): $4,531 · +12.9% YoY. Source: county tax records.
Cash-flow waterfall
monthlySold comps — $/sqft
last 12 mo · ≤1 miLoading sold comps…