233 Long Leaf Dr · Belmont, NC
Flood risk 1/10 · Minimal
- FEMA flood zone
- X (unshaded)
- Chance of flooding over 30 yrs
- 0.0%
- Est. flood insurance / yr
- $507 – $1,088
Fire risk 3/10 · Minor
- Est. fire insurance / yr
- $906 – $1,684
Heat risk 6/10 · Moderate
- Hot days now (above 104°F)
- 7 days/yr
- Hot days in 30 yrs
- 17 days/yr
Wind risk 5/10 · Moderate
- Chance of severe wind over 30 yrs
- 25.0%
Air-quality risk 3/10 · Minor
- Unhealthy air days now
- 3 days/yr
- Unhealthy air days in 30 yrs
- 4 days/yr
Risk factors via First Street. Map © Google.
Why this score? — see what drove the B grade
The composite is a weighted blend of 9 inputs, each scored 0–100. Each bar is that input's sub-score; the figure is the points it added to the 100-point composite (weight × sub-score).
- Cash flow +30.0/30.0
- 1% rule +10.0/10.0
- DSCR +10.0/10.0
- ARV discount +7.5/15.0
- Schools +3.6/10.0
- Livability +3.6/5.0
- Rent growth +3.2/5.0
- Condition / age +2.2/5.0
- Appreciation +0.0/10.0
$93,000
🖨 Deal sheet 📄 Offer letter ✓ Due diligence
Listing remarks
Open layout connecting the kitchen, dining room & amp; living room Contemporary finishes throughout Life Proof Pergo flooring throughout, installed after purchase of home along with stainless steel appliances A/C unit included Washer and Dryer Negotiable Shed included for extra storage Located in the clean & amp; convenient Cato neighborhood - minutes from downtown Belmont, I-85, & amp; 485 Land rented through Cato ($410/month) Seller is motivated
Key facts
- Open layout
- Shed included
- A/c unit included
Tags
Neighborhood map
What this means for you Summary
Snapshot
- This is a 3-bed/2.0-bath manufactured listed at $93k. Condition is rated fair.
Deal economics
- At list price, monthly cash flow is $896 ($11k/yr) — positive.
- The deal already cash-flows at list — no discount required.
- Meets the 1% rule at list price ($2k rent vs $93k).
- Recommended offer: $92k (1.5% below list) — sets the bar for market timing.
- Cap rate 17.8% vs local median 2.3% in Belmont — top-decile yield for the area; either an underpriced asset or a hidden risk that comps aren't pricing in. Stress-test before assuming the spread holds.
Location & tenants
- Location reads 71/100 on livability (#105 in NC) — a middle-class / working-renter tenant base. Strengths: housing A+, employment A-, cost of living A-; Watch: crime D-, amenities F, commute F.
- Gaston County Schools (suburban): math 44% / reading 42% proficiency, ranked #93 of 178 in NC (top 52%) — families likely to look elsewhere, expect single-tenant / working-renter base with shorter leases.
- Market conditions: Rents rising (+2.7%/yr); 420 active listings in the ZIP; 14 comparable units currently listed for rent nearby; rentals at typical pace (median 20d on market — plan ~3-4 weeks tenant-placement turnaround); solid renter incomes; 2,069 units permitted in Gaston County in 2024 (142 in 5+ unit buildings).
Forward outlook
- Local home prices are declining (-3.0%/yr); year-one equity from $643 of loan paydown is wiped out by about $3k of value loss. Plan a longer hold.
- Gaston County population projected at +12% by 2050 — modest demand growth; plan on rents tracking national, not racing it.
- At projected returns (-3.0% appreciation + 2.7% rent growth), your $26k cash investment doubles in ~3 years — after that, you're playing with house money.
Negotiation context
- It's been on market 23 days — a 2% lower offer ($92k) is reasonable based on typical stale-listing flexibility.
Risks & watch-outs
- Climate carrying-cost: moderate wind risk, 25% chance of damaging wind over 30y; extreme-heat days projected 7→17/yr by 2055 (HVAC capex compounding) — expect insurance premiums to compound above CPI over the hold.
Questions for the listing agent
- Have any recent inspections been done? Can we get a copy of the seller's disclosures and any deferred-maintenance estimates?
- Is there a deadline driving the sale (1031 exchange, divorce, estate, relocation)? That informs how much negotiation room exists.
- Crime grade is D in this area — have there been break-ins, vandalism, or insurance claims at this property in the last 3 years? What carrier currently insures it and at what premium?
- What's the average days-on-market for RENTAL listings here right now (not sales)? A rising rental-DOM trend means longer vacancies and softer asking-rent achievability than the comps imply.
- What's the recent tenant-quality profile in this submarket — average credit score on applications, eviction rate, late-payment / NSF rate, and stable-employment percentage? A property-management company in the area should have these aggregated.
- How much new for-sale + rental construction is in the pipeline within 1–3 miles? Heavy new supply typically softens prices + rents 12–24 months out; constrained supply supports both.
Investment metrics
- 1% rule
- 2.09% ✓
- Cap rate
- 17.85%
- Cash-on-cash
- 41.27%
- DSCR
- 2.84
- GRM
- 4.0
CMA / ARV
No comps found within radius.
Projected returns pro-forma
-3.0% appreciation · 2.67% rent growth · sell at horizon
- IRR
- 37.5%
- Equity multiple
- 2.59×
- Total profit
- $41,358
- Equity at exit
- $13,867
- IRR
- 43.9%
- Equity multiple
- 5.11×
- Total profit
- $106,958
- Equity at exit
- $8,041
Cash invested: $26,040 (down + closing). Projections, not guarantees.
Landlord ↔ Tenant lean methodology
- Overall (STATE)
- 85 Strongly Landlord-Friendly
- State North Carolina
- 85 Strongly Landlord-Friendly · R+3
- County
- — inherits STATE
- City
- — inherits STATE
ZIP-level market 28012
- Home prices YoY
- -34.5%
- Rents YoY
- 2.7%
- Active inventory
- 420
- Price-to-rent
- 4.0×
Monthly cashflow live
- Estimated rent
- $1,947 high interval (Pro) →
- Mortgage (P&I)
- −$488
- Tax est. 1.5%
- −$116 /mo · $1,395/yr
- Insurance
- −$39
- HOA
- −$0
- Vacancy / Maint / Mgmt
- −$409
- Net cashflow
- $896
Break-even live
UW: 25.0% down · 7.5% · 30yr · 1.5% tax · 5.0% vac · 8.0% maint · 8.0% mgmt
Financing live
Cash to close
- Down payment
- $23,250
- Closing costs
- $2,790
- Reserves months
- —
- Total cash needed
- —
Loan-product check · same deal, 3 products live
Conventional
25% down · 7.5% · 30yr
- Down + closing
- —
- Monthly P&I
- —
- Monthly cashflow
- —
- DSCR
- —
- Eligible?
- —
Personal DTI + credit; lowest rate.
DSCR
20% down · 8.5% · 30yr
- Down + closing
- —
- Monthly P&I
- —
- Monthly cashflow
- —
- DSCR
- —
- Eligible?
- —
No personal income docs; deal must DSCR.
Hard money
10% down · 12.0% · 12mo
- Down + closing
- —
- Monthly P&I
- —
- Monthly cashflow
- —
- DSCR
- —
- Eligible?
- —
Short-term bridge; refi at stabilization.
Rent comps 14 comps
| Address | Beds | Baths | Sqft | Rent | $/sqft | DOM | Units | Dist |
|---|---|---|---|---|---|---|---|---|
| 520 McLean Ave Belmont, NC | 1.0–3.0 | 1.0–2.5 | 982 | $2,335 | $2.38 | 1d | 17 | 0.48mi |
| 132 Pratt St Belmont, NC | 3.0 | 2.0 | 1275 | $1,990 | $1.56 | 20d | 1 | 0.57mi |
| 511 Church St Belmont, NC | 3.0 | 2.0 | 1170 | $1,850 | $1.58 | 23d | 1 | 0.65mi |
| 712 E Catawba St Belmont, NC | 3.0 | 2.0 | 1250 | $1,750 | $1.40 | 2d | 1 | 0.67mi |
| 708 E Catawba St Belmont, NC | 3.0 | 2.0 | 1400 | $1,875 | $1.34 | 11d | 1 | 0.67mi |
| 1200 River Dr Belmont, NC | 1.0–2.0 | 1.0–2.0 | 862 | $1,825 | $2.12 | 20d | 14 | 0.69mi |
| 3 Linestowe Dr Belmont, NC | 2.0 | 2.0 | 1000 | $1,565 | $1.56 | 23d | 1 | 0.70mi |
| 63 Caldwell Dr Belmont, NC | 1.0–3.0 | 1.0–2.0 | 1056 | $2,335 | $2.21 | 2d | 41 | 0.77mi |
| 844 Hawley Ave Belmont, NC | 1.0–2.0 | 1.0 | 990 | $1,669 | $1.69 | 4d | 1 | 0.86mi |
| 910 Edgemont Ave Belmont, NC | 3.0 | 1.5 | 1071 | $1,700 | $1.59 | 10d | 1 | 0.88mi |
| 409 Hawley Ave Unit 3 Belmont, NC | 2.0 | 1.5 | 816 | $1,195 | $1.46 | 4d | 1 | 0.89mi |
| 417 River Park Rd Belmont, NC | 2.0 | 2.5 | 1156 | $1,750 | $1.51 | 23d | 1 | 1.08mi |
| 102 Lincoln St Belmont, NC | 2.0 | 1.0 | 860 | $1,650 | $1.92 | 23d | 1 | 1.41mi |
| 214 Ferstl Ave Belmont, NC | 2.0 | 1.0 | 1014 | $1,250 | $1.23 | 23d | 1 | 1.50mi |
Listing history 14 events
-
2026-06-18days on market $93,000 Active 23 DOM
-
2026-06-17days on market $93,000 Active 22 DOM
-
2026-06-16days on market $93,000 Active 21 DOM
-
2026-06-15days on market $93,000 Active 20 DOM
-
2026-06-13days on market $93,000 Active 18 DOM
-
2026-06-09days on market $93,000 Active 14 DOM
-
2026-06-08days on market $93,000 Active 13 DOM
-
2026-06-07days on market $93,000 Active 12 DOM
-
2026-06-04days on market $93,000 Active 9 DOM
-
2026-06-03days on market $93,000 Active 8 DOM
-
2026-06-02days on market $93,000 Active 7 DOM
-
2026-06-01days on market $93,000 Active 6 DOM
-
2026-05-31days on market $93,000 Active 5 DOM
-
2026-05-26$93,000 Active
ⓘ Source: listings_history table (triggers on properties + properties_extension) + one-shot
backfill from property_details.listing_events for pre-trigger history.
Climate risk First Street
- Flood 1/10 Low FEMA zone X (unshaded) · 0% chance over 30 yrs
- Wildfire 3/10 Moderate
- Heat 6/10 Major 7 d/yr ≥104°F today · 17 d/yr by 30 yrs out
- Wind 5/10 Major 25% chance of damaging wind over 30 yrs
- Air quality 3/10 Moderate 3 unhealthy d/yr today · 4 by 30 yrs out
Nearby sold comps map
Loading sold comps map…
Walkable amenities ~0.75 mi
Loading nearby amenities…
Taxation est. · year 1
- Rental income
- $23,367
- − Mortgage interest
- −$5,209
- − Property taxes
- −$1,395
- − Insurance
- −$465
- − Repairs & maintenance
- −$1,869
- − Management
- −$1,869
- − Depreciation
- −$2,705
- Taxable income
- $9,853
- Est. tax owed @ 24.0%
- −$2,365
- After-tax cash flow
- $8,383/yr
For passive investors: Depreciation is non-cash, so a rental often shows a tax loss while cash-flowing — sheltering income. Rental losses are passive: they offset passive income freely, and up to $25,000/yr can offset ordinary (W-2) income if you actively participate and your MAGI is under $100k (phasing out to $0 by $150k); unused losses carry forward. On sale, claimed depreciation is recaptured at up to 25%, and gains may owe capital-gains tax (a 1031 exchange can defer both). Figures are a year-1 estimate at your 24.0% rate — not tax advice; consult a CPA.
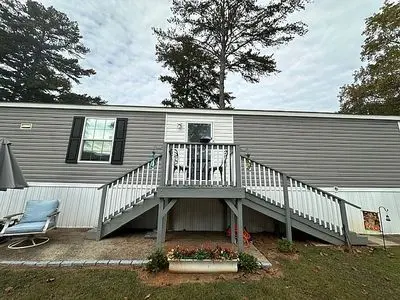
Condition & rehab AI · 2 photos
The home is in fair condition with good exterior and interior walls. Landscaping and painting improvements can significantly enhance its curb appeal and value.
Value-add opportunities
- Both Landscaping improvements — Enhanced curb appeal and increased property value
- Both Painting exterior — Fresh paint can improve the home's appearance and value
- Both Landscaping improvements — Enhanced curb appeal and increased property value
Renovation cost estimate screening
Value-add ROI direction
- Both Landscaping improvements — Enhanced curb appeal and increased property value ↑
- Both Painting exterior — Fresh paint can improve the home's appearance and value ↑
- Both Landscaping improvements — Enhanced curb appeal and increased property value ↑
ⓘ Cost ranges are severity-bucket heuristics (US national rule-of-thumb). Get contractor quotes + a written scope before underwriting a rehab budget.
Schools (NCES district)
- District
- Gaston County Schools
- NCES district ID
- 3701620
- Math proficiency
- 44% ▲ 4.00%
- Reading proficiency
- 42% ▲ 1.00%
- Median HH income
- $43,644
- Composite
- 36.39/100
- National rank
- #4680
- State rank
- #93 of 178 in NC
Livability — Belmont
- Score
- 71/100
- State rank
- #105
- US rank
- #6753
Category grades
Schools grade is shown separately in the Schools card above.
Census & demographics
- Census place
- Belmont, NC
- County
- Gaston County · 201,497 people
- City population
- 26,556
- Metro
- Charlotte-Concord-Gastonia, NC-SC
- Population (ZIP)
- 26,556
- Household income
- $83,391
- Rent vs Own
- Severe rent burden
- 778.0
Population outlook (Gaston County) Hauer SSP2
- Today (2025)
- 230,027 people
- By 2030
- 237,300 · +3.2%
- By 2040
- 249,659 · +8.5%
- By 2050
- 257,806 · +12.1%
- By 2075
- 272,163 · +18.3%
- By 2100
- 268,652 · +16.8%
Race, ethnicity, and origin ACS 2023
- Neighborhood character
- Predominantly White (84%)
- Race & ethnicity
- White 84% Black 6% Hispanic / Latino 4% Two or more races 4% Asian 4%
- Common ancestry
- Serbian 3% Romanian 2% Slovak 2%
- Foreign-born
- 4% · Canada, Vietnam, China
- Languages at home
- 93% English-only · Spanish 2% Other Indo-European 2% French/Haitian/Cajun 1%
Political lean MEDSL · Gaston
- 2024 margin
- Strong R (+25.0) · D 37.0% · R 62.1%
- 2008→2024 swing
- 0.0pp no change · 2008: -25.0pp · 2024: -25.0pp
- All cycles
- 2024: R+25.0 2020: R+27.8 2016: R+32.1 2012: R+25.6 2008: R+25.0
Not yet ingested
- Civics
- —
Market trends
- HPI YoY
- ▼ -134.92%
- Current HPI
- 255.562
- Rent YoY
- ▲ 2.67%
- Metro
- Charlotte-Concord-Gastonia, NC-SC
- State GDP YoY
- ▲ 3.28%
- F500 in state
- 26
Industry mix (Fortune 500 HQ in NC)
| Industry | F500 HQs | Revenue |
|---|---|---|
| Financial Services | 2 | $213B |
|
||
| Retail | 2 | $95B |
|
||
| Industrial Conglomerate | 1 | $38B |
|
||
| Metals / Steel | 1 | $35B |
|
||
| Utilities | 1 | $30B |
|
||
| Industrial Machinery | 1 | $19B |
|
||
Price history
1 event — show timeline
- 2026-05-26 Listed $93,000 FSBO.com
Cash-flow waterfall
monthlySold comps — $/sqft
last 12 mo · ≤1 miLoading sold comps…