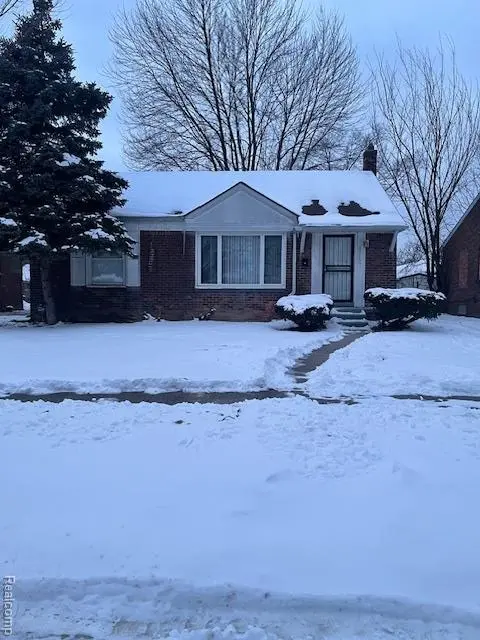
20157 Cheyenne St · Detroit, MI
Flood risk 1/10 · Minimal
- FEMA flood zone
- X (unshaded)
- Chance of flooding over 30 yrs
- 0.0%
- Est. flood insurance / yr
- $473 – $860
Fire risk 1/10 · Minimal
- Est. fire insurance / yr
- $784 – $1,456
Heat risk 3/10 · Minor
- Hot days now (above 97°F)
- 7 days/yr
- Hot days in 30 yrs
- 15 days/yr
Wind risk 2/10 · Minimal
- Chance of severe wind over 30 yrs
- —
Air-quality risk 3/10 · Minor
- Unhealthy air days now
- 2 days/yr
- Unhealthy air days in 30 yrs
- 5 days/yr
Risk factors via First Street. Map © Google.
Why this score? — see what drove the C grade
The composite is a weighted blend of 9 inputs, each scored 0–100. Each bar is that input's sub-score; the figure is the points it added to the 100-point composite (weight × sub-score).
- Cash flow +25.8/30.0
- DSCR +8.6/10.0
- ARV discount +7.5/15.0
- 1% rule +6.2/10.0
- Livability +3.7/5.0
- Rent growth +3.3/5.0
- Condition / age +2.5/5.0
- Schools +1.3/10.0
- Appreciation +0.0/10.0
$119,000
🖨 Deal sheet 📄 Offer letter ✓ Due diligence
Listing remarks MLS
This newly updated home is waiting to be called yours. The home features hardwood floors throughout, porcelain floors and walls in the bathroom with a new toilet and sink/vanity, new bath lighting, new kitchen cabinets with porcelain floor, granite counter tops and attractive back splash, new stainless steal deep sink, faucet with sprayer option, new kitchen lighting with night mode and ceiling fan all in one. Licensed Agent must attend all showings. Measurements are estimated. Mechanicals to be installed before closing. The AC unit will NOT be replaced.
Key facts
- Porcelain floors
- New kitchen cabinets
- Granite counter tops
Tags
Neighborhood map
What this means for you Summary
Snapshot
- This is a 2-bed/1.0-bath single-family listed at $119k.
Deal economics
- At list price, monthly cash flow is $287 ($3k/yr) — positive.
- The deal already cash-flows at list — no discount required.
- Meets the 1% rule at list price ($1k rent vs $119k).
- Recommended offer: $108k (9.0% below list) — sets the bar for market timing.
Location & tenants
- Location reads 73/100 on livability (#218 in MI) — a middle-class / working-renter tenant base. Strengths: amenities A+, commute A+, cost of living A+; Watch: schools F, crime F, employment F.
- Detroit Public Schools Community District (urban): math 10% / reading 24% proficiency, ranked #499 of 540 in MI (top 92%) — low school quality limits family demand, transient renter base, plan for 1-2y turnover; 90% free/reduced lunch — lower-income household profile, screen leases tightly.
- Market conditions: Rents rising (+3.2%/yr); 283 active listings in the ZIP; 40 comparable units currently listed for rent nearby; rentals at typical pace (median 25d on market — plan ~3-4 weeks tenant-placement turnaround); lower-income renter base — watch delinquency; 2,639 units permitted in Wayne County in 2024 (1,216 in 5+ unit buildings).
- This rent runs 41% of the median local income ($39k/yr) — at the standard rent-burdened threshold; future hikes will face affordability resistance.
Forward outlook
- Local home prices are declining (-3.0%/yr); year-one equity from $823 of loan paydown is wiped out by about $4k of value loss. Plan a longer hold.
- Wayne County population projected at -17% by 2050 — secular population decline; favor cash flow + early exit over multi-decade hold.
Negotiation context
- It's been on market 112 days — a 9% lower offer ($108k) is reasonable based on typical stale-listing flexibility.
- 13 sale attempts since 22y ago with the ask held roughly flat each time — persistent listings suggest the price (not the market) is what's stuck; bring a comps-based counter.
- Current owner paid $88k; 35% above their basis — modest negotiation headroom, anchor on the comps not their cost.
Risks & watch-outs
- Watch-outs: built in 1948 — expect roof / HVAC / electrical / plumbing capex.
Questions for the listing agent
- It's been on market 112 days. Have you received any prior offers? Is the seller open to a 9% concession, seller financing, or rate buy-down credit?
- Built in 1948 — when were the roof, HVAC, electrical panel, plumbing, and water heater last replaced?
- Why hasn't it sold? Are there any deal-killer items the seller is aware of (foundation, flood, title, zoning, code violations)?
- Is there a deadline driving the sale (1031 exchange, divorce, estate, relocation)? That informs how much negotiation room exists.
- Schools are F-rated, which usually means shorter tenancies and higher turnover. Who's the typical renter profile here, and what's been the actual vacancy rate?
- Crime grade is F in this area — have there been break-ins, vandalism, or insurance claims at this property in the last 3 years? What carrier currently insures it and at what premium?
- What's the average days-on-market for RENTAL listings here right now (not sales)? A rising rental-DOM trend means longer vacancies and softer asking-rent achievability than the comps imply.
- What's the recent tenant-quality profile in this submarket — average credit score on applications, eviction rate, late-payment / NSF rate, and stable-employment percentage? A property-management company in the area should have these aggregated.
- How much new for-sale + rental construction is in the pipeline within 1–3 miles? Heavy new supply typically softens prices + rents 12–24 months out; constrained supply supports both.
Investment metrics
- 1% rule
- 1.12% ✓
- Cap rate
- 9.19%
- Cash-on-cash
- 10.35%
- DSCR
- 1.46
- GRM
- 7.5
CMA / ARV
- ARV (median comp)
- $79,049
- List price
- $119,000
- Delta
- 50.54%
- Verdict
- OVERPRICED
- Comps
- 20 within 1.0 mi
Show comp detail 12 sales within ~0.75 mi
| Address | Dist | Beds/Ba | Sqft | Sold | Price | $/sf | Match |
|---|---|---|---|---|---|---|---|
| 19484 Schaefer Hwy | 0.41mi | 2/1.0 | 1,000 (-1%) | 2mo | $50,000 | $50 | 77 |
| 20403 Manor St | 0.35mi | 3/2.0 (+1) | 968 (-4%) | 2mo | $57,000 | $59 | 65 |
| 20496 Mark Twain St | 0.60mi | 3/1.5 (+1) | 1,024 (+1%) | 2mo | $135,000 | $132 | 62 |
| 20209 Meyers Rd | 0.28mi | 2/1.0 | 864 (-15%) | 1mo | $40,000 | $46 | 61 |
| 20025 Hubbell St | 0.72mi | 3/1.0 (+1) | 1,022 (+1%) | 1mo | $59,500 | $58 | 59 |
| 20047 Monte Vista St | 0.40mi | 2/1.5 | 877 (-14%) | 1mo | $69,999 | $80 | 56 |
| 19159 Meyers Rd | 0.71mi | 2/1.0 | 1,094 (+8%) | 3mo | $87,500 | $80 | 52 |
| 20484 Appoline St | 0.31mi | 3/2.0 (+1) | 1,150 (+13%) | 3mo | $182,000 | $158 | 51 |
| 20522 Ardmore St | 0.50mi | 3/1.5 (+1) | 1,133 (+12%) | 1mo | $1,400 | $1 | 50 |
| 20428 Monte Vista St | 0.44mi | 3/1.0 (+1) | 872 (-14%) | 2mo | $55,000 | $63 | 49 |
| 19161 Meyers Rd | 0.70mi | 2/1.0 | 894 (-12%) | 3mo | $87,500 | $98 | 45 |
| 19193 Lesure St | 0.70mi | 2/2.0 | 909 (-10%) | 1mo | $140,000 | $154 | 45 |
Match score weights: distance 35% · size 25% · config 20% · recency 20%. Top-matched comps best support the ARV.
Projected returns pro-forma
-3.0% appreciation · 3.25% rent growth · sell at horizon
- IRR
- -0.5%
- Equity multiple
- 0.98×
- Total profit
- $-663
- Equity at exit
- $17,743
- IRR
- 9.4%
- Equity multiple
- 1.73×
- Total profit
- $24,306
- Equity at exit
- $10,289
Cash invested: $33,320 (down + closing). Projections, not guarantees.
Landlord ↔ Tenant lean methodology
- Overall (STATE)
- 62 Landlord-Friendly
- State Michigan
- 62 Landlord-Friendly · EVEN
- County
- — inherits STATE
- City
- — inherits STATE
ZIP-level market 48235
- Rents YoY
- 3.2%
- Active inventory
- 283
- Price-to-rent
- 7.5×
Monthly cashflow live
- Estimated rent
- $1,330 high interval (Pro) →
- Mortgage (P&I)
- −$624
- Tax from tax record
- −$90 /mo · $1,074/yr
- Insurance
- −$50
- HOA
- −$0
- Vacancy / Maint / Mgmt
- −$279
- Net cashflow
- $287
Break-even live
UW: 25.0% down · 7.5% · 30yr · 1.5% tax · 5.0% vac · 8.0% maint · 8.0% mgmt
Financing live
Cash to close
- Down payment
- $29,750
- Closing costs
- $3,570
- Reserves months
- —
- Total cash needed
- —
Loan-product check · same deal, 3 products live
Conventional
25% down · 7.5% · 30yr
- Down + closing
- —
- Monthly P&I
- —
- Monthly cashflow
- —
- DSCR
- —
- Eligible?
- —
Personal DTI + credit; lowest rate.
DSCR
20% down · 8.5% · 30yr
- Down + closing
- —
- Monthly P&I
- —
- Monthly cashflow
- —
- DSCR
- —
- Eligible?
- —
No personal income docs; deal must DSCR.
Hard money
10% down · 12.0% · 12mo
- Down + closing
- —
- Monthly P&I
- —
- Monthly cashflow
- —
- DSCR
- —
- Eligible?
- —
Short-term bridge; refi at stabilization.
Rent comps 40 comps
| Address | Beds | Baths | Sqft | Rent | $/sqft | DOM | Units | Dist |
|---|---|---|---|---|---|---|---|---|
| 20426 Tracey St Detroit, MI | 3.0 | 1.0 | 1200 | $1,200 | $1.00 | 24d | 1 | 0.30mi |
| 20245 Manor Detroit, MI | 3.0 | 1.0 | 1018 | $1,400 | $1.38 | 2d | 1 | 0.36mi |
| 20122 Manor St Detroit, MI | 3.0 | 1.0 | 1028 | $1,200 | $1.17 | 43d | 1 | 0.37mi |
| 19474 Schaefer Hwy Detroit, MI | 2.0 | 1.0 | 896 | $1,075 | $1.20 | 5d | 1 | 0.39mi |
| 19929 Monte Vista St Detroit, MI | 3.0 | 1.0 | 860 | $1,450 | $1.69 | 17d | 1 | 0.43mi |
| 20032 Monte Vista St Detroit, MI | 3.0 | 1.0 | 1000 | $1,294 | $1.29 | 20d | 1 | 0.43mi |
| 20429 Monte Vista St Detroit, MI | 3.0 | 1.0 | 872 | $1,300 | $1.49 | 17d | 1 | 0.43mi |
| 20042 Freeland St Detroit, MI | 3.0 | 1.5 | 1445 | $1,400 | $0.97 | 16d | 1 | 0.49mi |
| 20460 Griggs St Detroit, MI | 2.0 | 1.0 | 910 | $1,100 | $1.21 | 17d | 1 | 0.68mi |
| 20515 Ilene St Detroit, MI | 3.0 | 1.0 | 891 | $1,450 | $1.63 | 43d | 1 | 0.72mi |
| 20445 Kentucky St Detroit, MI | 3.0 | 1.0 | 1046 | $1,200 | $1.15 | 24d | 1 | 0.86mi |
| 18675 Meyers Rd Unit 18677 Detroit, MI | 2.0 | 1.0 | 942 | $1,100 | $1.17 | 43d | 1 | 0.90mi |
| 20185 Indiana St Detroit, MI | 2.0 | 1.5 | 1096 | $1,275 | $1.16 | 43d | 1 | 0.90mi |
| 20458 Indiana St Detroit, MI | 3.0 | 1.0 | 1049 | $1,300 | $1.24 | 18d | 1 | 0.94mi |
| 18512 Schaefer Hwy Detroit, MI | 2.0 | 1.0 | 962 | $1,200 | $1.25 | 24d | 1 | 0.96mi |
| 20009 Wisconsin St Detroit, MI | 3.0 | 1.5 | 1051 | $1,400 | $1.33 | 17d | 1 | 0.96mi |
| 21800 Coolidge Hwy Oak Park, MI | 1.0–2.0 | 1.0 | 938 | $1,300 | $1.39 | 24d | 3 | 0.99mi |
| 21860 Coolidge Hwy #107 Oak Park, MI | 1.0 | 1.0 | 700 | $1,100 | $1.57 | 24d | 1 | 1.02mi |
| 21880 Coolidge Hwy #203 Oak Park, MI | 2.0 | 1.0 | 938 | $1,300 | $1.39 | 24d | 1 | 1.02mi |
| 21850 Coolidge Hwy #203 Oak Park, MI | 3.0 | 2.0 | 1100 | $1,700 | $1.55 | 5d | 1 | 1.02mi |
| 21374 Ithaca Ave Ferndale, MI | 3.0 | 1.0 | 996 | $1,775 | $1.78 | 24d | 1 | 1.04mi |
| 20110 Northlawn St Detroit, MI | 3.0 | 1.0 | 1100 | $1,350 | $1.23 | 17d | 1 | 1.15mi |
| 22108 Dante St Oak Park, MI | 2.0 | 1.0 | 898 | $1,250 | $1.39 | 24d | 1 | 1.17mi |
| 18935 Indiana St Detroit, MI | 3.0 | 1.0 | 1248 | $1,523 | $1.22 | 5d | 1 | 1.19mi |
| 18964 Coyle St Detroit, MI | 3.0 | 1.0 | 1300 | $1,350 | $1.04 | 2d | 1 | 1.19mi |
| 22148 Dante St #211 Oak Park, MI | 2.0 | 1.0 | 916 | $1,475 | $1.61 | 24d | 1 | 1.21mi |
| 22148 Dante St #212 Oak Park, MI | 2.0 | 2.0 | 916 | $1,475 | $1.61 | 22d | 1 | 1.21mi |
| 22148 Dante St #211 Oak Park, MI | 2.0 | 2.0 | 916 | $1,475 | $1.61 | 18d | 1 | 1.21mi |
| 22108 Dante St #115 Oak Park, MI | 2.0 | 2.0 | 898 | $1,250 | $1.39 | 24d | 1 | 1.23mi |
| 20045 Greenlawn St Detroit, MI | 3.0 | 1.0 | 925 | $1,350 | $1.46 | 43d | 1 | 1.26mi |
| 18257 Mark Twain St Detroit, MI | 3.0 | 1.0 | 1185 | $1,507 | $1.27 | 16d | 1 | 1.26mi |
| 10400 Saratoga St Oak Park, MI | 2.0 | 1.0 | 829 | $1,450 | $1.75 | 5d | 1 | 1.28mi |
| 18010 Lesure St Detroit, MI | 3.0 | 1.0 | 1010 | $1,550 | $1.53 | 24d | 1 | 1.32mi |
| 12800 W 9 Mile Rd Oak Park, MI | 1.0–2.0 | 1.0 | 775 | $1,250 | $1.61 | 24d | 1 | 1.35mi |
| 20555 Motor Dr Detroit, MI | 1.0–2.0 | 1.0 | 750 | $1,222 | $1.63 | 15d | 5 | 1.36mi |
| 14051 W Nine Mile Rd Oak Park, MI | 2.0 | 1.0 | 900 | $1,100 | $1.22 | 24d | 1 | 1.37mi |
| 22811 Rosewood St Oak Park, MI | 3.0 | 1.0 | 1000 | $1,600 | $1.60 | 24d | 1 | 1.43mi |
| 10020 Corning St Oak Park, MI | 2.0 | 1.0 | 829 | $1,400 | $1.69 | 24d | 1 | 1.43mi |
| 21697 Greenfield Rd Unit A-219 Oak Park, MI | 1.0 | 1.0 | 714 | $1,774 | $2.48 | 24d | 1 | 1.45mi |
| 17540 Pinehurst St Detroit, MI | 3.0 | 1.0 | 1200 | $1,395 | $1.16 | 43d | 1 | 1.47mi |
Listing history 40 events
-
2026-05-07status Pending 560-char remark
Show marketing remark (560 chars)
This newly updated home is waiting to be called yours. The home features hardwood floors throughout, porcelain floors and walls in the bathroom with a new toilet and sink/vanity, new bath lighting, new kitchen cabinets with porcelain floor, granite counter tops and attractive back splash, new stainless steal deep sink, faucet with sprayer option, new kitchen lighting with night mode and ceiling fan all in one. Licensed Agent must attend all showings. Measurements are estimated. Mechanicals to be installed before closing. The AC unit will NOT be replaced.
-
2026-01-14$119,000 Active 560-char remark
Show marketing remark (560 chars)
This newly updated home is waiting to be called yours. The home features hardwood floors throughout, porcelain floors and walls in the bathroom with a new toilet and sink/vanity, new bath lighting, new kitchen cabinets with porcelain floor, granite counter tops and attractive back splash, new stainless steal deep sink, faucet with sprayer option, new kitchen lighting with night mode and ceiling fan all in one. Licensed Agent must attend all showings. Measurements are estimated. Mechanicals to be installed before closing. The AC unit will NOT be replaced.
-
2025-10-23historical
-
2025-09-19price $119,000
-
2025-09-19price $119,000
-
2025-07-31price $129,000
-
2025-07-31price $129,000
-
2025-04-08price $139,000
-
2025-04-08price $129,000
-
2025-04-08price $139,000
-
2025-04-08price $129,000
-
2025-02-27$155,000 Active
-
2025-02-26$155,000 Active
-
2024-05-20historical
-
2024-05-20historical
-
2024-01-25status Active
-
2024-01-25status Active
-
2024-01-14historical
-
2024-01-01historical
-
2024-01-01historical
-
2023-12-31historical
-
2023-12-26$65,000 Active
-
2023-12-26$65,000
-
2023-06-29$65,000 Active
-
2023-06-29$65,000 Active
-
2022-01-26status Pending
-
2022-01-26status Pending
-
2022-01-25historical
-
2022-01-25historical
-
2021-09-09price $63,000
-
2021-09-08price $63,000
-
2021-08-15price $75,000
-
2021-08-15price $75,000
-
2021-08-15$63,000 Active
-
2021-08-15$63,000 Active
-
2005-03-15soldstatus $88,000
-
2004-12-15soldstatus $88,000
-
2004-11-16$88,000
ⓘ Source: listings_history table (triggers on properties + properties_extension) + one-shot
backfill from property_details.listing_events for pre-trigger history.
Tax reassessment forecast MI · Partial reset (capped growth)
- Current annual tax
- $1,074 · $90/mo
- Projected year-2 tax
- $1,453 · $121/mo
- Expected delta
- +$379/yr (+$32/mo · 35.3%)
ⓘ Screening estimate from a state-policy table — verify with the county assessor before closing.
Climate risk First Street
- Flood 1/10 Low FEMA zone X (unshaded) · 0% chance over 30 yrs
- Wildfire 1/10 Low
- Heat 3/10 Moderate 7 d/yr ≥97°F today · 15 d/yr by 30 yrs out
- Wind 2/10 Low
- Air quality 3/10 Moderate 2 unhealthy d/yr today · 5 by 30 yrs out
Nearby sold comps map
Loading sold comps map…
Walkable amenities ~0.75 mi
Loading nearby amenities…
Taxation est. · year 1
- Rental income
- $15,957
- − Mortgage interest
- −$6,666
- − Property taxes
- −$1,074
- − Insurance
- −$595
- − Repairs & maintenance
- −$1,277
- − Management
- −$1,277
- − Depreciation
- −$3,462
- Taxable income
- $1,607
- Est. tax owed @ 24.0%
- −$386
- After-tax cash flow
- $3,063/yr
For passive investors: Depreciation is non-cash, so a rental often shows a tax loss while cash-flowing — sheltering income. Rental losses are passive: they offset passive income freely, and up to $25,000/yr can offset ordinary (W-2) income if you actively participate and your MAGI is under $100k (phasing out to $0 by $150k); unused losses carry forward. On sale, claimed depreciation is recaptured at up to 25%, and gains may owe capital-gains tax (a 1031 exchange can defer both). Figures are a year-1 estimate at your 24.0% rate — not tax advice; consult a CPA.
Schools (NCES district)
- District
- Detroit Public Schools Community District
- NCES district ID
- 2601103
- Math proficiency
- 10% ▼ -2.00%
- Reading proficiency
- 24% ▲ 6.00%
- Median HH income
- $25,815
- Composite
- 13.06/100
- National rank
- #9564
- State rank
- #499 of 540 in MI
Livability — Detroit
- Score
- 73/100
- State rank
- #218
- US rank
- #5427
Category grades
Schools grade is shown separately in the Schools card above.
Census & demographics
- Census place
- Detroit, MI
- County
- Wayne County · 1,562,939 people
- City population
- 572,865
- Metro
- Detroit-Warren-Dearborn, MI
- Population (ZIP)
- 45,600
- Household income
- $39,265
- Rent vs Own
- Severe rent burden
- 3064.0
Population outlook (Wayne County) Hauer SSP2
- Today (2025)
- 1,675,273 people
- By 2030
- 1,620,300 · -3.3%
- By 2040
- 1,502,341 · -10.3%
- By 2050
- 1,384,039 · -17.4%
- By 2075
- 1,124,592 · -32.9%
- By 2100
- 881,193 · -47.4%
Race, ethnicity, and origin ACS 2023
- Neighborhood character
- Predominantly Black (94%)
- Race & ethnicity
- Black 94% White 3% Two or more races 2% Hispanic / Latino 1%
- Foreign-born
- 1% · Canada
- Languages at home
- 98% English-only · Spanish 1%
Political lean MEDSL · Wayne
- 2024 margin
- Strong D (+29.0) · D 62.7% · R 33.7% · Other 3.6%
- 2008→2024 swing
- -20.5pp toward R · 2008: 49.5pp · 2024: 29.0pp
- All cycles
- 2024: D+29.0 2020: D+38.1 2016: D+37.3 2012: D+46.9 2008: D+49.5
Not yet ingested
- Civics
- —
Market trends
- HPI YoY
- ▼ -153.02%
- Current HPI
- 263.6326
- Rent YoY
- ▲ 3.25%
- Metro
- Detroit-Warren-Dearborn, MI
- State GDP YoY
- ▲ 1.37%
- F500 in state
- 28
Industry mix (Fortune 500 HQ in MI)
| Industry | F500 HQs | Revenue |
|---|---|---|
| Automotive Parts | 3 | $48B |
|
||
| Automotive | 2 | $372B |
|
||
| Chemicals | 1 | $45B |
|
||
| Automotive Retail | 1 | $29B |
|
||
| Healthcare / Medical Devices | 1 | $23B |
|
||
| Automotive Technology | 1 | $20B |
|
||
Price history
+35.2% since first listed40 events — show timeline
- 2026-05-07 Pending — REALCOMP
- 2026-05-07 Pending — MiRealSource-MiMLS
- 2026-01-14 Listed $119,000 MiRealSource-MiMLS
- 2026-01-14 Listed $119,000 REALCOMP
- 2025-10-23 Listing Removed — MiRealSource-MiMLS
- 2025-09-19 Price Changed $119,000 MiRealSource-MiMLS
- 2025-09-19 Price Changed $119,000 REALCOMP
- 2025-07-31 Price Changed $129,000 MiRealSource-MiMLS
- 2025-07-31 Price Changed $129,000 REALCOMP
- 2025-04-08 Price Changed $139,000 MiRealSource-MiMLS
- 2025-04-08 Price Changed $129,000 MiRealSource-MiMLS
- 2025-04-08 Price Changed $139,000 REALCOMP
- 2025-04-08 Price Changed $129,000 REALCOMP
- 2025-02-27 Listed $155,000 REALCOMP
- 2025-02-26 Listed $155,000 MiRealSource-MiMLS
- 2024-05-20 Listing Removed — MiRealSource-MiMLS
- 2024-05-20 Listing Removed — REALCOMP
- 2024-01-25 Relisted — MiRealSource-MiMLS
- 2024-01-25 Relisted — REALCOMP
- 2024-01-14 Listing Removed — MiRealSource-MiMLS
- 2024-01-01 Listing Removed — MiRealSource-MiMLS
- 2024-01-01 Listing Removed — REALCOMP
- 2023-12-31 Listing Removed — REALCOMP
- 2023-12-26 Listed $65,000 MiRealSource-MiMLS
- 2023-12-26 Listed $65,000 REALCOMP
- 2023-06-29 Listed $65,000 MiRealSource-MiMLS
- 2023-06-29 Listed $65,000 REALCOMP
- 2022-01-26 Pending — MiRealSource-MiMLS
- 2022-01-26 Pending — REALCOMP
- 2022-01-25 Listing Removed — MiRealSource-MiMLS
- 2022-01-25 Listing Removed — REALCOMP
- 2021-09-09 Price Changed $63,000 MiRealSource-MiMLS
- 2021-09-08 Price Changed $63,000 REALCOMP
- 2021-08-15 Price Changed $75,000 MiRealSource-MiMLS
- 2021-08-15 Price Changed $75,000 REALCOMP
- 2021-08-15 Listed $63,000 MiRealSource-MiMLS
- 2021-08-15 Listed $63,000 REALCOMP
- 2005-03-15 Sold (Public Records) $88,000 Public Records
- 2004-12-15 Sold (MLS) $88,000 REALCOMP
- 2004-11-16 Listed $88,000 REALCOMP
Property tax history
+1.2%/yrLatest (2025): $1,074 · -8.4% YoY. Source: county tax records.
Cash-flow waterfall
monthlySold comps — $/sqft
last 12 mo · ≤1 miLoading sold comps…