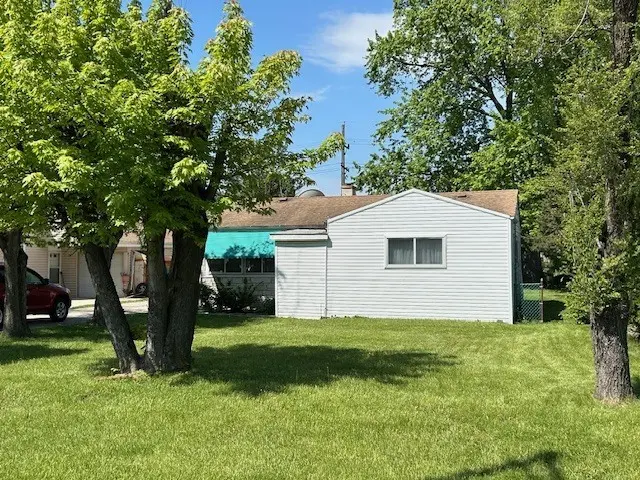
3116 N Wolf Rd · Franklin Park, IL
Flood risk 1/10 · Minimal
- FEMA flood zone
- X (unshaded)
- Chance of flooding over 30 yrs
- 0.0%
- Est. flood insurance / yr
- $473 – $860
Fire risk 1/10 · Minimal
- Est. fire insurance / yr
- $804 – $1,492
Heat risk 3/10 · Minor
- Hot days now (above 100°F)
- 7 days/yr
- Hot days in 30 yrs
- 14 days/yr
Wind risk 2/10 · Minimal
- Chance of severe wind over 30 yrs
- —
Air-quality risk 4/10 · Minor
- Unhealthy air days now
- 6 days/yr
- Unhealthy air days in 30 yrs
- 7 days/yr
Risk factors via First Street. Map © Google.
Why this score? — see what drove the C+ grade
The composite is a weighted blend of 9 inputs, each scored 0–100. Each bar is that input's sub-score; the figure is the points it added to the 100-point composite (weight × sub-score).
- Cash flow +22.8/30.0
- ARV discount +15.0/15.0
- DSCR +7.3/10.0
- 1% rule +6.6/10.0
- Livability +3.9/5.0
- Rent growth +2.5/5.0
- Condition / age +2.5/5.0
- Schools +1.6/10.0
- Appreciation +0.0/10.0
$222,777
🖨 Deal sheet 📄 Offer letter ✓ Due diligence
Listing remarks
3 Bedroom 1 bath ranch with a family room and 2 car garage with driveway - No FHA or VA - Only Conventional or CASH To be sold as is 24-hour notice
Key facts
- 0.23 acre lot
- 2 garage spots
- Built 1954
Property features AI
Finance
- Other: Fee simple ownership; Possession at closing; Property located in Melrose Park (Leyden township)
- HOA & community: No master association fee required
Exterior
- Parking: Detached garage with side driveway (2 garage spaces, 2 total parking spaces)
- Utilities: Lake Michigan water source; Public sewer
- Home design: Detached single-family home; One-story
- Construction: Cedar and frame construction; Built approximately 71–80 years ago; Built before 1978
- Exterior features: Lot dimensions approximately 60 x 167; Lot smaller than 0.25 acre; School bus and commuter bus service nearby
Interior
- Kitchen: Kitchen on main level (12 x 12)
- Bedrooms: Master bedroom on main level (13 x 10); Bedroom on main level (10 x 9); Bedroom on main level (10 x 10)
- Bathrooms: 1 full bathroom
- Heating & cooling: Natural gas forced air heating; Central air conditioning
- Interior features: Six total rooms; Dining room; Family room; Living room
- Laundry & utility: Laundry room
Neighborhood map
What this means for you Summary
Snapshot
- This is a 3-bed/1.0-bath single-family listed at $223k.
Deal economics
- At list price, monthly cash flow is $388 ($5k/yr) — positive.
- The deal already cash-flows at list — no discount required.
- Meets the 1% rule at list price ($3k rent vs $223k).
- Cap rate 8.4% vs local median 3.7% in Franklin Park — top-decile yield for the area; either an underpriced asset or a hidden risk that comps aren't pricing in. Stress-test before assuming the spread holds.
Location & tenants
- Location reads 78/100 on livability (#139 in IL, #2,523 nationally) — a middle-class / working-renter tenant base. Strengths: commute A+, housing A+, employment A-; Watch: schools C-, health & safety C-.
- Leyden Chsd 212 (suburban): math 15% / reading 20% proficiency, ranked #451 of 620 in IL (top 73%) — low school quality limits family demand, transient renter base, plan for 1-2y turnover.
- Market conditions: 26 active listings in the ZIP; 1 comparable units currently listed for rent nearby; 6,272 units permitted in Cook County in 2024 (4,658 in 5+ unit buildings).
Forward outlook
- Local home prices are declining (-3.0%/yr); year-one equity from $2k of loan paydown is wiped out by about $7k of value loss. Plan a longer hold.
Negotiation context
- Only 5 days on market — expect competitive offers; lowballing is unlikely to land.
- Current owner paid $86k; list at $223k implies a 159% gain — meaningful room to come down on a strong offer.
Risks & watch-outs
- Watch-outs: built in 1954 — expect roof / HVAC / electrical / plumbing capex.
Questions for the listing agent
- Built in 1954 — when were the roof, HVAC, electrical panel, plumbing, and water heater last replaced?
- Is there a deadline driving the sale (1031 exchange, divorce, estate, relocation)? That informs how much negotiation room exists.
- What's the average days-on-market for RENTAL listings here right now (not sales)? A rising rental-DOM trend means longer vacancies and softer asking-rent achievability than the comps imply.
- What's the recent tenant-quality profile in this submarket — average credit score on applications, eviction rate, late-payment / NSF rate, and stable-employment percentage? A property-management company in the area should have these aggregated.
- How much new for-sale + rental construction is in the pipeline within 1–3 miles? Heavy new supply typically softens prices + rents 12–24 months out; constrained supply supports both.
Investment metrics
- 1% rule
- 1.16% ✓
- Cap rate
- 8.38%
- Cash-on-cash
- 7.47%
- DSCR
- 1.33
- GRM
- 7.2
CMA / ARV
- ARV (on-the-fly)
- $297,959
- Comps found
- 12
Show comp detail 12 sales within ~0.75 mi
| Address | Dist | Beds/Ba | Sqft | Sold | Price | $/sf | Match |
|---|---|---|---|---|---|---|---|
| 3129 Derrough Ave | 0.20mi | 3/2.0 | 1,100 (+7%) | 3mo | $340,000 | $309 | 73 |
| 10912 W Grand Ave | 0.47mi | 2/1.0 (-1) | 1,013 (-2%) | 6mo | $280,000 | $276 | 66 |
| 3020 Lee St | 0.53mi | 3/1.0 | 1,020 (-1%) | 12mo | $300,000 | $294 | 64 |
| 3131 N Prater Ave | 0.16mi | 2/2.0 (-1) | 1,152 (+12%) | 1mo | $295,000 | $256 | 63 |
| 2756 Landen Dr | 0.73mi | 3/1.0 | 1,001 (-3%) | 3mo | $288,999 | $289 | 59 |
| 3106 Martin Ave | 0.31mi | 4/1.0 (+1) | 1,130 (+10%) | 9mo | $339,900 | $301 | 57 |
| 10810 Barry Ave | 0.50mi | 3/1.0 | 987 (-4%) | 19mo | $275,000 | $279 | 54 |
| 3039 Alta St | 0.43mi | 2/1.0 (-1) | 1,076 (+4%) | 19mo | $210,000 | $195 | 52 |
| 10828 W Grand Ave | 0.55mi | 3/2.5 | 1,119 (+8%) | 9mo | $335,000 | $299 | 47 |
| 3012 Rhodes Ave | 0.48mi | 2/1.0 (-1) | 885 (-14%) | 3mo | $275,000 | $311 | 46 |
| 3126 Lee St | 0.51mi | 3/2.0 | 1,128 (+9%) | 22mo | $290,000 | $257 | 38 |
| 2835 Rhodes Ave | 0.54mi | 2/1.0 (-1) | 1,163 (+13%) | 15mo | $160,000 | $138 | 36 |
Match score weights: distance 35% · size 25% · config 20% · recency 20%. Top-matched comps best support the ARV.
Projected returns pro-forma
-3.0% appreciation · 3.0% rent growth · sell at horizon
- IRR
- -4.8%
- Equity multiple
- 0.82×
- Total profit
- $-11,269
- Equity at exit
- $33,217
- IRR
- 4.9%
- Equity multiple
- 1.36×
- Total profit
- $22,478
- Equity at exit
- $19,262
Cash invested: $62,378 (down + closing). Projections, not guarantees.
Landlord ↔ Tenant lean methodology
- Overall (STATE)
- 43 Moderately Tenant-Leaning
- State Illinois
- 43 Moderately Tenant-Leaning · D+7
- County
- — inherits STATE
- City
- — inherits STATE
ZIP-level market 60164
- Active inventory
- 26
- Price-to-rent
- 7.2×
Monthly cashflow live
- Estimated rent
- $2,595 medium interval (Pro) →
- Mortgage (P&I)
- −$1,168
- Tax from tax record
- −$401 /mo · $4,811/yr
- Insurance
- −$93
- HOA
- −$0
- Vacancy / Maint / Mgmt
- −$545
- Net cashflow
- $388
Break-even live
UW: 25.0% down · 7.5% · 30yr · 1.5% tax · 5.0% vac · 8.0% maint · 8.0% mgmt
Financing live
Cash to close
- Down payment
- $55,694
- Closing costs
- $6,683
- Reserves months
- —
- Total cash needed
- —
Loan-product check · same deal, 3 products live
Conventional
25% down · 7.5% · 30yr
- Down + closing
- —
- Monthly P&I
- —
- Monthly cashflow
- —
- DSCR
- —
- Eligible?
- —
Personal DTI + credit; lowest rate.
DSCR
20% down · 8.5% · 30yr
- Down + closing
- —
- Monthly P&I
- —
- Monthly cashflow
- —
- DSCR
- —
- Eligible?
- —
No personal income docs; deal must DSCR.
Hard money
10% down · 12.0% · 12mo
- Down + closing
- —
- Monthly P&I
- —
- Monthly cashflow
- —
- DSCR
- —
- Eligible?
- —
Short-term bridge; refi at stabilization.
Rent comps 1 comps
| Address | Beds | Baths | Sqft | Rent | $/sqft | DOM | Units | Dist |
|---|---|---|---|---|---|---|---|---|
| 153 Winters Dr Melrose Park, IL | 3.0 | 2.0 | 1278 | $2,595 | $2.03 | 10d | 1 | 0.70mi |
Listing history 5 events
-
2026-06-07statusdays on market $222,777 Pending 5 DOM
-
2026-06-04days on market $222,777 Active 3 DOM
-
2026-06-03days on market $222,777 Active 2 DOM
-
2026-06-02remarks 157-char remark
-
2026-06-02$222,777 Active 1 DOM
ⓘ Source: listings_history table (triggers on properties + properties_extension) + one-shot
backfill from property_details.listing_events for pre-trigger history.
Tax reassessment forecast IL · Partial reset (capped growth)
- Current annual tax
- $4,811 · $401/mo
- Projected year-2 tax
- $4,934 · $411/mo
- Expected delta
- +$123/yr (+$10/mo · 2.6%)
ⓘ Screening estimate from a state-policy table — verify with the county assessor before closing.
Climate risk First Street
- Flood 1/10 Low FEMA zone X (unshaded) · 0% chance over 30 yrs
- Wildfire 1/10 Low
- Heat 3/10 Moderate 7 d/yr ≥100°F today · 14 d/yr by 30 yrs out
- Wind 2/10 Low
- Air quality 4/10 Moderate 6 unhealthy d/yr today · 7 by 30 yrs out
Nearby sold comps map
Loading sold comps map…
Walkable amenities ~0.75 mi
Loading nearby amenities…
Taxation est. · year 1
- Rental income
- $31,140
- − Mortgage interest
- −$12,479
- − Property taxes
- −$4,811
- − Insurance
- −$1,114
- − Repairs & maintenance
- −$2,491
- − Management
- −$2,491
- − Depreciation
- −$6,481
- Taxable income
- $1,273
- Est. tax owed @ 24.0%
- −$306
- After-tax cash flow
- $4,351/yr
For passive investors: Depreciation is non-cash, so a rental often shows a tax loss while cash-flowing — sheltering income. Rental losses are passive: they offset passive income freely, and up to $25,000/yr can offset ordinary (W-2) income if you actively participate and your MAGI is under $100k (phasing out to $0 by $150k); unused losses carry forward. On sale, claimed depreciation is recaptured at up to 25%, and gains may owe capital-gains tax (a 1031 exchange can defer both). Figures are a year-1 estimate at your 24.0% rate — not tax advice; consult a CPA.
Schools (NCES district)
- District
- Leyden Chsd 212
- NCES district ID
- 1722740
- Math proficiency
- 15% ▼ -12.00%
- Reading proficiency
- 20% ▼ -9.00%
- Median HH income
- $55,738
- Composite
- 16.37/100
- National rank
- #9200
- State rank
- #451 of 620 in IL
Livability — Franklin Park
- Score
- 78/100
- State rank
- #139
- US rank
- #2523
Category grades
Schools grade is shown separately in the Schools card above.
Census & demographics
- City population
- 18,059
- Population (ZIP)
- 21,248
Population outlook (Cook County) Hauer SSP2
- Today (2025)
- 5,347,519 people
- By 2030
- 5,357,703 · +0.2%
- By 2040
- 5,324,924 · -0.4%
- By 2050
- 5,230,762 · -2.2%
- By 2075
- 4,785,735 · -10.5%
- By 2100
- 4,188,836 · -21.7%
Race, ethnicity, and origin ACS 2023
- Neighborhood character
- Majority Hispanic (63%)
- Race & ethnicity
- Hispanic / Latino 63% White 28% Two or more races 25% Asian 4% Black 3% Native American 2%
- Hispanic origin (detail)
- Mexican 53% Puerto Rican 6%
- Common ancestry
- Romanian 7% Italian 1% Subsaharan African 1%
- Foreign-born
- 28% · Canada, Vietnam
- Languages at home
- 42% English-only · Spanish 51% Russian/Polish/Slavic 3% Other Indo-European 1%
Political lean MEDSL · Cook
- 2024 margin
- Solid D (+42.0) · D 70.4% · R 28.4% · Other 1.2%
- 2008→2024 swing
- -11.4pp toward R · 2008: 53.4pp · 2024: 42.0pp
- All cycles
- 2024: D+42.0 2020: D+50.3 2016: D+53.0 2012: D+49.4 2008: D+53.4
Not yet ingested
- Civics
- —
Market trends
- HPI YoY
- ▼ -180.91%
- Current HPI
- 230.7126
- Rent YoY
- —
- Metro
- —
- State GDP YoY
- ▲ 1.59%
- F500 in state
- 60
Industry mix (Fortune 500 HQ in IL)
| Industry | F500 HQs | Revenue |
|---|---|---|
| Insurance | 4 | $201B |
|
||
| Consumer Goods | 4 | $87B |
|
||
| Industrial Machinery | 3 | $64B |
|
||
| Healthcare | 2 | $55B |
|
||
| Retail / Pharmacy | 1 | $148B |
|
||
| Agriculture / Food | 1 | $86B |
|
||
Price history
+159.0% since first listed2 events — show timeline
- 2026-06-01 Listed $222,777 MRED as Distributed by MLS Grid
- 1989-08-04 Sold (Public Records) $86,000 Public Records
Property tax history
+3.2%/yrLatest (2023): $4,811 · +2.9% YoY. Source: county tax records.
Cash-flow waterfall
monthlySold comps — $/sqft
last 12 mo · ≤1 miLoading sold comps…