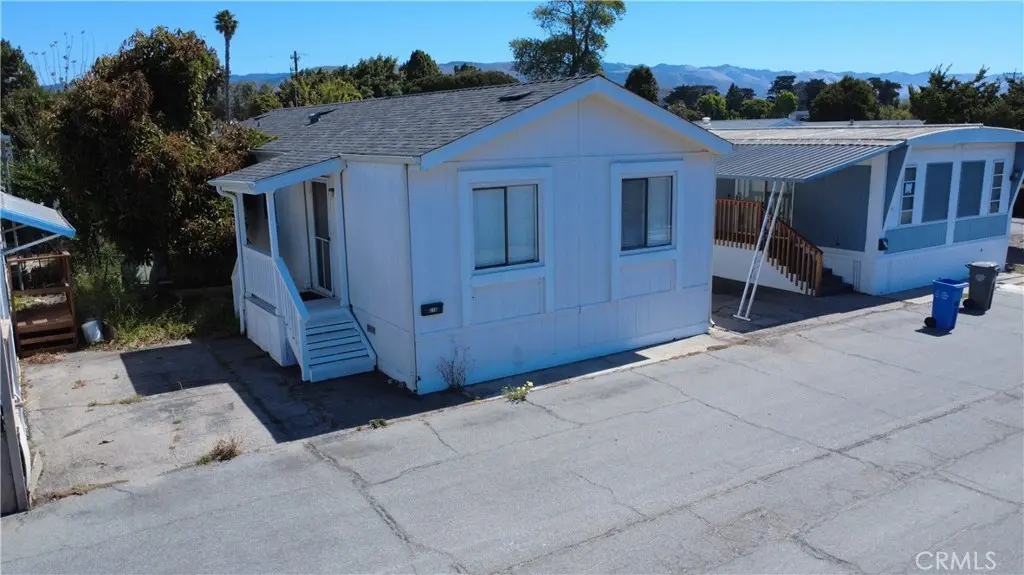
3860 S Higuera · San Luis Obispo, CA
Flood risk 5/10 · Moderate
- FEMA flood zone
- X (unshaded)
- Chance of flooding over 30 yrs
- 0.66%
- Est. flood insurance / yr
- $507 – $1,088
Fire risk 6/10 · Moderate
- Est. fire insurance / yr
- $659 – $1,223
Heat risk 4/10 · Minor
- Hot days now (above 82°F)
- 5 days/yr
- Hot days in 30 yrs
- 14 days/yr
Wind risk 1/10 · Minimal
- Chance of severe wind over 30 yrs
- —
Air-quality risk 6/10 · Moderate
- Unhealthy air days now
- 11 days/yr
- Unhealthy air days in 30 yrs
- 11 days/yr
Risk factors via First Street. Map © Google.
Why this score? — see what drove the B+ grade
The composite is a weighted blend of 9 inputs, each scored 0–100. Each bar is that input's sub-score; the figure is the points it added to the 100-point composite (weight × sub-score).
- Cash flow +30.0/30.0
- ARV discount +15.0/15.0
- 1% rule +10.0/10.0
- DSCR +10.0/10.0
- Schools +4.6/10.0
- Livability +3.7/5.0
- Rent growth +3.6/5.0
- Condition / age +2.5/5.0
- Appreciation +0.0/10.0
$210,000
🖨 Deal sheet 📄 Offer letter ✓ Due diligence
Listing remarks MLS
Live on the Beautiful Central Coast in San Luis Obispo, awesome affordable living in Silver City Mobile home park, this is a well kept beautiful family park. Home sits on a cul-de-sac, has 2 master bedrooms with 2 baths, living room and dining room, family room , nice roomy kitchen with new stove and sinks, inside laundry leads out to the long car port, may fit 2 cars. Some of the rooms has beautiful laminate flooring. Large covered front porch with built in sitting area, close to major shopping centers, delightful restaurants and so much more, nice yard with some newer fence and orange tree, plus very low space rent. close to major shopping centers, delightful restaurants and close to the many beaches, Bring your family, move in ready
Key facts
- Clubhouse
- Newer roof
- Community amenities
Tags
Property features AI
Finance
- HOA & community: Land lease of $745; Land lease community
Exterior
- Parking: Located in Silver City park
- Utilities: Public sewer; District/Public water
- Home design: Double-wide mobile home; Two total stories; Mobile home remains on site; Located in San Luis Obispo subdivision; Directions: S Higuera to Silver City
- Construction: Mobile home dimensions approximately 20 ft by 40 ft; Year built per public records
- Exterior features: Association pool; Park nearby; Community park access
Interior
- Bathrooms: Two full bathrooms
- Interior features: One-level entry; Located on entry level
- Laundry & utility: Laundry in an individual room
Neighborhood map
What this means for you Summary
Snapshot
- This is a 3-bed/2.0-bath manufactured listed at $210k.
Deal economics
- At list price, monthly cash flow is $2k ($20k/yr) — positive.
- The deal already cash-flows at list — no discount required.
- Meets the 1% rule at list price ($4k rent vs $210k).
- Cap rate 16.1% vs local median 2.1% in San Luis Obispo — top-decile yield for the area; either an underpriced asset or a hidden risk that comps aren't pricing in. Stress-test before assuming the spread holds.
Location & tenants
- Location reads 74/100 on livability (#132 in CA, #4,576 nationally) — a middle-class / working-renter tenant base. Strengths: amenities A+, commute A+, health & safety A+; Watch: crime F, cost of living F.
- San Luis Coastal Unified (urban): math 50% / reading 58% proficiency, ranked #118 of 517 in CA (top 23%) — acceptable for families but not a draw, mixed tenant base, ~2y average lease.
- Market conditions: Rents rising fast (+4.4%/yr); 143 active listings in the ZIP; 13 comparable units currently listed for rent nearby; rentals at typical pace (median 21d on market — plan ~3-4 weeks tenant-placement turnaround); 46% of comp listings sitting > 30 days — soft ceiling on asking rent; solid renter incomes; 1,104 units permitted in San Luis Obispo County in 2024 (273 in 5+ unit buildings).
- At $3,725/mo this rent would consume 46% of the median local household income ($97k/yr) (locally 2050% of renters already pay >50% of income on rent) — very limited rent-growth headroom before tenants either downsize or default.
Forward outlook
- Local home prices are declining (-3.0%/yr); year-one equity from $1k of loan paydown is wiped out by about $6k of value loss. Plan a longer hold.
- San Luis Obispo County population projected at +20% by 2050 — long-run rental-demand tailwind backs the buy-and-hold thesis.
- At projected returns (-3.0% appreciation + 4.4% rent growth), your $59k cash investment doubles in ~4 years — after that, you're playing with house money.
Negotiation context
- Only 13 days on market — expect competitive offers; lowballing is unlikely to land.
- 10 sale attempts since 11y ago with the ask held roughly flat each time — persistent listings suggest the price (not the market) is what's stuck; bring a comps-based counter.
Risks & watch-outs
- Climate carrying-cost: moderate flood risk; major wildfire risk — expect insurance premiums to compound above CPI over the hold.
Questions for the listing agent
- Is there a deadline driving the sale (1031 exchange, divorce, estate, relocation)? That informs how much negotiation room exists.
- Schools are B-rated — typically a magnet for longer-tenancy family renters. What's the average tenant stay here, and is there a school-zone premium baked into asking?
- Crime grade is F in this area — have there been break-ins, vandalism, or insurance claims at this property in the last 3 years? What carrier currently insures it and at what premium?
- What's the average days-on-market for RENTAL listings here right now (not sales)? A rising rental-DOM trend means longer vacancies and softer asking-rent achievability than the comps imply.
- What's the recent tenant-quality profile in this submarket — average credit score on applications, eviction rate, late-payment / NSF rate, and stable-employment percentage? A property-management company in the area should have these aggregated.
- How much new for-sale + rental construction is in the pipeline within 1–3 miles? Heavy new supply typically softens prices + rents 12–24 months out; constrained supply supports both.
Investment metrics
- 1% rule
- 1.77% ✓
- Cap rate
- 16.05%
- Cash-on-cash
- 34.85%
- DSCR
- 2.55
- GRM
- 4.7
CMA / ARV
- ARV (on-the-fly)
- $291,648
- Comps found
- 12
Show comp detail 12 sales within ~0.75 mi
| Address | Dist | Beds/Ba | Sqft | Sold | Price | $/sf | Match |
|---|---|---|---|---|---|---|---|
| 3860 S Higuera St #194 | 0.04mi | 3/2.0 | 1,352 (+1%) | 16mo | $280,000 | $207 | 84 |
| 3860 S Higuera St #131 | 0.04mi | 2/2.0 (-1) | 1,392 (+4%) | 6mo | $280,000 | $201 | 82 |
| 3960 S Higuera St #79 | 0.38mi | 3/2.0 | 1,359 (+1%) | 4mo | $340,000 | $250 | 77 |
| 3860 S Higuera St #217 | 0.02mi | 2/2.0 (-1) | 1,200 (-11%) | 1mo | $290,000 | $242 | 76 |
| 3860 S Higuera St #223 | 0.04mi | 3/2.0 | 1,400 (+4%) | 19mo | $375,000 | $268 | 75 |
| 3860 S Higuera St #132 | 0.04mi | 2/2.0 (-1) | 1,440 (+7%) | 19mo | $312,500 | $217 | 65 |
| 3960 S Higuera St #157 | 0.38mi | 2/2.0 (-1) | 1,260 (-6%) | 8mo | $395,000 | $313 | 60 |
| 3960 S Higuera St #196 | 0.14mi | 2/2.0 (-1) | 1,200 (-11%) | 15mo | $234,000 | $195 | 58 |
| 3960 S Higuera St #31 | 0.38mi | 3/2.0 | 1,440 (+7%) | 16mo | $228,330 | $159 | 57 |
| 3960 S Higuera #117 | 0.14mi | 2/2.0 (-1) | 1,152 (-14%) | 12mo | $230,000 | $200 | 55 |
| 3960 S Higuera #105 | 0.18mi | 2/2.0 (-1) | 1,152 (-14%) | 10mo | $249,000 | $216 | 55 |
| 3057 S Higuera St #28 | 0.75mi | 2/2.0 (-1) | 1,488 (+11%) | 17mo | $422,000 | $284 | 28 |
Match score weights: distance 35% · size 25% · config 20% · recency 20%. Top-matched comps best support the ARV.
Projected returns pro-forma
-3.0% appreciation · 4.41% rent growth · sell at horizon
- IRR
- 31.8%
- Equity multiple
- 2.36×
- Total profit
- $80,012
- Equity at exit
- $31,312
- IRR
- 39.6%
- Equity multiple
- 4.95×
- Total profit
- $232,037
- Equity at exit
- $18,157
Cash invested: $58,800 (down + closing). Projections, not guarantees.
Landlord ↔ Tenant lean methodology
- Overall (STATE)
- 18 Strongly Tenant-Friendly
- State California
- 18 Strongly Tenant-Friendly · D+13
- County
- — inherits STATE
- City
- — inherits STATE
ZIP-level market 93401
- Rents YoY
- 4.4%
- Active inventory
- 143
- Price-to-rent
- 4.7×
Monthly cashflow live
- Estimated rent
- $3,725 high interval (Pro) →
- Mortgage (P&I)
- −$1,101
- Tax from tax record
- −$46 /mo · $557/yr
- Insurance
- −$88
- HOA
- −$0
- Vacancy / Maint / Mgmt
- −$782
- Net cashflow
- $1,708
Break-even live
UW: 25.0% down · 7.5% · 30yr · 1.5% tax · 5.0% vac · 8.0% maint · 8.0% mgmt
Financing live
Cash to close
- Down payment
- $52,500
- Closing costs
- $6,300
- Reserves months
- —
- Total cash needed
- —
Loan-product check · same deal, 3 products live
Conventional
25% down · 7.5% · 30yr
- Down + closing
- —
- Monthly P&I
- —
- Monthly cashflow
- —
- DSCR
- —
- Eligible?
- —
Personal DTI + credit; lowest rate.
DSCR
20% down · 8.5% · 30yr
- Down + closing
- —
- Monthly P&I
- —
- Monthly cashflow
- —
- DSCR
- —
- Eligible?
- —
No personal income docs; deal must DSCR.
Hard money
10% down · 12.0% · 12mo
- Down + closing
- —
- Monthly P&I
- —
- Monthly cashflow
- —
- DSCR
- —
- Eligible?
- —
Short-term bridge; refi at stabilization.
Rent comps 13 comps
| Address | Beds | Baths | Sqft | Rent | $/sqft | DOM | Units | Dist |
|---|---|---|---|---|---|---|---|---|
| 1824 Homestead Pl San Luis Obispo, CA | 4.0 | 3.5 | 1869 | $5,300 | $2.84 | 43d | 1 | 0.71mi |
| 905 Madonna Rd San Luis Obispo, CA | 3.0 | 3.0–3.5 | 1459 | $4,825 | $3.31 | 13d | 2 | 0.78mi |
| 825 Madonna Rd San Luis Obispo, CA | 2.0 | 2.0 | 949 | $3,000 | $3.16 | 43d | 1 | 0.82mi |
| 915 Madonna Rd #102 San Luis Obispo, CA | 3.0 | 2.0 | 1141 | $1,685 | $1.48 | 43d | 1 | 0.83mi |
| 925 Madonna Rd #302 San Luis Obispo, CA | 3.0 | 2.0 | 1075 | $3,500 | $3.26 | 21d | 1 | 0.83mi |
| 3070 Lucca Ln San Luis Obispo, CA | 3.0 | 3.0 | 1740 | $5,000 | $2.87 | 21d | 1 | 0.88mi |
| 1704 Tonini Dr San Luis Obispo, CA | 1.0–2.0 | 1.0–2.5 | 985 | $3,445 | $3.50 | 13d | 3 | 1.04mi |
| 1559 Royal Way Unit NA San Luis Obispo, CA | 4.0 | 2.0 | 1800 | $4,900 | $2.72 | 21d | 1 | 1.26mi |
| 11343 Los Osos Valley Rd Unit 48-55G San Luis Obispo, CA | 2.0 | 1.5 | 900 | $2,400 | $2.67 | 21d | 1 | 1.28mi |
| 11343 Los Osos Valley Rd Unit 48-25D San Luis Obispo, CA | 2.0 | 2.0 | 1025 | $2,600 | $2.54 | 43d | 1 | 1.28mi |
| 11343 Los Osos Valley Rd Unit 48-21G San Luis Obispo, CA | 3.0 | 2.0 | 1225 | $3,200 | $2.61 | 43d | 1 | 1.28mi |
| 11343 Los Osos Valley Rd Unit 4843-B San Luis Obispo, CA | 2.0 | 1.5 | 900 | $2,400 | $2.67 | 43d | 1 | 1.28mi |
| 11343 Los Osos Valley Rd Unit 4855-F San Luis Obispo, CA | 2.0 | 1.5 | 900 | $2,400 | $2.67 | 13d | 1 | 1.28mi |
Listing history 11 events
-
2026-06-18days on market $210,000 Active 13 DOM
-
2026-06-17days on market $210,000 Active 12 DOM
-
2026-06-16days on market $210,000 Active 11 DOM
-
2026-06-15days on market $210,000 Active 10 DOM
-
2026-06-14days on market $210,000 Active 8 DOM
-
2026-06-13days on market $210,000 Active 7 DOM
-
2026-06-10days on market $210,000 Active 5 DOM
-
2026-06-09days on market $210,000 Active 4 DOM
-
2026-06-08days on market $210,000 Active 3 DOM
-
2026-06-07remarks 692-char remark
-
2026-06-07$210,000 Active 2 DOM
ⓘ Source: listings_history table (triggers on properties + properties_extension) + one-shot
backfill from property_details.listing_events for pre-trigger history.
Tax reassessment forecast CA · Resets to sale price
- Current annual tax
- $557 · $46/mo
- Projected year-2 tax
- $1,596 · $133/mo
- Expected delta
- +$1,039/yr (+$87/mo · 186.7%)
ⓘ Screening estimate from a state-policy table — verify with the county assessor before closing.
Climate risk First Street
- Flood 5/10 Major FEMA zone X (unshaded) · 66% chance over 30 yrs
- Wildfire 6/10 Major
- Heat 4/10 Moderate 5 d/yr ≥82°F today · 14 d/yr by 30 yrs out
- Wind 1/10 Low
- Air quality 6/10 Major 11 unhealthy d/yr today · 11 by 30 yrs out
Nearby sold comps map
Loading sold comps map…
Walkable amenities ~0.75 mi
Loading nearby amenities…
Taxation est. · year 1
- Rental income
- $44,700
- − Mortgage interest
- −$11,763
- − Property taxes
- −$557
- − Insurance
- −$1,050
- − Repairs & maintenance
- −$3,576
- − Management
- −$3,576
- − Depreciation
- −$6,109
- Taxable income
- $18,069
- Est. tax owed @ 24.0%
- −$4,337
- After-tax cash flow
- $16,155/yr
For passive investors: Depreciation is non-cash, so a rental often shows a tax loss while cash-flowing — sheltering income. Rental losses are passive: they offset passive income freely, and up to $25,000/yr can offset ordinary (W-2) income if you actively participate and your MAGI is under $100k (phasing out to $0 by $150k); unused losses carry forward. On sale, claimed depreciation is recaptured at up to 25%, and gains may owe capital-gains tax (a 1031 exchange can defer both). Figures are a year-1 estimate at your 24.0% rate — not tax advice; consult a CPA.
Schools (NCES district)
- District
- San Luis Coastal Unified
- NCES district ID
- 0634800
- Math proficiency
- 50% ▼ -14.00%
- Reading proficiency
- 58% ▼ -12.00%
- Median HH income
- $53,428
- Composite
- 46.4/100
- National rank
- #2455
- State rank
- #118 of 517 in CA
Livability — San Luis Obispo
- Score
- 74/100
- State rank
- #132
- US rank
- #4576
Category grades
Schools grade is shown separately in the Schools card above.
Census & demographics
- Census place
- San Luis Obispo, CA
- County
- San Luis Obispo County · 224,651 people
- City population
- 54,204
- Metro
- San Luis Obispo-Paso Robles, CA
- Population (ZIP)
- 29,202
- Household income
- $96,824
- Rent vs Own
- Severe rent burden
- 2050.0
Population outlook (San Luis Obispo County) Hauer SSP2
- Today (2025)
- 306,977 people
- By 2030
- 320,378 · +4.4%
- By 2040
- 343,933 · +12.0%
- By 2050
- 366,853 · +19.5%
- By 2075
- 428,329 · +39.5%
- By 2100
- 460,687 · +50.1%
Race, ethnicity, and origin ACS 2023
- Neighborhood character
- Predominantly White (71%)
- Race & ethnicity
- White 71% Hispanic / Latino 18% Two or more races 12% Asian 4% Black 2%
- Hispanic origin (detail)
- Mexican 14%
- Common ancestry
- Lithuanian 4% Italian 3% Portuguese 3%
- Foreign-born
- 9% · Canada, China, South Korea
- Languages at home
- 84% English-only · Spanish 10% Chinese 1% Other Asian/Pacific 1%
Political lean MEDSL · San Luis Obispo
- 2024 margin
- D (+10.9) · D 53.9% · R 43.1% · Other 3.0%
- 2008→2024 swing
- +5.5pp toward D · 2008: 5.4pp · 2024: 10.9pp
- All cycles
- 2024: D+10.9 2020: D+13.1 2016: D+8.3 2012: D+1.0 2008: D+5.4
Not yet ingested
- Civics
- —
Market trends
- HPI YoY
- ▼ -796.84%
- Current HPI
- 359.9248
- Rent YoY
- ▲ 4.41%
- Metro
- San Luis Obispo-Paso Robles, CA
- State GDP YoY
- ▲ 3.21%
- F500 in state
- 116
Industry mix (Fortune 500 HQ in CA)
| Industry | F500 HQs | Revenue |
|---|---|---|
| Technology | 27 | $1,492B |
|
||
| Financial Services | 3 | $174B |
|
||
| Retail | 3 | $44B |
|
||
| Insurance | 3 | $26B |
|
||
| Media / Entertainment | 2 | $115B |
|
||
| Pharmaceuticals / Biotech | 2 | $62B |
|
||
Price history
+50.1% since first listed25 events — show timeline
- 2026-06-05 Listed $210,000 CRMLS
- 2024-10-16 Sold (MLS) $280,000 CRMLS
- 2024-09-16 Pending — CRMLS
- 2024-08-16 Listed $299,500 CRMLS
- 2022-07-08 Sold (MLS) $199,000 CRMLS
- 2022-05-31 Pending — CRMLS
- 2022-05-23 Relisted — CRMLS
- 2022-05-07 Pending — CRMLS
- 2022-04-11 Relisted — CRMLS
- 2022-03-10 Relisted — CRMLS
- 2021-12-20 Pending — CRMLS
- 2021-11-18 Listed $199,000 CRMLS
- 2020-06-10 Listing Removed — CRMLS
- 2020-06-03 Contingent — CRMLS
- 2020-04-14 Relisted — CRMLS
- 2020-03-30 Listing Removed — CRMLS
- 2020-03-14 Price Changed $199,000 CRMLS
- 2020-02-22 Price Changed $219,000 CRMLS
- 2020-02-18 Listed $199,000 CRMLS
- 2019-10-15 Sold (MLS) $85,000 CRMLS
- 2019-09-04 Pending — CRMLS
- 2019-08-07 Price Changed $89,900 CRMLS
- 2019-07-08 Listed $95,000 CRMLS
- 2015-08-25 Sold (MLS) $135,000 NSBCRMLS
- 2015-07-29 Listed $139,900 NSBCRMLS
Property tax history
+2.3%/yrLatest (2025): $557 · -0.3% YoY. Source: county tax records.
Cash-flow waterfall
monthlySold comps — $/sqft
last 12 mo · ≤1 miLoading sold comps…