103 Hillview Ter · Hinesburg, VT
Flood risk 1/10 · Minimal
- FEMA flood zone
- X (unshaded)
- Chance of flooding over 30 yrs
- 0.0%
- Est. flood insurance / yr
- $473 – $860
Fire risk 1/10 · Minimal
- Est. fire insurance / yr
- $480 – $892
Heat risk 2/10 · Minimal
- Hot days now (above 89°F)
- 7 days/yr
- Hot days in 30 yrs
- 14 days/yr
Wind risk 2/10 · Minimal
- Chance of severe wind over 30 yrs
- 2.0%
Air-quality risk 2/10 · Minimal
- Unhealthy air days now
- 1 days/yr
- Unhealthy air days in 30 yrs
- 1 days/yr
Risk factors via First Street. Map © Google.
Why this score? — see what drove the B+ grade
The composite is a weighted blend of 9 inputs, each scored 0–100. Each bar is that input's sub-score; the figure is the points it added to the 100-point composite (weight × sub-score).
- Cash flow +30.0/30.0
- ARV discount +15.0/15.0
- 1% rule +10.0/10.0
- DSCR +10.0/10.0
- Schools +5.0/10.0
- Livability +3.3/5.0
- Rent growth +2.5/5.0
- Condition / age +2.5/5.0
- Appreciation +0.0/10.0
$85,000
🖨 Deal sheet 📄 Offer letter ✓ Due diligence
Listing remarks MLS
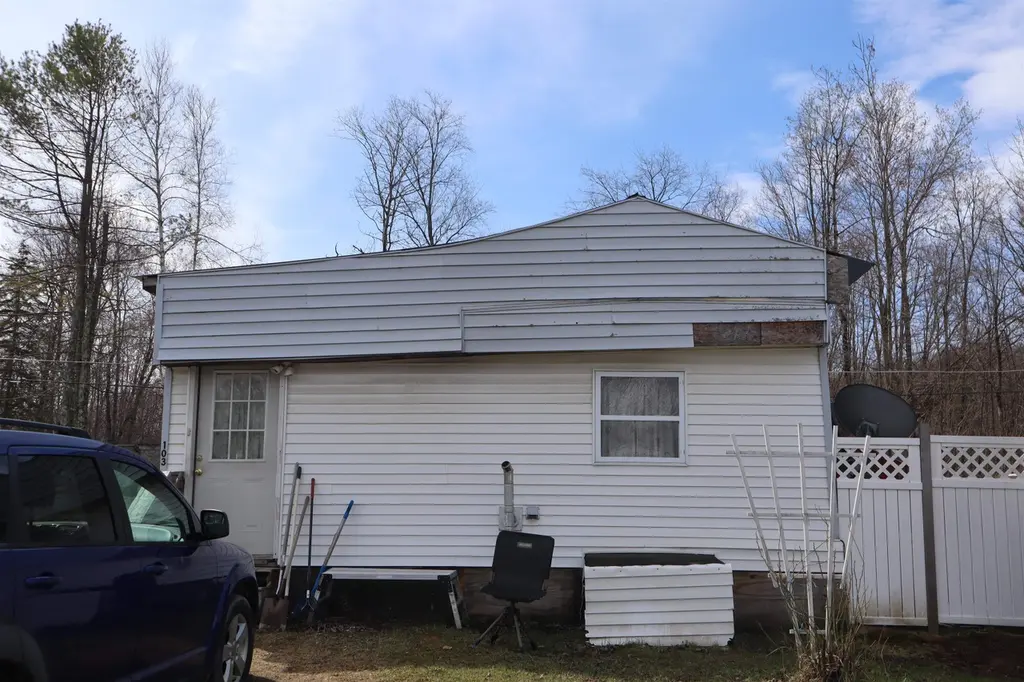
Enjoy the light and open floor plan of this 2 bedroom, 1 bath mobile home. Newer flooring throughout the home, metal roof, and newer appliances all stay with the home. There's also great additional storage out back in the shed, which would also make a great work space. This property is being sold AS IS.
Key facts
- Metal roof
- Newer flooring
- Great work space
Tags
Neighborhood map
What this means for you Summary
Snapshot
- This is a 3-bed/1.0-bath manufactured listed at $85k.
Deal economics
- At list price, monthly cash flow is $410 ($5k/yr) — positive.
- The deal already cash-flows at list — no discount required.
- Meets the 1% rule at list price ($2k rent vs $85k).
- Recommended offer: $77k (9.0% below list) — sets the bar for market timing.
Location & tenants
- Location reads 66/100 on livability (#54 in VT) — a middle-class / working-renter tenant base. Strengths: crime A+, health & safety A+, housing B; Watch: employment D+, amenities F, commute F.
- Market conditions: 34 active listings in the ZIP; 898 units permitted in Chittenden County in 2024 (554 in 5+ unit buildings).
Forward outlook
- Local home prices are declining (-3.0%/yr); year-one equity from $588 of loan paydown is wiped out by about $3k of value loss. Plan a longer hold.
- Chittenden County population projected at +8% by 2050 — modest demand growth; plan on rents tracking national, not racing it.
- At projected returns (-3.0% appreciation + 3.0% rent growth), your $24k cash investment doubles in ~6 years — after that, you're playing with house money.
Negotiation context
- It's been on market 115 days — a 9% lower offer ($77k) is reasonable based on typical stale-listing flexibility.
Risks & watch-outs
- Watch-outs: HOA is 27% of rent.
Questions for the listing agent
- It's been on market 115 days. Have you received any prior offers? Is the seller open to a 9% concession, seller financing, or rate buy-down credit?
- Built in 1972 — when were the roof, HVAC, electrical panel, plumbing, and water heater last replaced?
- What does the HOA fee cover, when was the last increase, and are there any pending special assessments or reserve-fund shortfalls?
- Why hasn't it sold? Are there any deal-killer items the seller is aware of (foundation, flood, title, zoning, code violations)?
- Is there a deadline driving the sale (1031 exchange, divorce, estate, relocation)? That informs how much negotiation room exists.
- Schools are B-rated — typically a magnet for longer-tenancy family renters. What's the average tenant stay here, and is there a school-zone premium baked into asking?
- What's the average days-on-market for RENTAL listings here right now (not sales)? A rising rental-DOM trend means longer vacancies and softer asking-rent achievability than the comps imply.
- What's the recent tenant-quality profile in this submarket — average credit score on applications, eviction rate, late-payment / NSF rate, and stable-employment percentage? A property-management company in the area should have these aggregated.
- How much new for-sale + rental construction is in the pipeline within 1–3 miles? Heavy new supply typically softens prices + rents 12–24 months out; constrained supply supports both.
Investment metrics
- 1% rule
- 2.08% ✓
- Cap rate
- 12.08%
- Cash-on-cash
- 20.67%
- DSCR
- 1.92
- GRM
- 4.0
CMA / ARV
- ARV (median comp)
- $120,343
- List price
- $85,000
- Delta
- -29.37%
- Verdict
- UNDERPRICED
- Comps
- 5 within 1.0 mi
Show comp detail 7 sales within ~0.75 mi
| Address | Dist | Beds/Ba | Sqft | Sold | Price | $/sf | Match |
|---|---|---|---|---|---|---|---|
| 2201 North Rd | 0.09mi | 2/2.0 (-1) | 980 (-0%) | 8mo | $70,000 | $71 | 80 |
| 201 Hillview Ter | 0.10mi | 3/2.0 | 1,064 (+8%) | 5mo | $34,000 | $32 | 74 |
| 62 Hillview Ter | 0.05mi | 2/2.0 (-1) | 952 (-3%) | 13mo | $135,000 | $142 | 73 |
| 137 Hillview Ter | 0.03mi | 2/2.0 (-1) | 907 (-8%) | 8mo | $142,900 | $158 | 70 |
| 68 Hillview Ter | 0.04mi | 3/2.0 | 1,088 (+11%) | 9mo | $158,000 | $145 | 69 |
| 201 Hillview Ter #30 | 0.06mi | 3/2.0 | 1,064 (+8%) | 20mo | $28,000 | $26 | 63 |
| 182 Hillview Ter | 0.09mi | 2/2.0 (-1) | 1,088 (+11%) | 23mo | $154,900 | $142 | 51 |
Match score weights: distance 35% · size 25% · config 20% · recency 20%. Top-matched comps best support the ARV.
Projected returns pro-forma
-3.0% appreciation · 3.0% rent growth · sell at horizon
- IRR
- 13.3%
- Equity multiple
- 1.53×
- Total profit
- $12,608
- Equity at exit
- $12,674
- IRR
- 22.3%
- Equity multiple
- 2.92×
- Total profit
- $45,706
- Equity at exit
- $7,349
Cash invested: $23,800 (down + closing). Projections, not guarantees.
Landlord ↔ Tenant lean methodology
- Overall (STATE)
- 41 Moderately Tenant-Leaning
- State Vermont
- 41 Moderately Tenant-Leaning · D+15
- County
- — inherits STATE
- City
- — inherits STATE
ZIP-level market 05461
- Home prices YoY
- -32.5%
- Active inventory
- 34
- Price-to-rent
- 4.0×
Monthly cashflow live
- Estimated rent
- $1,769 medium interval (Pro) →
- Mortgage (P&I)
- −$446
- Tax from tax record
- −$22 /mo · $259/yr
- Insurance
- −$35
- HOA
- −$485
- Vacancy / Maint / Mgmt
- −$372
- Net cashflow
- $410
Break-even live
UW: 25.0% down · 7.5% · 30yr · 1.5% tax · 5.0% vac · 8.0% maint · 8.0% mgmt
Financing live
Cash to close
- Down payment
- $21,250
- Closing costs
- $2,550
- Reserves months
- —
- Total cash needed
- —
Loan-product check · same deal, 3 products live
Conventional
25% down · 7.5% · 30yr
- Down + closing
- —
- Monthly P&I
- —
- Monthly cashflow
- —
- DSCR
- —
- Eligible?
- —
Personal DTI + credit; lowest rate.
DSCR
20% down · 8.5% · 30yr
- Down + closing
- —
- Monthly P&I
- —
- Monthly cashflow
- —
- DSCR
- —
- Eligible?
- —
No personal income docs; deal must DSCR.
Hard money
10% down · 12.0% · 12mo
- Down + closing
- —
- Monthly P&I
- —
- Monthly cashflow
- —
- DSCR
- —
- Eligible?
- —
Short-term bridge; refi at stabilization.
HOA detail
- Monthly dues
- $485 · $5,820/yr
Listing history 17 events
-
2026-06-19days on market $85,000 Active 115 DOM
-
2026-06-18days on market $85,000 Active 114 DOM
-
2026-06-17days on market $85,000 Active 113 DOM
-
2026-06-16days on market $85,000 Active 112 DOM
-
2026-06-15days on market $85,000 Active 111 DOM
-
2026-06-14days on market $85,000 Active 109 DOM
-
2026-06-13days on market $85,000 Active 108 DOM
-
2026-06-10days on market $85,000 Active 106 DOM
-
2026-06-09days on market $85,000 Active 105 DOM
-
2026-06-08days on market $85,000 Active 104 DOM
-
2026-06-07days on market $85,000 Active 103 DOM
-
2026-06-02days on market $85,000 Active 98 DOM
-
2026-06-01days on market $85,000 Active 97 DOM
-
2026-05-31days on market $85,000 Active 96 DOM
-
2026-05-30days on market $85,000 Active 95 DOM
-
2026-02-23$85,000 Active 304-char remark
Show marketing remark (304 chars)
Enjoy the light and open floor plan of this 2 bedroom, 1 bath mobile home. Newer flooring throughout the home, metal roof, and newer appliances all stay with the home. There's also great additional storage out back in the shed, which would also make a great work space. This property is being sold AS IS.
-
2025-08-25price $95,000
ⓘ Source: listings_history table (triggers on properties + properties_extension) + one-shot
backfill from property_details.listing_events for pre-trigger history.
Tax reassessment forecast VT · Partial reset (capped growth)
- Current annual tax
- $259 · $22/mo
- Projected year-2 tax
- $937 · $78/mo
- Expected delta
- +$678/yr (+$56/mo · 261.2%)
ⓘ Screening estimate from a state-policy table — verify with the county assessor before closing.
Climate risk First Street
- Flood 1/10 Low FEMA zone X (unshaded) · 0% chance over 30 yrs
- Wildfire 1/10 Low
- Heat 2/10 Low 7 d/yr ≥89°F today · 14 d/yr by 30 yrs out
- Wind 2/10 Low 2% chance of damaging wind over 30 yrs
- Air quality 2/10 Low 1 unhealthy d/yr today · 1 by 30 yrs out
Nearby sold comps map
Loading sold comps map…
Walkable amenities ~0.75 mi
Loading nearby amenities…
Taxation est. · year 1
- Rental income
- $21,231
- − Mortgage interest
- −$4,761
- − Property taxes
- −$259
- − Insurance
- −$425
- − Repairs & maintenance
- −$1,698
- − Management
- −$1,698
- − HOA
- −$5,820
- − Depreciation
- −$2,473
- Taxable income
- $4,096
- Est. tax owed @ 24.0%
- −$983
- After-tax cash flow
- $3,936/yr
For passive investors: Depreciation is non-cash, so a rental often shows a tax loss while cash-flowing — sheltering income. Rental losses are passive: they offset passive income freely, and up to $25,000/yr can offset ordinary (W-2) income if you actively participate and your MAGI is under $100k (phasing out to $0 by $150k); unused losses carry forward. On sale, claimed depreciation is recaptured at up to 25%, and gains may owe capital-gains tax (a 1031 exchange can defer both). Figures are a year-1 estimate at your 24.0% rate — not tax advice; consult a CPA.
Schools (NCES district)
No district data.
Livability — Hinesburg
- Score
- 66/100
- State rank
- #54
- US rank
- #12285
Category grades
Schools grade is shown separately in the Schools card above.
Census & demographics
- Population (ZIP)
- 4,815
Population outlook (Chittenden County) Hauer SSP2
- Today (2025)
- 170,769 people
- By 2030
- 174,716 · +2.3%
- By 2040
- 180,337 · +5.6%
- By 2050
- 183,768 · +7.6%
- By 2075
- 194,646 · +14.0%
- By 2100
- 194,933 · +14.2%
Race, ethnicity, and origin ACS 2023
- Neighborhood character
- Predominantly White (96%)
- Race & ethnicity
- White 96% Two or more races 3%
- Common ancestry
- Lithuanian 8% Romanian 4% Italian 2%
- Foreign-born
- 4% · Canada
- Languages at home
- 98% English-only · French/Haitian/Cajun 1% Other Indo-European 1% Spanish 1%
Political lean MEDSL · Chittenden
- 2024 margin
- Solid D (+53.6) · D 75.4% · R 21.7% · Other 2.9%
- 2008→2024 swing
- +8.9pp toward D · 2008: 44.8pp · 2024: 53.6pp
- All cycles
- 2024: D+53.6 2020: D+54.5 2016: D+46.8 2012: D+41.9 2008: D+44.8
Not yet ingested
- Civics
- —
Market trends
- HPI YoY
- ▼ -93.22%
- Current HPI
- 193.1768
- Rent YoY
- —
- Metro
- —
- State GDP YoY
- —
- F500 in state
- 0
Price history
-10.5% since first listed2 events — show timeline
- 2026-02-23 Listed $85,000 PrimeMLS
- 2025-08-25 Price Changed $95,000 PrimeMLS
Property tax history
+17.9%/yrLatest (2024): $259 · +20.0% YoY. Source: county tax records.
Cash-flow waterfall
monthlySold comps — $/sqft
last 12 mo · ≤1 miLoading sold comps…