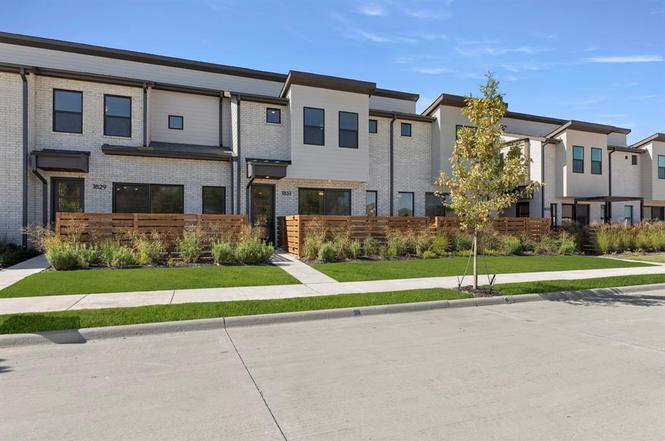
1831 Azalea Dr · Melissa, TX
Flood risk No data
- FEMA flood zone
- —
- Chance of flooding over 30 yrs
- —
- Est. flood insurance / yr
- —
Fire risk No data
- Est. fire insurance / yr
- —
Heat risk No data
- Hot days now (above threshold)
- —
- Hot days in 30 yrs
- —
Wind risk No data
- Chance of severe wind over 30 yrs
- —
Air-quality risk No data
- Unhealthy air days now
- —
- Unhealthy air days in 30 yrs
- —
Risk factors via First Street. Map © Google.
Why this score? — see what drove the D- grade
The composite is a weighted blend of 9 inputs, each scored 0–100. Each bar is that input's sub-score; the figure is the points it added to the 100-point composite (weight × sub-score).
- Cash flow +9.5/30.0
- ARV discount +7.5/15.0
- Schools +5.8/10.0
- Livability +3.4/5.0
- 1% rule +2.9/10.0
- DSCR +2.7/10.0
- Appreciation +2.7/10.0
- Condition / age +2.5/5.0
- Rent growth +2.1/5.0
$329,900
🖨 Deal sheet 📄 Offer letter ✓ Due diligence
Listing remarks
MLS# 21081859 - Built by Grenadier Investments - Ready Now! ~ “APRIL—SPRING INTO SAVINGS: BUYERS GET A TOTAL of $30,000 in Flex Dollars—use it for additional discount-take right off price, use towards closing costs, or rate buy-down—PLUS a free Samsung refrigerator, washer, and dryer move-in package! LIMITED INVESTOR OPPORTUNITIES! INQUIRE AT SALES OFFICE! Discover this stunning contemporary townhouse in the desirable Willow Grove Townhomes subdivision, offering 1,689 sq. ft. of modern living space. This beautifully designed residence features three spacious bedrooms and three bathrooms (two full, one half), perfect for comfortable living. Enjoy the light-filled ope
Key facts
- Open layout
- $280 HOA
- 2 garage spots
Tags
Property features AI
Finance
- Other: Energy-efficient features include energy-efficient appliances, enhanced air filtration, upgraded HVAC, insulation, thermostat, efficient windows, drought-tolerant landscaping, and rain/freeze sensors
- Financial info: No second mortgage indicated; Loan type: Treat as Clear
- HOA & community: Mandatory HOA; HOA dues $280 per month; HOA covers full use of facilities, maintenance of structures, and management fees; HOA management company to be determined; Community amenities include community pool, community sprinkler system, and fitness center
Exterior
- Parking: Attached 2-car garage (garage faces rear); 2 covered parking spaces
- Security: Fire sprinkler system; Security system; Security lights; Smoke detectors; Carbon monoxide detectors
- Utilities: City water; City sewer; Not in a municipal utility district
- Home design: Townhouse (attached); Two levels; New construction completed in 2025; Facing direction not specified; Condo/townhome lot
- Construction: Brick and rock/stone exterior; Composition roof; Slab foundation; Year built 2025 (new construction - complete)
- Exterior features: Covered porch(es); Covered patio/porch; Gutters; Exterior lighting; Private entrance; Wood fencing; Few trees and landscaped grounds; Located in a subdivision (Willow Grove Townhomes)
Interior
- Kitchen: Dishwasher; Disposal; Gas cooktop; Microwave; Pantry; Built-in cabinets
- Bedrooms: Three bedrooms total; Primary bedroom on level 2 with dual sinks, linen closet, and walk-in closet(s); Two additional bedrooms on level 2
- Flooring: Carpet; Ceramic tile; Wood
- Bathrooms: Two full bathrooms; One half bathroom
- Heating & cooling: Central heating (natural gas); Central air; Ceiling fans; Electric cooling
- Interior features: Decorative lighting; High-speed internet available; Vaulted ceilings; One living area; Five total rooms
- Laundry & utility: Gas water heater
Neighborhood map
What this means for you Summary
Snapshot
- This is a 5-bed/3.5-bath other listed at $330k.
Deal economics
- At list price, monthly cash flow is $-227 ($-3k/yr) — negative.
- To cash-flow at today's rent, offer at most $290k (12.2% below list).
- To meet the 1% rule (rent ≥ 1% of price), the offer needs to be $259k (21.4% below list).
- Recommended offer: $259k (21.4% below list) — sets the bar for 1% rule.
- Cap rate 5.5% vs local median 2.8% in Melissa — top-decile yield for the area; either an underpriced asset or a hidden risk that comps aren't pricing in. Stress-test before assuming the spread holds.
Location & tenants
- Location reads 68/100 on livability (#477 in TX) — a middle-class / working-renter tenant base. Strengths: crime A+, employment A+, housing A+; Watch: cost of living D, amenities F, commute F.
- Melissa ISD (suburban): math 65% / reading 65% proficiency, ranked #24 of 826 in TX (top 3%) — acceptable for families but not a draw, mixed tenant base, ~2y average lease.
- Zoned schools: Willow Wood El (930 students, 20% FRL) — zoned schools at 20% FRL track the district average.
- Market conditions: Rents soft (-1.4%/yr); 503 active listings in the ZIP; 7 comparable units currently listed for rent nearby; rentals at typical pace (median 22d on market — plan ~3-4 weeks tenant-placement turnaround); 43% of comp listings sitting > 30 days — soft ceiling on asking rent; high-income renter base; 19,194 units permitted in Collin County in 2024 (3,988 in 5+ unit buildings).
Forward outlook
- Local home prices are declining (-3.0%/yr); year-one equity from $2k of loan paydown is wiped out by about $10k of value loss. Plan a longer hold.
- Collin County population projected at +60% by 2050 — long-run rental-demand tailwind backs the buy-and-hold thesis.
Negotiation context
- It's been on market 199 days — a 12% lower offer ($290k) is reasonable based on typical stale-listing flexibility.
- 2 sale attempts; this cycle's ask has dropped $40k (11%) from the opening price — seller is motivated, your offer sets the floor, not the list.
Questions for the listing agent
- What do current leases actually rent for vs. the listed asking? Can we see a recent rent roll and the last 12 months of T-12 income?
- It's been on market 199 days. Have you received any prior offers? Is the seller open to a 21% concession, seller financing, or rate buy-down credit?
- What does the HOA fee cover, when was the last increase, and are there any pending special assessments or reserve-fund shortfalls?
- Why hasn't it sold? Are there any deal-killer items the seller is aware of (foundation, flood, title, zoning, code violations)?
- Is there a deadline driving the sale (1031 exchange, divorce, estate, relocation)? That informs how much negotiation room exists.
- Schools are A-rated — typically a magnet for longer-tenancy family renters. What's the average tenant stay here, and is there a school-zone premium baked into asking?
- The area grade is low — what's the realistic commute time and amenity access for the typical tenant pool here? Any planned neighborhood developments (good or bad) we should know about?
- What's the average days-on-market for RENTAL listings here right now (not sales)? A rising rental-DOM trend means longer vacancies and softer asking-rent achievability than the comps imply.
- What's the recent tenant-quality profile in this submarket — average credit score on applications, eviction rate, late-payment / NSF rate, and stable-employment percentage? A property-management company in the area should have these aggregated.
- How much new for-sale + rental construction is in the pipeline within 1–3 miles? Heavy new supply typically softens prices + rents 12–24 months out; constrained supply supports both.
Investment metrics
- 1% rule
- 0.79% ✗
- Cap rate
- 5.47%
- Cash-on-cash
- -2.95%
- DSCR
- 0.87
- GRM
- 10.6
CMA / ARV
No comps found within radius.
Projected returns pro-forma
-3.0% appreciation · 0.0% rent growth · sell at horizon
- IRR
- -24.6%
- Equity multiple
- 0.18×
- Total profit
- $-75,495
- Equity at exit
- $49,189
- IRR
- -32.4%
- Equity multiple
- -0.23×
- Total profit
- $-113,603
- Equity at exit
- $28,524
Cash invested: $92,372 (down + closing). Projections, not guarantees.
Landlord ↔ Tenant lean methodology
- Overall (STATE)
- 87 Strongly Landlord-Friendly
- State Texas
- 87 Strongly Landlord-Friendly · R+5
- County
- — inherits STATE
- City
- — inherits STATE
ZIP-level market 75454
- Home prices YoY
- -1.9%
- Rents YoY
- -1.4%
- Active inventory
- 503
- Price-to-rent
- 10.6×
Monthly cashflow live
- Estimated rent
- $2,594 high interval (Pro) →
- Mortgage (P&I)
- −$1,730
- Tax from tax record
- −$129 /mo · $1,549/yr
- Insurance
- −$137
- HOA
- −$280
- Vacancy / Maint / Mgmt
- −$545
- Net cashflow
- $-227
Break-even live
UW: 25.0% down · 7.5% · 30yr · 1.5% tax · 5.0% vac · 8.0% maint · 8.0% mgmt
Financing live
Cash to close
- Down payment
- $82,475
- Closing costs
- $9,897
- Reserves months
- —
- Total cash needed
- —
Loan-product check · same deal, 3 products live
Conventional
25% down · 7.5% · 30yr
- Down + closing
- —
- Monthly P&I
- —
- Monthly cashflow
- —
- DSCR
- —
- Eligible?
- —
Personal DTI + credit; lowest rate.
DSCR
20% down · 8.5% · 30yr
- Down + closing
- —
- Monthly P&I
- —
- Monthly cashflow
- —
- DSCR
- —
- Eligible?
- —
No personal income docs; deal must DSCR.
Hard money
10% down · 12.0% · 12mo
- Down + closing
- —
- Monthly P&I
- —
- Monthly cashflow
- —
- DSCR
- —
- Eligible?
- —
Short-term bridge; refi at stabilization.
Rent comps 7 comps
| Address | Beds | Baths | Sqft | Rent | $/sqft | DOM | Units | Dist |
|---|---|---|---|---|---|---|---|---|
| 380 Elk Trl Melissa, TX | 4.0 | 2.0 | 1798 | $1,950 | $1.08 | 43d | 1 | 0.28mi |
| 504 Teal Ln Melissa, TX | 4.0 | 2.0 | 1798 | $2,100 | $1.17 | 10d | 1 | 0.29mi |
| 2201 River Trl Melissa, TX | 4.0 | 2.5 | 2129 | $2,800 | $1.32 | 43d | 1 | 0.48mi |
| 2504 Quail Ridge Rd Melissa, TX | 4.0 | 2.5 | 2099 | $2,100 | $1.00 | 22d | 1 | 0.49mi |
| 3000 Harmon Dr Melissa, TX | 3.0–4.0 | 2.5–3.5 | 1983 | $2,975 | $1.50 | 3d | 110 | 0.84mi |
| 1114 Haskell Dr Melissa, TX | 4.0 | 2.0 | 2075 | $2,225 | $1.07 | 12d | 1 | 1.13mi |
| 1116 Haskell Dr Melissa, TX | 4.0 | 2.0 | 1929 | $2,395 | $1.24 | 43d | 1 | 1.14mi |
HOA detail
- Monthly dues
- $280 · $3,360/yr
Listing history 7 events
-
2026-04-28status Pending
-
2026-04-07price $329,900
-
2026-02-28status Active
-
2026-02-25status Pending
-
2026-02-20price $339,900
-
2025-10-23price $349,900
-
2025-10-08$369,900 Active
ⓘ Source: listings_history table (triggers on properties + properties_extension) + one-shot
backfill from property_details.listing_events for pre-trigger history.
Tax reassessment forecast TX · Resets to sale price
- Current annual tax
- $1,549 · $129/mo
- Projected year-2 tax
- $6,037 · $503/mo
- Expected delta
- +$4,488/yr (+$374/mo · 289.8%)
ⓘ Screening estimate from a state-policy table — verify with the county assessor before closing.
Nearby sold comps map
Loading sold comps map…
Walkable amenities ~0.75 mi
Loading nearby amenities…
Taxation est. · year 1
- Rental income
- $31,129
- − Mortgage interest
- −$18,480
- − Property taxes
- −$1,549
- − Insurance
- −$1,650
- − Repairs & maintenance
- −$2,490
- − Management
- −$2,490
- − HOA
- −$3,360
- − Depreciation
- −$9,597
- Taxable loss
- −$8,486
- Est. tax savings @ 24.0%
- +$2,037
- After-tax cash flow
- $-690/yr
For passive investors: Depreciation is non-cash, so a rental often shows a tax loss while cash-flowing — sheltering income. Rental losses are passive: they offset passive income freely, and up to $25,000/yr can offset ordinary (W-2) income if you actively participate and your MAGI is under $100k (phasing out to $0 by $150k); unused losses carry forward. On sale, claimed depreciation is recaptured at up to 25%, and gains may owe capital-gains tax (a 1031 exchange can defer both). Figures are a year-1 estimate at your 24.0% rate — not tax advice; consult a CPA.
Schools (NCES district)
- District
- Melissa ISD
- NCES district ID
- 4830120
- Math proficiency
- 65% ▼ -8.00%
- Reading proficiency
- 65% ▼ -2.00%
- Median HH income
- $82,500
- Composite
- 58.34/100
- National rank
- #1012
- State rank
- #24 of 826 in TX
Livability — Melissa
- Score
- 68/100
- State rank
- #477
- US rank
- #9595
Category grades
Schools grade is shown separately in the Schools card above.
Census & demographics
- Census place
- Melissa, TX
- County
- Collin County · 1,159,394 people
- City population
- 22,990
- Metro
- Dallas-Fort Worth-Arlington, TX
- Population (ZIP)
- 22,990
- Household income
- $138,827
- Rent vs Own
- Severe rent burden
- 246.0
Population outlook (Collin County) Hauer SSP2
- Today (2025)
- 1,210,074 people
- By 2030
- 1,358,201 · +12.2%
- By 2040
- 1,654,061 · +36.7%
- By 2050
- 1,937,359 · +60.1%
- By 2075
- 2,567,039 · +112.1%
- By 2100
- 2,952,048 · +144.0%
Race, ethnicity, and origin ACS 2023
- Neighborhood character
- Diverse neighborhood (Simpson 0.60)
- Race & ethnicity
- White 59% Hispanic / Latino 16% Black 15% Two or more races 10% Asian 6%
- Hispanic origin (detail)
- Mexican 11%
- Common ancestry
- Italian 4% Slovak 3% Romanian 3%
- Foreign-born
- 13% · Canada, China
- Languages at home
- 78% English-only · Spanish 12% Other Indo-European 2% Other Asian/Pacific 2%
Political lean MEDSL · Collin
- 2024 margin
- R (+11.1) · D 43.1% · R 54.3% · Other 2.6%
- 2008→2024 swing
- +14.4pp toward D · 2008: -25.6pp · 2024: -11.1pp
- All cycles
- 2024: R+11.1 2020: R+4.3 2016: R+17.0 2012: R+31.6 2008: R+25.6
Not yet ingested
- Civics
- —
Market trends
- HPI YoY
- ▼ -4.66%
- Current HPI
- 235.2508
- Rent YoY
- ▼ -1.42%
- Metro
- Dallas-Fort Worth-Arlington, TX
- State GDP YoY
- ▲ 3.95%
- F500 in state
- 110
Industry mix (Fortune 500 HQ in TX)
| Industry | F500 HQs | Revenue |
|---|---|---|
| Energy | 16 | $1,198B |
|
||
| Technology | 5 | $198B |
|
||
| Engineering / Construction | 4 | $72B |
|
||
| Energy Services | 3 | $60B |
|
||
| Utilities | 3 | $41B |
|
||
| Healthcare | 2 | $330B |
|
||
Price history
-10.8% since first listed7 events — show timeline
- 2026-04-28 Pending — NTREIS
- 2026-04-07 Price Changed $329,900 NTREIS
- 2026-02-28 Relisted — NTREIS
- 2026-02-25 Pending — NTREIS
- 2026-02-20 Price Changed $339,900 NTREIS
- 2025-10-23 Price Changed $349,900 NTREIS
- 2025-10-08 Listed $369,900 NTREIS
Property tax history
+21.8%/yrLatest (2025): $1,549 · +21.8% YoY. Source: county tax records.
Cash-flow waterfall
monthlySold comps — $/sqft
last 12 mo · ≤1 miLoading sold comps…