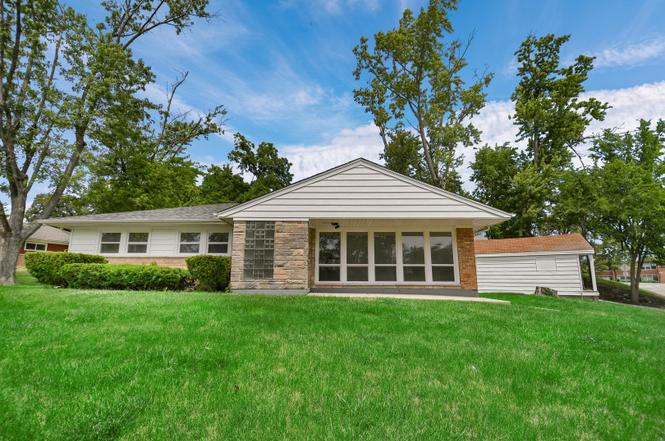
102 Nashua St · Park Forest, IL
Flood risk 1/10 · Minimal
- FEMA flood zone
- X (unshaded)
- Chance of flooding over 30 yrs
- 0.0%
- Est. flood insurance / yr
- $473 – $860
Fire risk 1/10 · Minimal
- Est. fire insurance / yr
- $804 – $1,492
Heat risk 3/10 · Minor
- Hot days now (above 101°F)
- 7 days/yr
- Hot days in 30 yrs
- 16 days/yr
Wind risk 2/10 · Minimal
- Chance of severe wind over 30 yrs
- —
Air-quality risk 2/10 · Minimal
- Unhealthy air days now
- 1 days/yr
- Unhealthy air days in 30 yrs
- 1 days/yr
Risk factors via First Street. Map © Google.
Why this score? — see what drove the B grade
The composite is a weighted blend of 9 inputs, each scored 0–100. Each bar is that input's sub-score; the figure is the points it added to the 100-point composite (weight × sub-score).
- Cash flow +30.0/30.0
- ARV discount +14.9/15.0
- DSCR +10.0/10.0
- 1% rule +9.4/10.0
- Livability +3.9/5.0
- Rent growth +2.5/5.0
- Condition / age +2.5/5.0
- Schools +0.9/10.0
- Appreciation +0.0/10.0
$168,000
🖨 Deal sheet 📄 Offer letter ✓ Due diligence
Listing remarks MLS
COZY BRICK AND FRAME RANCH THAT FEATURES 3 BEDROOMS, 1.1 BATHS, FAMILY ROOM, AND A 1 CAR DETACHED GARAGE, HARDWOOD FLOORS, SOLD AS IS. BUYER TO TAKE ON CITY REPAIRS & PUT UP ESCROW IF REQUIRED. NO DISCLOSURES, NO SURVEY OR TERMITE PROVIDED. PRESENT DETAILED PRE-QUAL OR PROOF OF FUNDS WITH OFFER. EM CERTIFIED FUNDS ONLY.
Key facts
- 9,234 sq ft lot
- Garage
- Built 1953
Property features AI
Finance
- Other: Living area is estimated
- HOA & community: No master association fee required; Community features: curbs, sidewalks, street lights, paved streets
Exterior
- Parking: Detached garage (garage owned); Asphalt parking; Approximately 1.5 garage / total parking spaces
- Utilities: Water: Lake Michigan; Sewer: Public sewer; Electric: Circuit breakers
- Home design: Detached single-family ranch; One story; Fee simple ownership
- Construction: Brick construction; Asphalt roof; Concrete perimeter foundation; Built approximately 71–80 years ago; Built before 1978
- Exterior features: Patio; Fenced yard; Corner lot; Landscaped
Interior
- Kitchen: Range; Refrigerator; Eating area / table space
- Bedrooms: Master bedroom on main level (14 x 12); Bedroom 2 on main level (14 x 10); Bedroom 3 on main level (11 x 9)
- Flooring: Wood laminate in living areas and bedrooms; Ceramic tile in kitchen and laundry; Other flooring in sunroom
- Bathrooms: 1 full bath; 1 half bath
- Heating & cooling: Natural gas forced-air heating; Central air conditioning
- Interior features: First-floor bedroom; First-floor full bathroom; 7 total rooms; L-shaped dining room; Pull-down unfinished attic; CO detectors; Gas water heater
- Laundry & utility: Main-level laundry; In-unit laundry with laundry closet; Gas dryer hookup
Neighborhood map
What this means for you Summary
Snapshot
- This is a 3-bed/1.5-bath single-family listed at $168k.
Deal economics
- At list price, monthly cash flow is $754 ($9k/yr) — positive.
- The deal already cash-flows at list — no discount required.
- Meets the 1% rule at list price ($2k rent vs $168k).
- Cap rate 11.7% vs local median 9.7% in Park Forest — meaningfully above typical; check what's discounted (condition, days-on-market, listing class) to confirm the premium yield is real.
Location & tenants
- Location reads 78/100 on livability (#148 in IL, #2,726 nationally) — a middle-class / working-renter tenant base. Strengths: commute A+, cost of living A+, housing A+; Watch: schools D+, amenities F.
- Rich Twp Hsd 227 (suburban): math 5% / reading 12% proficiency, ranked #577 of 620 in IL (top 93%) — low school quality limits family demand, transient renter base, plan for 1-2y turnover.
- Market conditions: 102 active listings in the ZIP; 6 comparable units currently listed for rent nearby; rentals leasing fast (median 12d on market — plan ~1-2 weeks tenant-placement turnaround); 6,272 units permitted in Cook County in 2024 (4,658 in 5+ unit buildings).
- At $2,424/mo this rent would consume 47% of the median local household income ($62k/yr) (locally 900% of renters already pay >50% of income on rent) — very limited rent-growth headroom before tenants either downsize or default.
Forward outlook
- Local home prices are declining (-3.0%/yr); year-one equity from $1k of loan paydown is wiped out by about $5k of value loss. Plan a longer hold.
- At projected returns (-3.0% appreciation + 3.0% rent growth), your $47k cash investment doubles in ~7 years — after that, you're playing with house money.
Negotiation context
- Only 3 days on market — expect competitive offers; lowballing is unlikely to land.
- 6 sale attempts since 20y ago with the ask held roughly flat each time — persistent listings suggest the price (not the market) is what's stuck; bring a comps-based counter.
- Current owner paid $83k; list at $168k implies a 102% gain — meaningful room to come down on a strong offer.
Risks & watch-outs
- Watch-outs: built in 1953 — expect roof / HVAC / electrical / plumbing capex.
Questions for the listing agent
- Built in 1953 — when were the roof, HVAC, electrical panel, plumbing, and water heater last replaced?
- Is there a deadline driving the sale (1031 exchange, divorce, estate, relocation)? That informs how much negotiation room exists.
- Schools are D-rated, which usually means shorter tenancies and higher turnover. Who's the typical renter profile here, and what's been the actual vacancy rate?
- What's the average days-on-market for RENTAL listings here right now (not sales)? A rising rental-DOM trend means longer vacancies and softer asking-rent achievability than the comps imply.
- What's the recent tenant-quality profile in this submarket — average credit score on applications, eviction rate, late-payment / NSF rate, and stable-employment percentage? A property-management company in the area should have these aggregated.
- How much new for-sale + rental construction is in the pipeline within 1–3 miles? Heavy new supply typically softens prices + rents 12–24 months out; constrained supply supports both.
Investment metrics
- 1% rule
- 1.44% ✓
- Cap rate
- 11.68%
- Cash-on-cash
- 19.24%
- DSCR
- 1.86
- GRM
- 5.8
CMA / ARV
- ARV (on-the-fly)
- $201,160
- Comps found
- 12
Show comp detail 12 sales within ~0.75 mi
| Address | Dist | Beds/Ba | Sqft | Sold | Price | $/sf | Match |
|---|---|---|---|---|---|---|---|
| 356 S Orchard Dr | 0.14mi | 3/2.5 | 1,811 (-4%) | 3mo | $185,000 | $102 | 81 |
| 7 Nassau Ct | 0.07mi | 4/2.0 (+1) | 1,968 (+5%) | 2mo | $235,000 | $119 | 81 |
| 356 Osage St | 0.31mi | 4/2.0 (+1) | 1,875 (-0%) | 6mo | $70,000 | $37 | 73 |
| 336 Indianwood Blvd | 0.31mi | 3/1.5 | 1,784 (-5%) | 6mo | $190,000 | $107 | 72 |
| 105 Marquette St | 0.39mi | 3/2.0 | 1,769 (-6%) | 10mo | $208,000 | $118 | 62 |
| 451 Talala St | 0.51mi | 3/1.5 | 1,697 (-10%) | 13mo | $202,000 | $119 | 50 |
| 123 Peach St | 0.58mi | 4/2.5 (+1) | 1,778 (-5%) | 7mo | $150,000 | $84 | 49 |
| 9 Apple Ln | 0.67mi | 4/2.5 (+1) | 1,937 (+3%) | 8mo | $189,900 | $98 | 48 |
| 358 Osage St | 0.31mi | 4/3.0 (+1) | 2,152 (+14%) | 3mo | $260,000 | $121 | 48 |
| 329 Indianwood Blvd | 0.32mi | 2/2.0 (-1) | 1,598 (-15%) | 8mo | $140,000 | $88 | 47 |
| 204 Nashua St | 0.42mi | 4/2.0 (+1) | 1,625 (-14%) | 6mo | $90,000 | $55 | 46 |
| 217 Shabbona Dr | 0.58mi | 3/1.0 | 1,600 (-15%) | 12mo | $199,000 | $124 | 36 |
Match score weights: distance 35% · size 25% · config 20% · recency 20%. Top-matched comps best support the ARV.
Projected returns pro-forma
-3.0% appreciation · 3.0% rent growth · sell at horizon
- IRR
- 11.2%
- Equity multiple
- 1.44×
- Total profit
- $20,856
- Equity at exit
- $25,049
- IRR
- 20.2%
- Equity multiple
- 2.70×
- Total profit
- $80,172
- Equity at exit
- $14,526
Cash invested: $47,040 (down + closing). Projections, not guarantees.
Landlord ↔ Tenant lean methodology
- Overall (STATE)
- 43 Moderately Tenant-Leaning
- State Illinois
- 43 Moderately Tenant-Leaning · D+7
- County
- — inherits STATE
- City
- — inherits STATE
ZIP-level market 60466
- Home prices YoY
- -21.1%
- Active inventory
- 102
- Price-to-rent
- 5.8×
Monthly cashflow live
- Estimated rent
- $2,424 high interval (Pro) →
- Mortgage (P&I)
- −$881
- Tax est. 1.5%
- −$210 /mo · $2,520/yr
- Insurance
- −$70
- HOA
- −$0
- Vacancy / Maint / Mgmt
- −$509
- Net cashflow
- $754
Break-even live
UW: 25.0% down · 7.5% · 30yr · 1.5% tax · 5.0% vac · 8.0% maint · 8.0% mgmt
Financing live
Cash to close
- Down payment
- $42,000
- Closing costs
- $5,040
- Reserves months
- —
- Total cash needed
- —
Loan-product check · same deal, 3 products live
Conventional
25% down · 7.5% · 30yr
- Down + closing
- —
- Monthly P&I
- —
- Monthly cashflow
- —
- DSCR
- —
- Eligible?
- —
Personal DTI + credit; lowest rate.
DSCR
20% down · 8.5% · 30yr
- Down + closing
- —
- Monthly P&I
- —
- Monthly cashflow
- —
- DSCR
- —
- Eligible?
- —
No personal income docs; deal must DSCR.
Hard money
10% down · 12.0% · 12mo
- Down + closing
- —
- Monthly P&I
- —
- Monthly cashflow
- —
- DSCR
- —
- Eligible?
- —
Short-term bridge; refi at stabilization.
Rent comps 6 comps
| Address | Beds | Baths | Sqft | Rent | $/sqft | DOM | Units | Dist |
|---|---|---|---|---|---|---|---|---|
| 111 Nashua St Park Forest, IL | 4.0 | 1.5 | 1500 | $2,500 | $1.67 | 24d | 1 | 0.00mi |
| 336 Oakwood St Park Forest, IL | 3.0 | 2.0 | 2083 | $2,800 | $1.34 | 10d | 1 | 0.36mi |
| 441 Talala St Park Forest, IL | 4.0 | 2.0 | 1740 | $2,500 | $1.44 | 24d | 1 | 0.45mi |
| 490 Shabbona Dr Park Forest, IL | 3.0 | 1.0 | 1300 | $1,895 | $1.46 | 3d | 1 | 0.63mi |
| 19 Apple Ln Park Forest, IL | 3.0 | 1.0 | 1541 | $2,300 | $1.49 | 12d | 1 | 0.65mi |
| 3324 Western Ave Park Forest, IL | 1.0–3.0 | 1.0 | 1026 | $1,995 | $1.94 | 1d | 11 | 1.07mi |
Listing history 4 events
-
2026-06-18days on market $168,000 Active 3 DOM
-
2026-06-17days on market $168,000 Active 2 DOM
-
2026-06-15remarks 699-char remark
-
2026-06-15$168,000 Active 1 DOM
ⓘ Source: listings_history table (triggers on properties + properties_extension) + one-shot
backfill from property_details.listing_events for pre-trigger history.
Climate risk First Street
- Flood 1/10 Low FEMA zone X (unshaded) · 0% chance over 30 yrs
- Wildfire 1/10 Low
- Heat 3/10 Moderate 7 d/yr ≥101°F today · 16 d/yr by 30 yrs out
- Wind 2/10 Low
- Air quality 2/10 Low 1 unhealthy d/yr today · 1 by 30 yrs out
Nearby sold comps map
Loading sold comps map…
Walkable amenities ~0.75 mi
Loading nearby amenities…
Taxation est. · year 1
- Rental income
- $29,094
- − Mortgage interest
- −$9,411
- − Property taxes
- −$2,520
- − Insurance
- −$840
- − Repairs & maintenance
- −$2,327
- − Management
- −$2,327
- − Depreciation
- −$4,887
- Taxable income
- $6,781
- Est. tax owed @ 24.0%
- −$1,627
- After-tax cash flow
- $7,424/yr
For passive investors: Depreciation is non-cash, so a rental often shows a tax loss while cash-flowing — sheltering income. Rental losses are passive: they offset passive income freely, and up to $25,000/yr can offset ordinary (W-2) income if you actively participate and your MAGI is under $100k (phasing out to $0 by $150k); unused losses carry forward. On sale, claimed depreciation is recaptured at up to 25%, and gains may owe capital-gains tax (a 1031 exchange can defer both). Figures are a year-1 estimate at your 24.0% rate — not tax advice; consult a CPA.
Schools (NCES district)
- District
- Rich Twp Hsd 227
- NCES district ID
- 1733420
- Math proficiency
- 5% ▼ -3.00%
- Reading proficiency
- 12% ▬ 0.00%
- Median HH income
- $56,056
- Composite
- 8.93/100
- National rank
- #9885
- State rank
- #577 of 620 in IL
Livability — Park Forest
- Score
- 78/100
- State rank
- #148
- US rank
- #2726
Category grades
Schools grade is shown separately in the Schools card above.
Census & demographics
- Census place
- Park Forest, IL
- County
- Cook County · 4,486,803 people
- City population
- 21,461
- Metro
- Chicago-Naperville-Elgin, IL-IN-WI
- Population (ZIP)
- 21,461
- Household income
- $61,654
- Rent vs Own
- Severe rent burden
- 900.0
Population outlook (Cook County) Hauer SSP2
- Today (2025)
- 5,347,519 people
- By 2030
- 5,357,703 · +0.2%
- By 2040
- 5,324,924 · -0.4%
- By 2050
- 5,230,762 · -2.2%
- By 2075
- 4,785,735 · -10.5%
- By 2100
- 4,188,836 · -21.7%
Race, ethnicity, and origin ACS 2023
- Neighborhood character
- Predominantly Black (69%)
- Race & ethnicity
- Black 69% White 19% Hispanic / Latino 9% Two or more races 3% Native American 1%
- Hispanic origin (detail)
- Mexican 8%
- Common ancestry
- Romanian 2% Iranian 1% Italian 1%
- Foreign-born
- 6% · Canada
- Languages at home
- 90% English-only · Spanish 7% French/Haitian/Cajun 1% Russian/Polish/Slavic 1%
Political lean MEDSL · Cook
- 2024 margin
- Solid D (+42.0) · D 70.4% · R 28.4% · Other 1.2%
- 2008→2024 swing
- -11.4pp toward R · 2008: 53.4pp · 2024: 42.0pp
- All cycles
- 2024: D+42.0 2020: D+50.3 2016: D+53.0 2012: D+49.4 2008: D+53.4
Not yet ingested
- Civics
- —
Market trends
- HPI YoY
- ▼ -58.87%
- Current HPI
- 219.9692
- Rent YoY
- —
- Metro
- Chicago-Naperville-Elgin, IL-IN-WI
- State GDP YoY
- ▲ 1.59%
- F500 in state
- 60
Industry mix (Fortune 500 HQ in IL)
| Industry | F500 HQs | Revenue |
|---|---|---|
| Insurance | 4 | $201B |
|
||
| Consumer Goods | 4 | $87B |
|
||
| Industrial Machinery | 3 | $64B |
|
||
| Healthcare | 2 | $55B |
|
||
| Retail / Pharmacy | 1 | $148B |
|
||
| Agriculture / Food | 1 | $86B |
|
||
Price history
+33.3% since first listed18 events — show timeline
- 2026-06-15 Listed $168,000 MRED as Distributed by MLS Grid
- 2018-08-28 Listing Removed — MRED as Distributed by MLS Grid
- 2018-07-29 Price Changed — MRED as Distributed by MLS Grid
- 2018-07-06 Listed — MRED as Distributed by MLS Grid
- 2015-07-28 Sold (Public Records) $83,000 Public Records
- 2014-09-22 Sold (MLS) $20,000 MRED as Distributed by MLS Grid
- 2014-08-06 Listing Removed — MRED as Distributed by MLS Grid
- 2014-06-25 Listed $25,000 MRED as Distributed by MLS Grid
- 2011-03-16 Listing Removed — MRED as Distributed by MLS Grid
- 2011-02-08 Price Changed — MRED as Distributed by MLS Grid
- 2010-09-15 Listed — MRED as Distributed by MLS Grid
- 2007-04-17 Sold (Public Records) $139,000 Public Records
- 2007-04-09 Sold (MLS) $139,000 MRED as Distributed by MLS Grid
- 2007-02-23 Listing Removed — MRED as Distributed by MLS Grid
- 2007-01-14 Listing Removed — MRED as Distributed by MLS Grid
- 2007-01-14 Listed $139,900 MRED as Distributed by MLS Grid
- 2006-07-17 Listed — MRED as Distributed by MLS Grid
- 2005-07-14 Sold (Public Records) $126,000 Public Records
Property tax history
+6.1%/yrLatest (2023): $10,980 · -3.0% YoY. Source: county tax records.
Cash-flow waterfall
monthlySold comps — $/sqft
last 12 mo · ≤1 miLoading sold comps…