 🌊 Lakefront
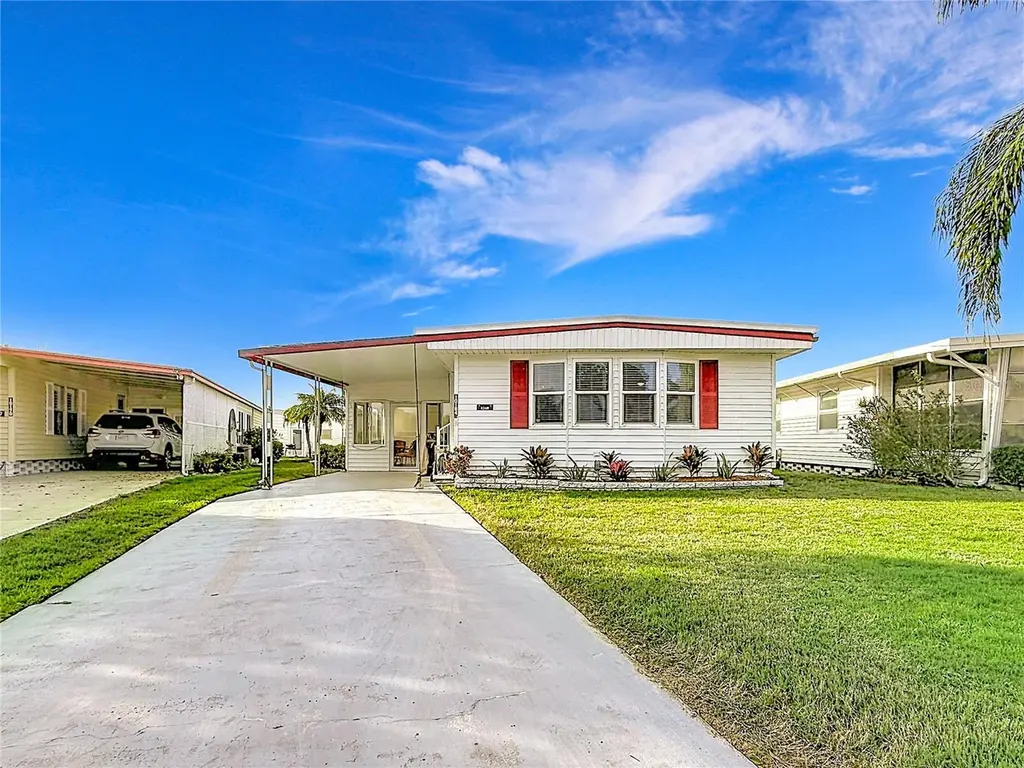
10184 106th Ave #26 · Seminole, FL
Flood risk 9/10 · Severe
- FEMA flood zone
- AE
- Chance of flooding over 30 yrs
- 0.99%
- Est. flood insurance / yr
- $1,737 – $8,500
Fire risk 3/10 · Minor
- Est. fire insurance / yr
- $947 – $1,759
Heat risk 10/10 · Severe
- Hot days now (above 107°F)
- 6 days/yr
- Hot days in 30 yrs
- 21 days/yr
Wind risk 10/10 · Severe
- Chance of severe wind over 30 yrs
- 99.0%
Air-quality risk 3/10 · Minor
- Unhealthy air days now
- 2 days/yr
- Unhealthy air days in 30 yrs
- 3 days/yr
Risk factors via First Street. Map © Google.
Why this score? — see what drove the B grade
The composite is a weighted blend of 9 inputs, each scored 0–100. Each bar is that input's sub-score; the figure is the points it added to the 100-point composite (weight × sub-score).
- Cash flow +25.3/30.0
- ARV discount +15.0/15.0
- 1% rule +8.6/10.0
- DSCR +8.3/10.0
- Livability +4.4/5.0
- Schools +4.3/10.0
- Condition / age +2.5/5.0
- Rent growth +1.7/5.0
- Appreciation +0.0/10.0
$155,000
🖨 Deal sheet (PDF) 📄 Offer letter ✓ Due diligence
Listing remarks
Exceptional value for this updated 1979 manufactured home located in the coveted Holiday Shores with access to Seminole Lake. Holiday Shores is a very active community and offers a wide range of recreational amenities, clubhouse, library, putting green, shuffleboard, swimming pool, fitness center, fishing, boating, plus boat slips on a first come first serve basis. For the low monthly maintenance fee of $200 it includes water, sewer, garbage pickup 2 x per week, lawn mowing and lawn spraying. The interior of the home is clean, light and bright, with central heat and air, ceiling fans, window treatments, beautiful flooring and includes all furnishings for a seamless transition into your new
Key facts
- Clubhouse
- Putting green
- Shuffleboard
Tags
Property features AI
Finance
- Other: Furnished; Total acreage about 20 to less than 50 acres (lot listed as 41.88 acres)
- HOA & community: Has HOA (monthly fee $200) including clubhouse, fitness center, pool, maintenance, wheelchair access; HOA fees cover common area taxes, pool, reserves, insurance, and management; Senior community; Community amenities: association-owned recreation, buyer approval required, deed restrictions, golf carts allowed, park, sidewalks
Exterior
- Parking: Carport with 3 spaces
- Utilities: Public water; Public sewer; Electricity connected; Cable available
- Home design: Manufactured double-wide home; Single-story (one level); North-facing
- Construction: Vinyl siding; Metal roof; Pillar/post/pier foundation; Built as completed residence
- Exterior features: Outdoor grill; Private mailbox; Sliding doors; Storage; Private boat ramp; Brackish canal and lake water access; Private in-ground heated gunite pool
Interior
- Kitchen: Microwave; Range; Refrigerator
- Bedrooms: 2 bedrooms
- Bathrooms: 2 full bathrooms
- Heating & cooling: Central heating (heat pump); Central air conditioning
- Interior features: Ceiling fans; Great room
- Laundry & utility: Washer; Dryer; Electric water heater; Laundry area outside
Neighborhood map
What this means for you Summary
Snapshot
- This is a 2-bed/2.0-bath manufactured listed at $155k.
Deal economics
- At list price, monthly cash flow is $-76 ($-916/yr) — negative.
- To cash-flow at today's rent, offer at most $142k (8.7% below list).
- Meets the 1% rule at list price ($2k rent vs $155k).
- Recommended offer: $141k (9.0% below list) — sets the bar for market timing.
- Cap rate 9.0% vs local median 3.6% in Seminole — top-decile yield for the area; either an underpriced asset or a hidden risk that comps aren't pricing in. Stress-test before assuming the spread holds.
Location & tenants
- Location reads 88/100 on livability (#5 in FL, #174 nationally) — a professional / high-income tenant draw. Strengths: commute A+, housing A+, health & safety A+.
- Pinellas (suburban): math 51% / reading 51% proficiency, ranked #31 of 73 in FL (top 42%) — acceptable for families but not a draw, mixed tenant base, ~2y average lease.
- Zoned schools: Starkey Elementary School (math 63% / reading 58%, grade B-, #664 of 2,144 statewide, top 32%, 657 students, 54% FRL); Osceola Middle School (math 48% / reading 45%, grade D+, #297 of 571 statewide, top 52%, 1,009 students, 52% FRL); Richard O Jacobson Technical High School At Seminole (math 52% / reading 53%, grade C-, #154 of 667 statewide, top 24%, 578 students, 45% FRL) — zoned schools at 50% FRL track the district average.
- Market conditions: Rents falling (-3.4%/yr); 119 active listings in the ZIP; 37 comparable units currently listed for rent nearby; rentals at typical pace (median 16d on market — plan ~3-4 weeks tenant-placement turnaround); solid renter incomes; 2,676 units permitted in Pinellas County in 2024 (1,422 in 5+ unit buildings).
- This rent runs 33% of the median local income ($77k/yr) — at the standard rent-burdened threshold; future hikes will face affordability resistance.
Forward outlook
- Local home prices are declining (-3.0%/yr); year-one equity from $1k of loan paydown is wiped out by about $5k of value loss. Plan a longer hold.
- Pinellas County population projected at +14% by 2050 — modest demand growth; plan on rents tracking national, not racing it.
Negotiation context
- It's been on market 97 days — a 9% lower offer ($141k) is reasonable based on typical stale-listing flexibility.
- 3 sale attempts since 17y ago with the ask held roughly flat each time — persistent listings suggest the price (not the market) is what's stuck; bring a comps-based counter.
- Current owner paid $36k; list at $155k implies a 331% gain — meaningful room to come down on a strong offer.
Risks & watch-outs
- Watch-outs: flood insurance adds $427/mo.
- Climate carrying-cost: in FEMA flood zone AE (mandatory federal flood insurance); severe wind risk, 99% chance of damaging wind over 30y; extreme-heat days projected 6→21/yr by 2055 (HVAC capex compounding) — expect insurance premiums to compound above CPI over the hold.
Questions for the listing agent
- What do current leases actually rent for vs. the listed asking? Can we see a recent rent roll and the last 12 months of T-12 income?
- It's been on market 97 days. Have you received any prior offers? Is the seller open to a 9% concession, seller financing, or rate buy-down credit?
- Built in 1979 — when were the roof, HVAC, electrical panel, plumbing, and water heater last replaced?
- What's the actual annual flood-insurance premium (NFIP or private), and is the property in a SFHA with mandatory coverage?
- What does the HOA fee cover, when was the last increase, and are there any pending special assessments or reserve-fund shortfalls?
- Why hasn't it sold? Are there any deal-killer items the seller is aware of (foundation, flood, title, zoning, code violations)?
- Is there a deadline driving the sale (1031 exchange, divorce, estate, relocation)? That informs how much negotiation room exists.
- Schools are B-rated — typically a magnet for longer-tenancy family renters. What's the average tenant stay here, and is there a school-zone premium baked into asking?
- This sits on a lake — are riparian / water-frontage rights deeded with the parcel? Any dock permits, shoreline easements, or HOA water-use restrictions?
- What's the documented flood / surge / shoreline-erosion history here (FEMA AND non-FEMA — e.g., storm surge, creek backup, septic-field saturation)?
- Any water-quality or seasonal algae-bloom issues that affect tenant satisfaction or short-term-rental demand?
- What's the average days-on-market for RENTAL listings here right now (not sales)? A rising rental-DOM trend means longer vacancies and softer asking-rent achievability than the comps imply.
- What's the recent tenant-quality profile in this submarket — average credit score on applications, eviction rate, late-payment / NSF rate, and stable-employment percentage? A property-management company in the area should have these aggregated.
- How much new for-sale + rental construction is in the pipeline within 1–3 miles? Heavy new supply typically softens prices + rents 12–24 months out; constrained supply supports both.
Investment metrics
- 1% rule
- 1.36% ✓
- Cap rate
- 9.00%
- Cash-on-cash
- 9.68%
- DSCR
- 1.43
- GRM
- 6.1
CMA / ARV
- ARV (on-the-fly)
- $215,800
- Comps found
- 4
Show comp detail 4 sales within ~0.75 mi
| Address | Dist | Beds/Ba | Sqft | Sold | Price | $/sf | Match |
|---|---|---|---|---|---|---|---|
| 10190 N Lake Dr #48 | 0.07mi | 2/2.0 | 1,040 (+0%) | 2mo | $200,000 | $192 | 95 |
| 10527 Tahitian Ln #111 | 0.09mi | 2/2.0 | 1,104 (+6%) | 8mo | $170,000 | $154 | 79 |
| 10350 106th Ave #11 | 0.14mi | 2/2.0 | 912 (-12%) | 6mo | $110,000 | $121 | 68 |
| 11005 101st Way #241 | 0.39mi | 2/1.5 | 1,062 (+2%) | 13mo | $159,900 | $151 | 65 |
Match score weights: distance 35% · size 25% · config 20% · recency 20%. Top-matched comps best support the ARV.
Projected returns pro-forma
-3.0% appreciation · 0.0% rent growth · sell at horizon
- IRR
- -25.3%
- Equity multiple
- 0.18×
- Total profit
- $-35,699
- Equity at exit
- $23,111
- IRR
- -51.7%
- Equity multiple
- -0.37×
- Total profit
- $-59,364
- Equity at exit
- $13,402
Cash invested: $43,400 (down + closing). Projections, not guarantees.
Landlord ↔ Tenant lean methodology
- Overall (STATE)
- 87 Strongly Landlord-Friendly
- State Florida
- 87 Strongly Landlord-Friendly · R+3
- County
- — inherits STATE
- City
- — inherits STATE
ZIP-level market 33773
- Rents YoY
- -3.4%
- Active inventory
- 119
- Price-to-rent
- 6.1×
Monthly cashflow live
- Estimated rent
- $2,102 high interval (Pro) →
- Mortgage (P&I)
- −$813
- Tax from tax record
- −$233 /mo · $2,797/yr
- Insurance
- −$65
- Flood insurance flood zone
- −$427 /mo · $5,118/yr
- HOA
- −$200
- Vacancy / Maint / Mgmt
- −$441
- Net cashflow
- $-76
Break-even live
Sensitivity live
| Price | -10% $11 | -5% $-32 | +0% $-76 | +5% $-120 | +10% $-164 |
|---|---|---|---|---|---|
| Rent | -10% $-242 | -5% $-159 | +0% $-76 | +5% $7 | +10% $90 |
| Rate | -1.0pp $2 | -0.5pp $-37 | base $-76 | +0.5pp $-117 | +1.0pp $-157 |
UW: 25.0% down · 7.5% · 30yr · 1.5% tax · 5.0% vac · 8.0% maint · 8.0% mgmt
Financing live
Cash to close
- Down payment
- $38,750
- Closing costs
- $4,650
- Reserves months
- —
- Total cash needed
- —
Loan-product check · same deal, 3 products live
Conventional
25% down · 7.5% · 30yr
- Down + closing
- —
- Monthly P&I
- —
- Monthly cashflow
- —
- DSCR
- —
- Eligible?
- —
Personal DTI + credit; lowest rate.
DSCR
20% down · 8.5% · 30yr
- Down + closing
- —
- Monthly P&I
- —
- Monthly cashflow
- —
- DSCR
- —
- Eligible?
- —
No personal income docs; deal must DSCR.
Hard money
10% down · 12.0% · 12mo
- Down + closing
- —
- Monthly P&I
- —
- Monthly cashflow
- —
- DSCR
- —
- Eligible?
- —
Short-term bridge; refi at stabilization.
Rent comps 37 comps
| Address | Beds | Baths | Sqft | Rent | $/sqft | DOM | Units | Dist |
|---|---|---|---|---|---|---|---|---|
| 10659 108th St Largo, FL | 3.0 | 1.5 | 1380 | $2,550 | $1.85 | 26d | 1 | 0.49mi |
| 10580 112th Ave Largo, FL | 3.0 | 1.0 | 925 | $1,995 | $2.16 | 6d | 1 | 0.49mi |
| 10932 104th Ave Largo, FL | 2.0 | 1.0 | 962 | $1,950 | $2.03 | 26d | 1 | 0.59mi |
| 10932 104th Ave Largo, FL | 2.0 | 1.0 | 962 | $1,950 | $2.03 | 22d | 1 | 0.59mi |
| 10560 114th Ter Largo, FL | 3.0 | 1.0 | 1232 | $3,000 | $2.44 | 6d | 1 | 0.63mi |
| 10887 111th Pl N Largo, FL | 3.0 | 2.0 | 1300 | $2,389 | $1.84 | 23d | 1 | 0.68mi |
| 9924 109th St Seminole, FL | 3.0 | 2.0 | 1428 | $2,500 | $1.75 | 6d | 1 | 0.74mi |
| 11290 109th Ln Largo, FL | 2.0 | 1.0 | 988 | $1,995 | $2.02 | 26d | 1 | 0.76mi |
| 10568 117th Dr Largo, FL | 3.0 | 2.0 | 1118 | $2,400 | $2.15 | 0d | 1 | 0.76mi |
| 10160 Sailwinds Blvd S Largo, FL | 2.0 | 2.0 | 901 | $1,950 | $2.16 | 26d | 2 | 0.78mi |
| 10495 118th Ave Largo, FL | 3.0 | 2.0 | 1169 | $2,250 | $1.92 | 6d | 1 | 0.79mi |
| 10155 Sailwinds Blvd S #204 Largo, FL | 2.0 | 2.0 | 1018 | $1,695 | $1.67 | 0d | 1 | 0.79mi |
| 11114 101st Ave Seminole, FL | 2.0 | 1.0 | 1135 | $2,300 | $2.03 | 6d | 1 | 0.83mi |
| 11707 108th St Unit 1018171P Largo, FL | 3.0 | 2.0 | 1259 | $3,050 | $2.42 | 0d | 1 | 0.88mi |
| 11013 Temple Ave Seminole, FL | 3.0 | 1.0 | 951 | $2,050 | $2.16 | 6d | 1 | 0.88mi |
| 9209 Seminole Blvd #139 Seminole, FL | 2.0 | 1.5 | 1015 | $1,800 | $1.77 | 26d | 1 | 0.90mi |
| 9099 108th Ave Seminole, FL | 3.0 | 2.0 | 1451 | $2,600 | $1.79 | 6d | 1 | 0.93mi |
| 9209 Seminole Blvd Seminole, FL | 2.0 | 1.5 | 1015 | $1,700 | $1.67 | 5d | 2 | 0.98mi |
| 9209 Seminole Blvd Seminole, FL | 2.0 | 1.5 | 1015 | $1,675 | $1.65 | 6d | 3 | 0.98mi |
| 10100 Sailwinds Blvd N #206 Largo, FL | 3.0 | 2.0 | 1155 | $1,850 | $1.60 | 5d | 1 | 0.99mi |
| 10888 Temple Ave Seminole, FL | 2.0 | 2.0 | 1101 | $2,150 | $1.95 | 6d | 1 | 1.00mi |
| 9881 113th St #215 Seminole, FL | 2.0 | 2.0 | 1150 | $1,600 | $1.39 | 19d | 1 | 1.01mi |
| 12261 Sailwinds Dr #203 Largo, FL | 3.0 | 2.0 | 1139 | $1,800 | $1.58 | 6d | 1 | 1.05mi |
| 12293 Sailwinds Dr #203 Largo, FL | 3.0 | 2.0 | 1155 | $2,050 | $1.77 | 15d | 1 | 1.06mi |
| 12100 Seminole Blvd Largo, FL | 2.0 | 2.0 | 1050 | $1,750 | $1.67 | 26d | 1 | 1.11mi |
| 9319 91st Ter Seminole, FL | 3.0 | 2.0 | 952 | $2,549 | $2.68 | 26d | 1 | 1.15mi |
| 9700 Starkey Rd #322 Seminole, FL | 1.0 | 1.0 | 700 | $1,499 | $2.14 | 23d | 1 | 1.15mi |
| 12651 Seminole Blvd #44 Largo, FL | 2.0 | 1.5 | 1000 | $1,450 | $1.45 | 26d | 1 | 1.28mi |
| 8800 Bardmoor Blvd Seminole, FL | 1.0–2.0 | 1.5–2.5 | 1045 | $1,950 | $1.87 | 13d | 2 | 1.30mi |
| 9992 86th St Seminole, FL | 2.0 | 2.0 | 945 | $1,900 | $2.01 | 5d | 1 | 1.30mi |
| 10548 86th Ave Seminole, FL | 2.0 | 2.0 | 1400 | $2,300 | $1.64 | 26d | 1 | 1.33mi |
| 8703 Bardmoor Blvd #201 Seminole, FL | 2.0 | 2.0 | 1075 | $3,000 | $2.79 | 26d | 1 | 1.36mi |
| 11201 122nd Ave Largo, FL | 1.0–2.0 | 1.0–2.0 | 867 | $2,150 | $2.48 | 0d | 2 | 1.38mi |
| 9295 Starkey Rd Seminole, FL | 3.0 | 1.0 | 984 | $1,950 | $1.98 | 26d | 1 | 1.38mi |
| 2103 Cordova Grn Unit 2103 Seminole, FL | 1.0 | 1.0 | 775 | $1,500 | $1.94 | 26d | 1 | 1.43mi |
| 604 Cordova Grn #604 Largo, FL | 2.0 | 2.0 | 1455 | $2,100 | $1.44 | 26d | 1 | 1.47mi |
| 11100 86th Ave #101 Seminole, FL | 1.0 | 1.0 | 874 | $1,350 | $1.54 | 19d | 1 | 1.49mi |
HOA detail
- Monthly dues
- $200 · $2,400/yr
- Likely covers
- watersewertrashpoolgym
Listing history 18 events
-
2026-06-22days on market $155,000 Active 97 DOM
-
2026-06-18days on market $155,000 Active 94 DOM
-
2026-06-17days on market $155,000 Active 93 DOM
-
2026-06-16days on market $155,000 Active 92 DOM
-
2026-06-15days on market $155,000 Active 91 DOM
-
2026-06-13days on market $155,000 Active 89 DOM
-
2026-06-09days on market $155,000 Active 85 DOM
-
2026-06-08days on market $155,000 Active 84 DOM
-
2026-06-07days on market $155,000 Active 83 DOM
-
2026-06-04days on market $155,000 Active 80 DOM
-
2026-06-03days on market $155,000 Active 79 DOM
-
2026-06-01days on market $155,000 Active 77 DOM
-
2026-05-31days on market $155,000 Active 76 DOM
-
2026-03-16$155,000 Active
-
2022-03-14$154,900 Active
-
2009-04-01$79,900
-
2000-08-02soldstatus $36,000
-
2000-08-02soldstatus $36,000
ⓘ Source: listings_history table (triggers on properties + properties_extension) + one-shot
backfill from property_details.listing_events for pre-trigger history.
Tax reassessment forecast FL · Resets to sale price
- Current annual tax
- $2,797 · $233/mo
- Projected year-2 tax
- $2,797 · $233/mo
- Expected delta
- $0/yr ($0/mo · 0.0%)
ⓘ Screening estimate from a state-policy table — verify with the county assessor before closing.
Climate risk First Street
- Flood 9/10 Extreme FEMA zone AE · 99% chance over 30 yrs
- Wildfire 3/10 Moderate
- Heat 10/10 Extreme 6 d/yr ≥107°F today · 21 d/yr by 30 yrs out
- Wind 10/10 Extreme 99% chance of damaging wind over 30 yrs
- Air quality 3/10 Moderate 2 unhealthy d/yr today · 3 by 30 yrs out
Nearby sold comps map
Loading sold comps map…
Walkable amenities ~0.75 mi
Loading nearby amenities…
Taxation est. · year 1
- Rental income
- $25,226
- − Mortgage interest
- −$8,682
- − Property taxes
- −$2,797
- − Insurance
- −$5,894
- − Repairs & maintenance
- −$2,018
- − Management
- −$2,018
- − HOA
- −$2,400
- − Depreciation
- −$4,509
- Taxable loss
- −$3,092
- Est. tax savings @ 24.0%
- +$742
- After-tax cash flow
- $-174/yr
For passive investors: Depreciation is non-cash, so a rental often shows a tax loss while cash-flowing — sheltering income. Rental losses are passive: they offset passive income freely, and up to $25,000/yr can offset ordinary (W-2) income if you actively participate and your MAGI is under $100k (phasing out to $0 by $150k); unused losses carry forward. On sale, claimed depreciation is recaptured at up to 25%, and gains may owe capital-gains tax (a 1031 exchange can defer both). Figures are a year-1 estimate at your 24.0% rate — not tax advice; consult a CPA.
Schools (NCES district)
- District
- Pinellas
- NCES district ID
- 1201560
- Math proficiency
- 51% ▼ -5.00%
- Reading proficiency
- 51% ▼ -3.00%
- Median HH income
- $46,270
- Composite
- 43.27/100
- National rank
- #3046
- State rank
- #31 of 73 in FL
Livability — Seminole
- Score
- 88/100
- State rank
- #5
- US rank
- #174
Category grades
Schools grade is shown separately in the Schools card above.
Census & demographics
- County
- Pinellas County · 939,478 people
- City population
- 42,315
- Metro
- Tampa-St. Petersburg-Clearwater, FL
- Population (ZIP)
- 16,741
- Household income
- $76,867
- Rent vs Own
- Severe rent burden
- 314.0
Population outlook (Pinellas County) Hauer SSP2
- Today (2025)
- 1,027,532 people
- By 2030
- 1,063,586 · +3.5%
- By 2040
- 1,125,020 · +9.5%
- By 2050
- 1,168,637 · +13.7%
- By 2075
- 1,265,188 · +23.1%
- By 2100
- 1,260,357 · +22.7%
Race, ethnicity, and origin ACS 2023
- Neighborhood character
- Predominantly White (75%)
- Race & ethnicity
- White 75% Two or more races 8% Hispanic / Latino 8% Asian 7% Black 5%
- Hispanic origin (detail)
- Mexican 2% Puerto Rican 3% Cuban 2%
- Common ancestry
- Romanian 4% Lithuanian 3% Italian 2%
- Foreign-born
- 12% · Canada, Vietnam, South Korea
- Languages at home
- 83% English-only · Spanish 5% Vietnamese 3% Other Indo-European 2%
Political lean MEDSL · Pinellas
- 2024 margin
- Lean R (+5.2) · D 46.9% · R 52.1%
- 2008→2024 swing
- -13.5pp toward R · 2008: 8.3pp · 2024: -5.2pp
- All cycles
- 2024: R+5.2 2020: D+0.2 2016: R+1.1 2012: D+5.6 2008: D+8.3
Not yet ingested
- Civics
- —
Market trends
- HPI YoY
- ▼ -367.92%
- Current HPI
- 319.4536
- Rent YoY
- ▼ -3.37%
- Metro
- Tampa-St. Petersburg-Clearwater, FL
- State GDP YoY
- ▲ 3.28%
- F500 in state
- 36
Industry mix (Fortune 500 HQ in FL)
| Industry | F500 HQs | Revenue |
|---|---|---|
| Industrial Technology | 2 | $29B |
|
||
| Insurance | 2 | $17B |
|
||
| Retail | 1 | $60B |
|
||
| Technology Distribution | 1 | $58B |
|
||
| Homebuilding | 1 | $35B |
|
||
| Technology Manufacturing | 1 | $35B |
|
||
Price history
+330.6% since first listed5 events — show timeline
- 2026-03-16 Listed $155,000 Stellar MLS as Distributed by MLS Grid
- 2022-03-14 Listed $154,900 Stellar MLS as Distributed by MLS Grid
- 2009-04-01 Listed $79,900 Stellar MLS as Distributed by MLS Grid
- 2000-08-02 Sold (Public Records) $36,000 Public Records
- 2000-08-02 Sold (Public Records) $36,000 Public Records
Property tax history
+7.6%/yrLatest (2025): $2,797 · +7.8% YoY. Source: county tax records.
Cash-flow waterfall
monthlySold comps — $/sqft
last 12 mo · ≤1 miLoading sold comps…