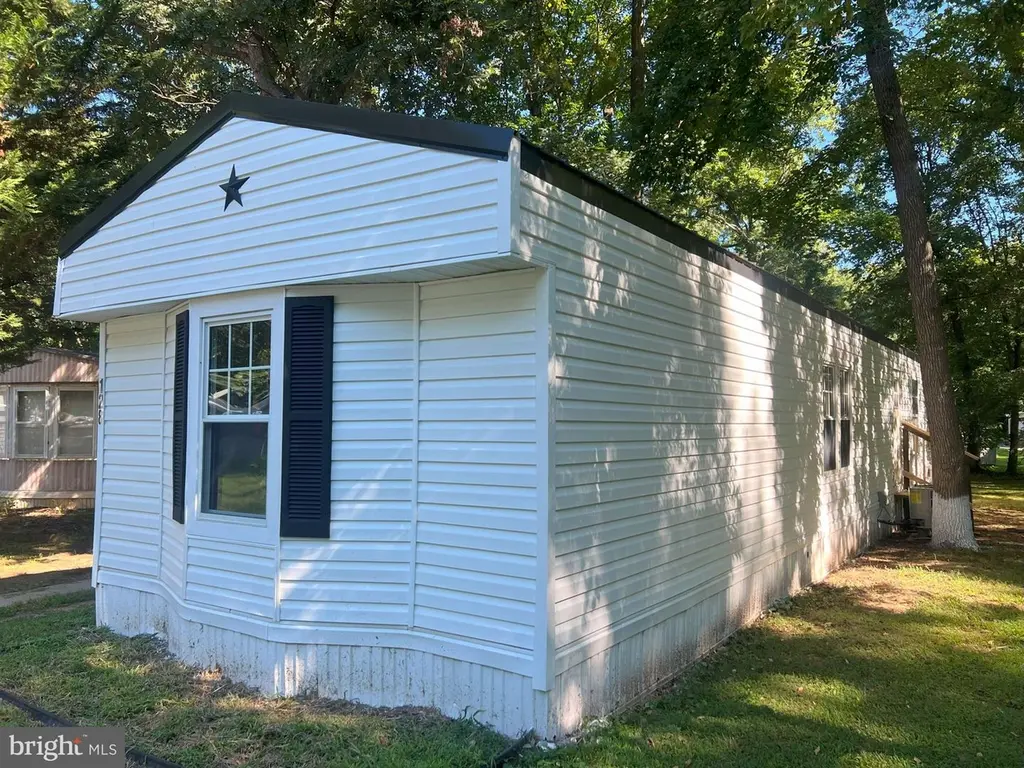
128 Ivy Ridge Ct #128 · Smyrna, DE
Flood risk 1/10 · Minimal
- FEMA flood zone
- X (unshaded)
- Chance of flooding over 30 yrs
- 0.0%
- Est. flood insurance / yr
- $507 – $1,088
Fire risk 1/10 · Minimal
- Est. fire insurance / yr
- $476 – $884
Heat risk 8/10 · Major
- Hot days now (above 102°F)
- 7 days/yr
- Hot days in 30 yrs
- 15 days/yr
Wind risk 6/10 · Moderate
- Chance of severe wind over 30 yrs
- 71.0%
Air-quality risk 2/10 · Minimal
- Unhealthy air days now
- 1 days/yr
- Unhealthy air days in 30 yrs
- 1 days/yr
Risk factors via First Street. Map © Google.
Why this score? — see what drove the C grade
The composite is a weighted blend of 9 inputs, each scored 0–100. Each bar is that input's sub-score; the figure is the points it added to the 100-point composite (weight × sub-score).
- Cash flow +21.5/30.0
- 1% rule +10.0/10.0
- DSCR +6.9/10.0
- ARV discount +5.3/15.0
- Condition / age +4.0/5.0
- Livability +3.5/5.0
- Schools +2.8/10.0
- Rent growth +2.5/5.0
- Appreciation +0.0/10.0
$70,000
🖨 Deal sheet 📄 Offer letter ✓ Due diligence
Listing remarks MLS
Don't miss out on this one!!! Move in Ready! Location!!! Completely renovated inside and out. Holly Hill estates is a beautiful community. New kitchen, new bathrooms, new floor, new roof. 2 bedrooms, 2 bathrooms, open concept. Immediate occupancy upon park approval. Don't let this one get away! Call for a showing today!
Key facts
- Built 1984
- Listed 297 days
Neighborhood map
What this means for you Summary
Snapshot
- This is a 2-bed/2.0-bath single-family listed at $70k. Condition is rated good.
Deal economics
- At list price, monthly cash flow is $105 ($1k/yr) — positive.
- The deal already cash-flows at list — no discount required.
- Meets the 1% rule at list price ($2k rent vs $70k).
- Recommended offer: $62k (12.0% below list) — sets the bar for market timing.
- Cap rate 8.1% vs local median 3.5% in Smyrna — top-decile yield for the area; either an underpriced asset or a hidden risk that comps aren't pricing in. Stress-test before assuming the spread holds.
Location & tenants
- Location reads 69/100 on livability (#29 in DE) — a middle-class / working-renter tenant base. Strengths: cost of living A+, housing A+, health & safety A+; Watch: crime D-, amenities F, commute F.
- Smyrna School District (rural): math 22% / reading 39% proficiency, ranked #16 of 26 in DE (top 62%) — families likely to look elsewhere, expect single-tenant / working-renter base with shorter leases.
- Market conditions: 220 active listings in the ZIP; 1,201 units permitted in Kent County in 2024 (116 in 5+ unit buildings).
Forward outlook
- Local home prices are declining (-3.0%/yr); year-one equity from $484 of loan paydown is wiped out by about $2k of value loss. Plan a longer hold.
- Kent County population projected at +22% by 2050 — long-run rental-demand tailwind backs the buy-and-hold thesis.
Negotiation context
- It's been on market 298 days — a 12% lower offer ($62k) is reasonable based on typical stale-listing flexibility.
Risks & watch-outs
- Watch-outs: HOA is 42% of rent.
- Climate carrying-cost: major wind risk, 71% chance of damaging wind over 30y; extreme-heat days projected 7→15/yr by 2055 (HVAC capex compounding) — expect insurance premiums to compound above CPI over the hold.
Questions for the listing agent
- It's been on market 298 days. Have you received any prior offers? Is the seller open to a 12% concession, seller financing, or rate buy-down credit?
- What does the HOA fee cover, when was the last increase, and are there any pending special assessments or reserve-fund shortfalls?
- Why hasn't it sold? Are there any deal-killer items the seller is aware of (foundation, flood, title, zoning, code violations)?
- Is there a deadline driving the sale (1031 exchange, divorce, estate, relocation)? That informs how much negotiation room exists.
- Crime grade is D in this area — have there been break-ins, vandalism, or insurance claims at this property in the last 3 years? What carrier currently insures it and at what premium?
- What's the average days-on-market for RENTAL listings here right now (not sales)? A rising rental-DOM trend means longer vacancies and softer asking-rent achievability than the comps imply.
- What's the recent tenant-quality profile in this submarket — average credit score on applications, eviction rate, late-payment / NSF rate, and stable-employment percentage? A property-management company in the area should have these aggregated.
- How much new for-sale + rental construction is in the pipeline within 1–3 miles? Heavy new supply typically softens prices + rents 12–24 months out; constrained supply supports both.
Investment metrics
- 1% rule
- 2.30% ✓
- Cap rate
- 8.10%
- Cash-on-cash
- 6.45%
- DSCR
- 1.29
- GRM
- 3.6
CMA / ARV
- ARV (median comp)
- $66,711
- List price
- $70,000
- Delta
- 4.93%
- Verdict
- FAIR
- Comps
- 20 within 1.0 mi
Show comp detail 9 sales within ~0.75 mi
| Address | Dist | Beds/Ba | Sqft | Sold | Price | $/sf | Match |
|---|---|---|---|---|---|---|---|
| 93 Ivy Ridge Ct #93 | 0.08mi | 2/2.0 | 924 (0%) | 12mo | $49,900 | $54 | 86 |
| 184 Hemlock Way | 0.11mi | 2/2.0 | 924 (0%) | 14mo | $62,000 | $67 | 84 |
| 222 Laurel Ln #222 | 0.20mi | 2/2.0 | 924 (0%) | 10mo | $52,000 | $56 | 83 |
| 158 Hemlock Way #158 | 0.07mi | 3/2.0 (+1) | 924 (0%) | 14mo | $68,600 | $74 | 80 |
| 227 Laurel Ln #227 | 0.17mi | 2/1.0 | 924 (0%) | 10mo | $41,500 | $45 | 80 |
| 122 Ivy Ridge Ct #122 | 0.06mi | 2/2.0 | 980 (+6%) | 17mo | $65,000 | $66 | 73 |
| 24 Spruce Ct #24 | 0.26mi | 3/2.0 (+1) | 980 (+6%) | 1mo | $62,900 | $64 | 72 |
| 68 Juniper Ct #68 | 0.16mi | 3/2.0 (+1) | 1,056 (+14%) | 16mo | $37,000 | $35 | 50 |
| 223 Laurel Ln #223 | 0.19mi | 3/1.5 (+1) | 1,056 (+14%) | 12mo | $22,500 | $21 | 50 |
Match score weights: distance 35% · size 25% · config 20% · recency 20%. Top-matched comps best support the ARV.
Projected returns pro-forma
-3.0% appreciation · 3.0% rent growth · sell at horizon
- IRR
- -5.7%
- Equity multiple
- 0.79×
- Total profit
- $-4,190
- Equity at exit
- $10,437
- IRR
- 4.6%
- Equity multiple
- 1.35×
- Total profit
- $6,797
- Equity at exit
- $6,052
Cash invested: $19,600 (down + closing). Projections, not guarantees.
Landlord ↔ Tenant lean methodology
- Overall (STATE)
- 70 Landlord-Friendly
- State Delaware
- 70 Landlord-Friendly · D+7
- County
- — inherits STATE
- City
- — inherits STATE
ZIP-level market 19977
- Home prices YoY
- -29.1%
- Active inventory
- 220
- Price-to-rent
- 3.6×
Monthly cashflow live
- Estimated rent
- $1,613 medium interval (Pro) →
- Mortgage (P&I)
- −$367
- Tax est. 1.5%
- −$88 /mo · $1,050/yr
- Insurance
- −$29
- HOA
- −$685
- Vacancy / Maint / Mgmt
- −$339
- Net cashflow
- $105
Break-even live
UW: 25.0% down · 7.5% · 30yr · 1.5% tax · 5.0% vac · 8.0% maint · 8.0% mgmt
Financing live
Cash to close
- Down payment
- $17,500
- Closing costs
- $2,100
- Reserves months
- —
- Total cash needed
- —
Loan-product check · same deal, 3 products live
Conventional
25% down · 7.5% · 30yr
- Down + closing
- —
- Monthly P&I
- —
- Monthly cashflow
- —
- DSCR
- —
- Eligible?
- —
Personal DTI + credit; lowest rate.
DSCR
20% down · 8.5% · 30yr
- Down + closing
- —
- Monthly P&I
- —
- Monthly cashflow
- —
- DSCR
- —
- Eligible?
- —
No personal income docs; deal must DSCR.
Hard money
10% down · 12.0% · 12mo
- Down + closing
- —
- Monthly P&I
- —
- Monthly cashflow
- —
- DSCR
- —
- Eligible?
- —
Short-term bridge; refi at stabilization.
HOA detail
- Monthly dues
- $685 · $8,220/yr
Listing history 18 events
-
2026-06-19days on market $70,000 Active 298 DOM
-
2026-06-18days on market $70,000 Active 297 DOM
-
2026-06-17days on market $70,000 Active 296 DOM
-
2026-06-16days on market $70,000 Active 295 DOM
-
2026-06-15days on market $70,000 Active 294 DOM
-
2026-06-14days on market $70,000 Active 292 DOM
-
2026-06-13days on market $70,000 Active 291 DOM
-
2026-06-10days on market $70,000 Active 289 DOM
-
2026-06-09days on market $70,000 Active 288 DOM
-
2026-06-08days on market $70,000 Active 287 DOM
-
2026-06-07days on market $70,000 Active 286 DOM
-
2026-06-05days on market $70,000 Active 283 DOM
-
2026-06-02days on market $70,000 Active 281 DOM
-
2026-06-01days on market $70,000 Active 280 DOM
-
2026-05-31days on market $70,000 Active 279 DOM
-
2026-05-30days on market $70,000 Active 278 DOM
-
2025-11-04price $70,000 322-char remark
Show marketing remark (322 chars)
Don't miss out on this one!!! Move in Ready! Location!!! Completely renovated inside and out. Holly Hill estates is a beautiful community. New kitchen, new bathrooms, new floor, new roof. 2 bedrooms, 2 bathrooms, open concept. Immediate occupancy upon park approval. Don't let this one get away! Call for a showing today!
-
2025-08-25$74,000 Active 322-char remark
Show marketing remark (322 chars)
Don't miss out on this one!!! Move in Ready! Location!!! Completely renovated inside and out. Holly Hill estates is a beautiful community. New kitchen, new bathrooms, new floor, new roof. 2 bedrooms, 2 bathrooms, open concept. Immediate occupancy upon park approval. Don't let this one get away! Call for a showing today!
ⓘ Source: listings_history table (triggers on properties + properties_extension) + one-shot
backfill from property_details.listing_events for pre-trigger history.
Climate risk First Street
- Flood 1/10 Low FEMA zone X (unshaded) · 0% chance over 30 yrs
- Wildfire 1/10 Low
- Heat 8/10 Severe 7 d/yr ≥102°F today · 15 d/yr by 30 yrs out
- Wind 6/10 Major 71% chance of damaging wind over 30 yrs
- Air quality 2/10 Low 1 unhealthy d/yr today · 1 by 30 yrs out
Nearby sold comps map
Loading sold comps map…
Walkable amenities ~0.75 mi
Loading nearby amenities…
Taxation est. · year 1
- Rental income
- $19,353
- − Mortgage interest
- −$3,921
- − Property taxes
- −$1,050
- − Insurance
- −$350
- − Repairs & maintenance
- −$1,548
- − Management
- −$1,548
- − HOA
- −$8,220
- − Depreciation
- −$2,036
- Taxable income
- $679
- Est. tax owed @ 24.0%
- −$163
- After-tax cash flow
- $1,101/yr
For passive investors: Depreciation is non-cash, so a rental often shows a tax loss while cash-flowing — sheltering income. Rental losses are passive: they offset passive income freely, and up to $25,000/yr can offset ordinary (W-2) income if you actively participate and your MAGI is under $100k (phasing out to $0 by $150k); unused losses carry forward. On sale, claimed depreciation is recaptured at up to 25%, and gains may owe capital-gains tax (a 1031 exchange can defer both). Figures are a year-1 estimate at your 24.0% rate — not tax advice; consult a CPA.
Condition & rehab AI · 12 photos
This single-family home is move-in ready with a fresh exterior, new kitchen and bathrooms, and efficient HVAC. It offers a good investment opportunity with potential for further improvements.
Value-add opportunities
- Both Paint exterior trim — Enhances curb appeal and value
- Both Replace air conditioning unit — Ensures efficient cooling and heating
- Both Install new window treatments — Improves energy efficiency and aesthetics
- Both Add landscaping around the foundation — Enhances curb appeal and property value
Renovation cost estimate screening
Value-add ROI direction
- Both Paint exterior trim — Enhances curb appeal and value ↑
- Both Replace air conditioning unit — Ensures efficient cooling and heating ↑
- Both Install new window treatments — Improves energy efficiency and aesthetics ↑
- Both Add landscaping around the foundation — Enhances curb appeal and property value ↑
ⓘ Cost ranges are severity-bucket heuristics (US national rule-of-thumb). Get contractor quotes + a written scope before underwriting a rehab budget.
Schools (NCES district)
- District
- Smyrna School District
- NCES district ID
- 1001620
- Math proficiency
- 22% ▼ -25.00%
- Reading proficiency
- 39% ▼ -17.00%
- Median HH income
- $61,704
- Composite
- 27.67/100
- National rank
- #6915
- State rank
- #16 of 26 in DE
Livability — Smyrna
- Score
- 69/100
- State rank
- #29
- US rank
- #8702
Category grades
Schools grade is shown separately in the Schools card above.
Census & demographics
- Population (ZIP)
- 27,164
Population outlook (Kent County) Hauer SSP2
- Today (2025)
- 194,477 people
- By 2030
- 204,351 · +5.1%
- By 2040
- 222,135 · +14.2%
- By 2050
- 236,483 · +21.6%
- By 2075
- 266,327 · +36.9%
- By 2100
- 275,335 · +41.6%
Race, ethnicity, and origin ACS 2023
- Neighborhood character
- Diverse neighborhood (Simpson 0.59)
- Race & ethnicity
- White 56% Black 29% Two or more races 9% Hispanic / Latino 8% Asian 2%
- Hispanic origin (detail)
- Mexican 1% Puerto Rican 5% Dominican 1%
- Common ancestry
- Romanian 5% Hispanic 1% Iranian 1%
- Foreign-born
- 7% · Canada
- Languages at home
- 89% English-only · Spanish 4% French/Haitian/Cajun 2% Other Asian/Pacific 2%
Political lean MEDSL · Kent
- 2024 margin
- Toss-up / Even · D 50.2% · R 48.2% · Other 1.7%
- 2008→2024 swing
- -7.8pp toward R · 2008: 9.8pp · 2024: 2.0pp
- All cycles
- 2024: D+2.0 2020: D+4.1 2016: R+4.9 2012: D+4.9 2008: D+9.8
Not yet ingested
- Civics
- —
Market trends
- HPI YoY
- ▼ -110.14%
- Current HPI
- 267.998
- Rent YoY
- —
- Metro
- —
- State GDP YoY
- —
- F500 in state
- 0
Price history
-5.4% since first listed2 events — show timeline
- 2025-11-04 Price Changed $70,000 BRIGHT MLS
- 2025-08-25 Listed $74,000 BRIGHT MLS
Cash-flow waterfall
monthlySold comps — $/sqft
last 12 mo · ≤1 miLoading sold comps…