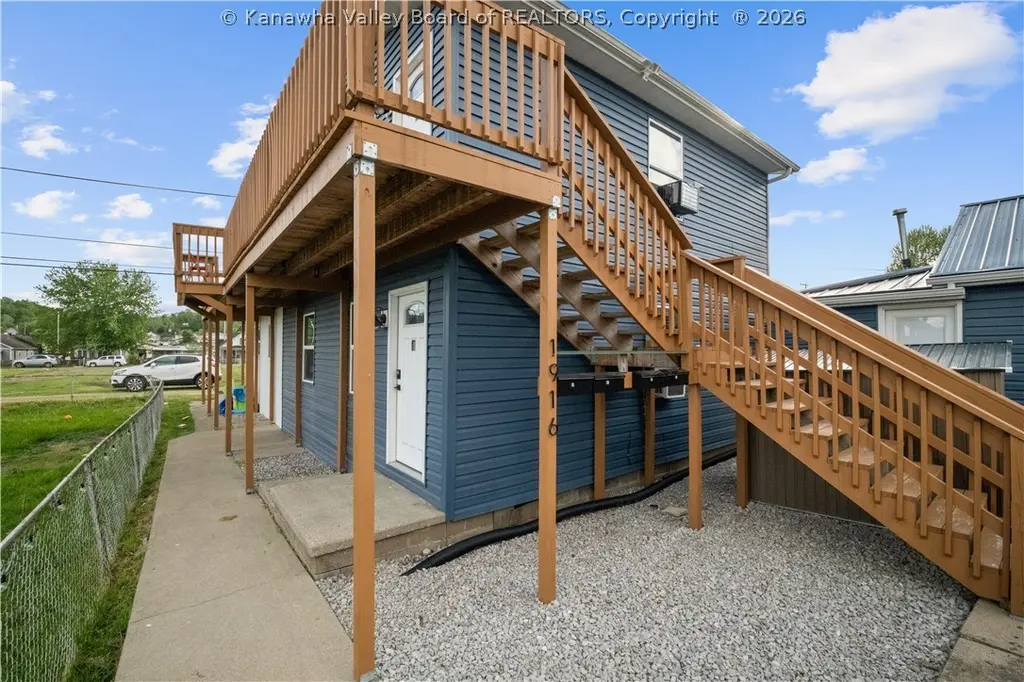
1916 Beech St · Kenova, WV
Flood risk 1/10 · Minimal
- FEMA flood zone
- X
- Chance of flooding over 30 yrs
- 0.0%
- Est. flood insurance / yr
- $507 – $1,088
Fire risk 4/10 · Minor
- Est. fire insurance / yr
- $787 – $1,461
Heat risk 5/10 · Moderate
- Hot days now (above 102°F)
- 7 days/yr
- Hot days in 30 yrs
- 20 days/yr
Wind risk 2/10 · Minimal
- Chance of severe wind over 30 yrs
- 1.0%
Air-quality risk 2/10 · Minimal
- Unhealthy air days now
- 0 days/yr
- Unhealthy air days in 30 yrs
- 1 days/yr
Risk factors via First Street. Map © Google.
Why this score? — see what drove the F grade
The composite is a weighted blend of 9 inputs, each scored 0–100. Each bar is that input's sub-score; the figure is the points it added to the 100-point composite (weight × sub-score).
- Appreciation +10.0/10.0
- ARV discount +7.5/15.0
- Livability +4.2/5.0
- Schools +2.6/10.0
- Rent growth +2.5/5.0
- Condition / age +2.5/5.0
- Cash flow +0.0/30.0
- 1% rule +0.0/10.0
- DSCR +0.0/10.0
$477,973
🖨 Deal sheet 📄 Offer letter ✓ Due diligence
Listing remarks MLS
Step into this income generating opportunity! this quadplex allows for flexibility and income all together. Located 15 minutes from downtown Huntington and MarshalL University. This property has a historic occupancy rate of 100%! Don't miss out on this beautiful multifamily chance in Ceredo Kenova.
Key facts
- Built 1979
- Listed 22 days
Property features AI
Exterior
- Parking: No on-site parking listed
- Utilities: Public water
- Home design: Residential income property; Apartment
- Construction: Block construction
- Exterior features: Composition shingle roof
Interior
- Kitchen: Dishwasher; Oven; Range; Refrigerator
- Heating & cooling: Central air conditioning; Forced air heating
- Interior features: Insulated windows; No basement
- Laundry & utility: Washer hookup
Neighborhood map
What this means for you Summary
Snapshot
- This is a townhouse listed at $478k.
Deal economics
- At list price, monthly cash flow is $-3k ($-34k/yr) — negative.
- Rent doesn't cover operating costs at any purchase price — skip.
- Recommended offer: $471k (1.5% below list) — sets the bar for market timing.
Location & tenants
- Location reads 84/100 on livability (#6 in WV, #796 nationally) — a professional / high-income tenant draw. Strengths: crime A+, commute A+, cost of living A+; Watch: schools F, employment D-.
- Wayne County Schools (rural): math 25% / reading 38% proficiency, ranked #25 of 55 in WV (top 46%) — families likely to look elsewhere, expect single-tenant / working-renter base with shorter leases.
- Market conditions: 25 active listings in the ZIP; 67 units permitted in Wayne County in 2024 (0 in 5+ unit buildings).
Forward outlook
- In year one you build about $51k of equity ($3k loan paydown + $48k appreciation (10.0% local appreciation)).
- Wayne County population projected at -22% by 2050 — secular population decline; favor cash flow + early exit over multi-decade hold.
- By year 2, paydown + projected appreciation supports a ~$82k cash-out refi (75% LTV) — recoverable capital for the next deal without selling this one.
Negotiation context
- It's been on market 23 days — a 2% lower offer ($471k) is reasonable based on typical stale-listing flexibility.
- 2 sale attempts with the ask held roughly flat each time — persistent listings suggest the price (not the market) is what's stuck; bring a comps-based counter.
- Current owner paid $162k; list at $478k implies a 194% gain — meaningful room to come down on a strong offer.
Risks & watch-outs
- Climate carrying-cost: extreme-heat days projected 7→20/yr by 2055 (HVAC capex compounding) — expect insurance premiums to compound above CPI over the hold.
Questions for the listing agent
- What do current leases actually rent for vs. the listed asking? Can we see a recent rent roll and the last 12 months of T-12 income?
- Built in 1979 — when were the roof, HVAC, electrical panel, plumbing, and water heater last replaced?
- Is there a deadline driving the sale (1031 exchange, divorce, estate, relocation)? That informs how much negotiation room exists.
- Schools are F-rated, which usually means shorter tenancies and higher turnover. Who's the typical renter profile here, and what's been the actual vacancy rate?
- The area grade is low — what's the realistic commute time and amenity access for the typical tenant pool here? Any planned neighborhood developments (good or bad) we should know about?
- What's the average days-on-market for RENTAL listings here right now (not sales)? A rising rental-DOM trend means longer vacancies and softer asking-rent achievability than the comps imply.
- What's the recent tenant-quality profile in this submarket — average credit score on applications, eviction rate, late-payment / NSF rate, and stable-employment percentage? A property-management company in the area should have these aggregated.
- How much new for-sale + rental construction is in the pipeline within 1–3 miles? Heavy new supply typically softens prices + rents 12–24 months out; constrained supply supports both.
Investment metrics
- 1% rule
- 0.00% ✗
- Cap rate
- -0.80%
- Cash-on-cash
- -25.33%
- DSCR
- -0.13
- GRM
- 0.0
CMA / ARV
No comps found within radius.
Projected returns pro-forma
10.0% appreciation · 3.0% rent growth · sell at horizon
- IRR
- 7.1%
- Equity multiple
- 1.60×
- Total profit
- $80,093
- Equity at exit
- $430,596
- IRR
- 9.3%
- Equity multiple
- 3.82×
- Total profit
- $376,772
- Equity at exit
- $928,596
Cash invested: $133,832 (down + closing). Projections, not guarantees.
Landlord ↔ Tenant lean methodology
- Overall (STATE)
- 83 Strongly Landlord-Friendly
- State West Virginia
- 83 Strongly Landlord-Friendly · R+22
- County
- — inherits STATE
- City
- — inherits STATE
ZIP-level market 25530
- Home prices YoY
- 7.7%
- Active inventory
- 25
Monthly cashflow live
- Estimated rent
- $0 none
- Mortgage (P&I)
- −$2,507
- Tax from tax record
- −$119 /mo · $1,432/yr
- Insurance
- −$199
- HOA
- −$0
- Vacancy / Maint / Mgmt
- −$0
- Net cashflow
- $-2,825
Break-even live
UW: 25.0% down · 7.5% · 30yr · 1.5% tax · 5.0% vac · 8.0% maint · 8.0% mgmt
Financing live
Cash to close
- Down payment
- $119,493
- Closing costs
- $14,339
- Reserves months
- —
- Total cash needed
- —
Loan-product check · same deal, 3 products live
Conventional
25% down · 7.5% · 30yr
- Down + closing
- —
- Monthly P&I
- —
- Monthly cashflow
- —
- DSCR
- —
- Eligible?
- —
Personal DTI + credit; lowest rate.
DSCR
20% down · 8.5% · 30yr
- Down + closing
- —
- Monthly P&I
- —
- Monthly cashflow
- —
- DSCR
- —
- Eligible?
- —
No personal income docs; deal must DSCR.
Hard money
10% down · 12.0% · 12mo
- Down + closing
- —
- Monthly P&I
- —
- Monthly cashflow
- —
- DSCR
- —
- Eligible?
- —
Short-term bridge; refi at stabilization.
Listing history 22 events
-
2026-06-19days on market $477,973 Active 23 DOM
-
2026-06-18days on market $477,973 Active 22 DOM
-
2026-06-17days on market $477,973 Active 21 DOM
-
2026-06-16days on market $477,973 Active 20 DOM
-
2026-06-15days on market $477,973 Active 19 DOM
-
2026-06-14days on market $477,973 Active 17 DOM
-
2026-06-12days on market $477,973 Active 16 DOM
-
2026-06-09days on market $477,973 Active 13 DOM
-
2026-06-08days on market $477,973 Active 12 DOM
-
2026-06-07days on market $477,973 Active 11 DOM
-
2026-06-05days on market $477,973 Active 8 DOM
-
2026-06-03days on market $477,973 Active 7 DOM
-
2026-06-02days on market $477,973 Active 6 DOM
-
2026-06-01days on market $477,973 Active 5 DOM
-
2026-05-31days on market $477,973 Active 4 DOM
-
2026-05-30days on market $477,973 Active 3 DOM
-
2026-05-27$477,973 Active 299-char remark
Show marketing remark (299 chars)
Step into this income generating opportunity! this quadplex allows for flexibility and income all together. Located 15 minutes from downtown Huntington and MarshalL University. This property has a historic occupancy rate of 100%! Don't miss out on this beautiful multifamily chance in Ceredo Kenova.
-
2026-05-27$477,973 Active
Show marketing remark (299 chars)
Step into this income generating opportunity! this quadplex allows for flexibility and income all together. Located 15 minutes from downtown Huntington and MarshalL University. This property has a historic occupancy rate of 100%! Don't miss out on this beautiful multifamily chance in Ceredo Kenova.
-
2012-02-16soldstatus $162,500
-
2012-02-16soldstatus $189,000
-
2008-12-11soldstatus $349,000
-
1999-06-23soldstatus $187,000
ⓘ Source: listings_history table (triggers on properties + properties_extension) + one-shot
backfill from property_details.listing_events for pre-trigger history.
Tax reassessment forecast WV · Resets to sale price
- Current annual tax
- $1,432 · $119/mo
- Projected year-2 tax
- $2,820 · $235/mo
- Expected delta
- +$1,388/yr (+$116/mo · 96.9%)
ⓘ Screening estimate from a state-policy table — verify with the county assessor before closing.
Climate risk First Street
- Flood 1/10 Low FEMA zone X · 0% chance over 30 yrs
- Wildfire 4/10 Moderate
- Heat 5/10 Major 7 d/yr ≥102°F today · 20 d/yr by 30 yrs out
- Wind 2/10 Low 100% chance of damaging wind over 30 yrs
- Air quality 2/10 Low 0 unhealthy d/yr today · 1 by 30 yrs out
Nearby sold comps map
Loading sold comps map…
Walkable amenities ~0.75 mi
Loading nearby amenities…
Taxation est. · year 1
- Rental income
- $0
- − Mortgage interest
- −$26,774
- − Property taxes
- −$1,432
- − Insurance
- −$2,390
- − Repairs & maintenance
- −$0
- − Management
- −$0
- − Depreciation
- −$13,905
- Taxable loss
- −$44,501
- Est. tax savings @ 24.0%
- +$10,680
- After-tax cash flow
- $-23,221/yr
For passive investors: Depreciation is non-cash, so a rental often shows a tax loss while cash-flowing — sheltering income. Rental losses are passive: they offset passive income freely, and up to $25,000/yr can offset ordinary (W-2) income if you actively participate and your MAGI is under $100k (phasing out to $0 by $150k); unused losses carry forward. On sale, claimed depreciation is recaptured at up to 25%, and gains may owe capital-gains tax (a 1031 exchange can defer both). Figures are a year-1 estimate at your 24.0% rate — not tax advice; consult a CPA.
Schools (NCES district)
- District
- Wayne County Schools
- NCES district ID
- 5401500
- Math proficiency
- 25% ▼ -15.00%
- Reading proficiency
- 38% ▼ -10.00%
- Median HH income
- $36,283
- Composite
- 26.08/100
- National rank
- #7297
- State rank
- #25 of 55 in WV
Livability — Kenova
- Score
- 84/100
- State rank
- #6
- US rank
- #796
Category grades
Schools grade is shown separately in the Schools card above.
Census & demographics
- Census place
- Kenova, WV
- Population (ZIP)
- 6,642
Population outlook (Wayne County) Hauer SSP2
- Today (2025)
- 38,267 people
- By 2030
- 36,578 · -4.4%
- By 2040
- 33,034 · -13.7%
- By 2050
- 29,671 · -22.5%
- By 2075
- 22,901 · -40.2%
- By 2100
- 17,421 · -54.5%
Race, ethnicity, and origin ACS 2023
- Neighborhood character
- Predominantly White (94%)
- Race & ethnicity
- White 94% Two or more races 4% Black 2%
- Common ancestry
- Scottish 4% Italian 4% Serbian 2%
Political lean MEDSL · Wayne
- 2024 margin
- Solid R (+53.4) · D 22.4% · R 75.8% · Other 1.8%
- 2008→2024 swing
- -35.1pp toward R · 2008: -18.2pp · 2024: -53.4pp
- All cycles
- 2024: R+53.4 2020: R+50.1 2016: R+51.3 2012: R+27.0 2008: R+18.2
Not yet ingested
- Civics
- —
Market trends
- HPI YoY
- ▲ 14.35%
- Current HPI
- 201.9673
- Rent YoY
- —
- Metro
- —
- State GDP YoY
- —
- F500 in state
- 0
Price history
+155.6% since first listed6 events — show timeline
- 2026-05-27 Listed $477,973 HBRMLS
- 2026-05-27 Listed $477,973 KVBOR
- 2012-02-16 Sold (Public Records) $189,000 Public Records
- 2012-02-16 Sold (Public Records) $162,500 Public Records
- 2008-12-11 Sold (Public Records) $349,000 Public Records
- 1999-06-23 Sold (Public Records) $187,000 Public Records
Property tax history
+0.8%/yrLatest (2025): $1,432 · +6.6% YoY. Source: county tax records.
Cash-flow waterfall
monthlySold comps — $/sqft
last 12 mo · ≤1 miLoading sold comps…