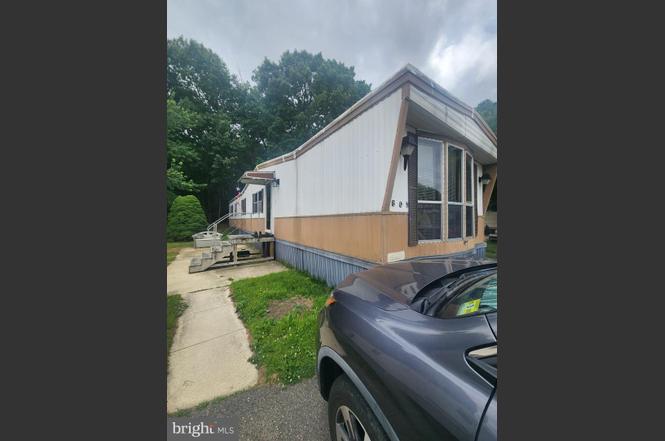
507 Cleveland Ave · Williamstown, NJ
Flood risk No data
- FEMA flood zone
- —
- Chance of flooding over 30 yrs
- —
- Est. flood insurance / yr
- —
Fire risk No data
- Est. fire insurance / yr
- —
Heat risk No data
- Hot days now (above threshold)
- —
- Hot days in 30 yrs
- —
Wind risk No data
- Chance of severe wind over 30 yrs
- —
Air-quality risk No data
- Unhealthy air days now
- —
- Unhealthy air days in 30 yrs
- —
Risk factors via First Street. Map © Google.
Why this score? — see what drove the C- grade
The composite is a weighted blend of 9 inputs, each scored 0–100. Each bar is that input's sub-score; the figure is the points it added to the 100-point composite (weight × sub-score).
- Cash flow +15.0/30.0
- ARV discount +15.0/15.0
- 1% rule +5.0/10.0
- DSCR +5.0/10.0
- Livability +3.5/5.0
- Schools +3.0/10.0
- Rent growth +2.5/5.0
- Condition / age +2.2/5.0
- Appreciation +0.0/10.0
$55,000
🖨 Deal sheet (PDF) 📄 Offer letter ✓ Due diligence
Listing remarks
Welcome to 507 Cleveland Ave, Williamstown, NJ! This charming 2 bedroom, 1 bath home features soaring vaulted ceilings that give the living space an open and airy feel. Enjoy the enclosed porch, perfect for relaxing year round. Spacious rooms throughout offer plenty of room to make this home your own. Located in a convenient Williamstown location close to shopping, dining, and major roadways. Do not miss this one!
Key facts
- Enclosed porch
- Convenient location
- Vaulted ceilings
Tags
Property features AI
Finance
- HOA & community: Monthly land lease payment of $880
Exterior
- Parking: Driveway
- Utilities: Public water; Public sewer; Electric hot water
- Home design: Manufactured home (modular/manufactured); Above-grade living space
- Construction: Manufactured construction materials; Year built estimated
- Exterior features: Tidal water not present; Land lease with approximately 99 years remaining (monthly land lease payment)
Interior
- Bedrooms: 2 bedrooms on the main level
- Bathrooms: 1 full bathroom on the main level; 1 full bathroom total
- Heating & cooling: Heat pump with oil backup; Central air (electric)
- Interior features: Estimated living area; No basement; 2 or more access exits
Neighborhood map
What this means for you Summary
Snapshot
- This is a 2-bed/1.0-bath single-family listed at $55k. Condition is rated fair.
Deal economics
- At list price, monthly cash flow is $1k ($18k/yr) — positive.
- The deal already cash-flows at list — no discount required.
- Meets the 1% rule at list price ($2k rent vs $55k).
- Cap rate 38.6% vs local median 4.9% in Williamstown — top-decile yield for the area; either an underpriced asset or a hidden risk that comps aren't pricing in. Stress-test before assuming the spread holds.
Location & tenants
- Location reads 69/100 on livability (#289 in NJ) — a middle-class / working-renter tenant base. Strengths: employment A+, housing A+; Watch: cost of living D+, amenities F, commute F.
- Monroe Township Public School District (suburban): math 20% / reading 45% proficiency, ranked #302 of 472 in NJ (top 64%) — families likely to look elsewhere, expect single-tenant / working-renter base with shorter leases.
- Market conditions: 268 active listings in the ZIP; 4 comparable units currently listed for rent nearby; rentals leasing fast (median 4d on market — plan ~1-2 weeks tenant-placement turnaround); solid renter incomes; 1,047 units permitted in Gloucester County in 2024 (183 in 5+ unit buildings).
Forward outlook
- Local home prices are declining (-3.0%/yr); year-one equity from $380 of loan paydown is wiped out by about $2k of value loss. Plan a longer hold.
- Gloucester County population projected to shrink 5% by 2050 — rents likely to lag national; underwrite the cash flow, not the appreciation.
- At projected returns (-3.0% appreciation + 3.0% rent growth), your $15k cash investment doubles in ~1 year — after that, you're playing with house money.
Negotiation context
- Only 8 days on market — expect competitive offers; lowballing is unlikely to land.
Questions for the listing agent
- Have any recent inspections been done? Can we get a copy of the seller's disclosures and any deferred-maintenance estimates?
- Is there a deadline driving the sale (1031 exchange, divorce, estate, relocation)? That informs how much negotiation room exists.
- What's the average days-on-market for RENTAL listings here right now (not sales)? A rising rental-DOM trend means longer vacancies and softer asking-rent achievability than the comps imply.
- What's the recent tenant-quality profile in this submarket — average credit score on applications, eviction rate, late-payment / NSF rate, and stable-employment percentage? A property-management company in the area should have these aggregated.
- How much new for-sale + rental construction is in the pipeline within 1–3 miles? Heavy new supply typically softens prices + rents 12–24 months out; constrained supply supports both.
Investment metrics
- 1% rule
- 4.28% ✓
- Cap rate
- 38.56%
- Cash-on-cash
- 115.25%
- DSCR
- 6.13
- GRM
- 1.9
CMA / ARV
- ARV (on-the-fly)
- $77,420
- Comps found
- 12
Show comp detail 12 sales within ~0.75 mi
| Address | Dist | Beds/Ba | Sqft | Sold | Price | $/sf | Match |
|---|---|---|---|---|---|---|---|
| 218 Eisenhower Dr | 0.13mi | 2/1.0 | 980 (0%) | 11mo | $64,000 | $65 | 85 |
| 202 Polk Ave | 0.23mi | 2/2.0 | 980 (0%) | 7mo | $82,000 | $84 | 80 |
| 320 Kentucky Ave | 0.23mi | 2/2.0 | 980 (0%) | 9mo | $77,000 | $79 | 78 |
| 107 Harrison Ave | 0.22mi | 2/2.0 | 980 (0%) | 13mo | $45,850 | $47 | 75 |
| 318 Kentucky Ave | 0.28mi | 2/1.0 | 960 (-2%) | 11mo | $75,000 | $78 | 74 |
| 205 Adams Ave | 0.17mi | 2/2.0 | 1,000 (+2%) | 14mo | $86,000 | $86 | 73 |
| 201 Eisenhower Ave | 0.19mi | 2/2.0 | 1,040 (+6%) | 10mo | $73,000 | $70 | 68 |
| 205 Michigan Ave | 0.27mi | 2/2.0 | 910 (-7%) | 7mo | $89,500 | $98 | 66 |
| 109 Kennedy Ave | 0.09mi | 3/2.0 (+1) | 1,100 (+12%) | 11mo | $102,500 | $93 | 57 |
| 301 Arizona Ave | 0.37mi | 3/1.0 (+1) | 900 (-8%) | 12mo | $73,352 | $82 | 54 |
| 237 Harrison Ave | 0.14mi | 3/1.0 (+1) | 840 (-14%) | 14mo | $25,000 | $30 | 54 |
| 306 Oklahoma Ave | 0.35mi | 3/2.0 (+1) | 1,100 (+12%) | 7mo | $78,500 | $71 | 48 |
Match score weights: distance 35% · size 25% · config 20% · recency 20%. Top-matched comps best support the ARV.
Projected returns pro-forma
-3.0% appreciation · 3.0% rent growth · sell at horizon
- IRR
- —
- Equity multiple
- 6.54×
- Total profit
- $85,327
- Equity at exit
- $8,201
- IRR
- —
- Equity multiple
- 13.71×
- Total profit
- $195,748
- Equity at exit
- $4,755
Cash invested: $15,400 (down + closing). Projections, not guarantees.
Landlord ↔ Tenant lean methodology
- Overall (STATE)
- 21 Tenant-Leaning
- State New Jersey
- 21 Tenant-Leaning · D+6
- County
- — inherits STATE
- City
- — inherits STATE
ZIP-level market 08094
- Active inventory
- 268
- Price-to-rent
- 1.9×
Monthly cashflow live
- Estimated rent
- $2,353 medium interval (Pro) →
- Mortgage (P&I)
- −$288
- Tax est. 1.5%
- −$69 /mo · $825/yr
- Insurance
- −$23
- HOA
- −$0
- Vacancy / Maint / Mgmt
- −$494
- Net cashflow
- $1,479
Break-even live
Sensitivity live
| Price | -10% $1,517 | -5% $1,498 | +0% $1,479 | +5% $1,460 | +10% $1,441 |
|---|---|---|---|---|---|
| Rent | -10% $1,293 | -5% $1,386 | +0% $1,479 | +5% $1,572 | +10% $1,665 |
| Rate | -1.0pp $1,507 | -0.5pp $1,493 | base $1,479 | +0.5pp $1,465 | +1.0pp $1,450 |
UW: 25.0% down · 7.5% · 30yr · 1.5% tax · 5.0% vac · 8.0% maint · 8.0% mgmt
Financing live
Cash to close
- Down payment
- $13,750
- Closing costs
- $1,650
- Reserves months
- —
- Total cash needed
- —
Loan-product check · same deal, 3 products live
Conventional
25% down · 7.5% · 30yr
- Down + closing
- —
- Monthly P&I
- —
- Monthly cashflow
- —
- DSCR
- —
- Eligible?
- —
Personal DTI + credit; lowest rate.
DSCR
20% down · 8.5% · 30yr
- Down + closing
- —
- Monthly P&I
- —
- Monthly cashflow
- —
- DSCR
- —
- Eligible?
- —
No personal income docs; deal must DSCR.
Hard money
10% down · 12.0% · 12mo
- Down + closing
- —
- Monthly P&I
- —
- Monthly cashflow
- —
- DSCR
- —
- Eligible?
- —
Short-term bridge; refi at stabilization.
Rent comps 4 comps
| Address | Beds | Baths | Sqft | Rent | $/sqft | DOM | Units | Dist |
|---|---|---|---|---|---|---|---|---|
| 1616 N Main St Williamstown, NJ | 2.0 | 2.0 | 1064 | $2,500 | $2.35 | 2d | 1 | 0.27mi |
| 1941 N Black Horse Pike Williamstown, NJ | 1.0–2.0 | 1.0 | 832 | $1,662 | $2.00 | 4d | 1 | 0.29mi |
| 1000 Fawn Dr Williamstown, NJ | 1.0–2.0 | 1.0–2.0 | 1209 | $5,983 | $4.95 | 1d | 1 | 0.91mi |
| 212 Woodlawn Ave Unit B Sewell, NJ | 2.0 | 1.0 | 1000 | $1,750 | $1.75 | 12d | 1 | 1.23mi |
Listing history 6 events
-
2026-06-18days on market $55,000 Active 8 DOM
-
2026-06-17days on market $55,000 Active 7 DOM
-
2026-06-16days on market $55,000 Active 6 DOM
-
2026-06-15days on market $55,000 Active 5 DOM
-
2026-06-13remarks 417-char remark
-
2026-06-13$55,000 Active 3 DOM
ⓘ Source: listings_history table (triggers on properties + properties_extension) + one-shot
backfill from property_details.listing_events for pre-trigger history.
Nearby sold comps map
Loading sold comps map…
Walkable amenities ~0.75 mi
Loading nearby amenities…
Taxation est. · year 1
- Rental income
- $28,241
- − Mortgage interest
- −$3,081
- − Property taxes
- −$825
- − Insurance
- −$275
- − Repairs & maintenance
- −$2,259
- − Management
- −$2,259
- − Depreciation
- −$1,600
- Taxable income
- $17,941
- Est. tax owed @ 24.0%
- −$4,306
- After-tax cash flow
- $13,443/yr
For passive investors: Depreciation is non-cash, so a rental often shows a tax loss while cash-flowing — sheltering income. Rental losses are passive: they offset passive income freely, and up to $25,000/yr can offset ordinary (W-2) income if you actively participate and your MAGI is under $100k (phasing out to $0 by $150k); unused losses carry forward. On sale, claimed depreciation is recaptured at up to 25%, and gains may owe capital-gains tax (a 1031 exchange can defer both). Figures are a year-1 estimate at your 24.0% rate — not tax advice; consult a CPA.
Condition & rehab AI · 13 photos
This home requires moderate repairs and maintenance to improve its condition and value. Key areas for improvement include the kitchen, bathrooms, roof, exterior, and HVAC system.
Repairs flagged
- Moderate kitchen cabinets — dated and worn
- Moderate bathroom fixtures — basic and dated
- Moderate roof shingles — visible wear
- Moderate exterior siding — moderate wear
- Moderate HVAC units — basic units, no visible wear
Value-add opportunities
- Resale paint interior walls — Fresh paint can make a significant difference in the home's appearance
- Resale replace kitchen cabinets — Modern cabinets can greatly enhance the kitchen's appeal
- Resale repair roof shingles — A new roof can significantly increase the home's value
- Resale repair exterior siding — A fresh coat of paint or new siding can greatly improve curb appeal
- Both replace HVAC units — Modern, energy-efficient HVAC units can improve comfort and reduce energy costs
Renovation cost estimate screening
| Repair item | Severity | Est. cost |
|---|---|---|
| kitchen cabinets · dated and worn | Moderate | $3,000–15,000 |
| bathroom fixtures · basic and dated | Moderate | $3,000–15,000 |
| roof shingles · visible wear | Moderate | $3,000–15,000 |
| exterior siding · moderate wear | Moderate | $3,000–15,000 |
| HVAC units · basic units, no visible wear | Moderate | $3,000–15,000 |
| Total estimated repair cost · 5 items | $15,000–75,000 |
Value-add ROI direction
- Resale paint interior walls — Fresh paint can make a significant difference in the home's appearance ↑
- Resale replace kitchen cabinets — Modern cabinets can greatly enhance the kitchen's appeal ↑
- Resale repair roof shingles — A new roof can significantly increase the home's value ↑
- Resale repair exterior siding — A fresh coat of paint or new siding can greatly improve curb appeal ↑
- Both replace HVAC units — Modern, energy-efficient HVAC units can improve comfort and reduce energy costs ↑
ⓘ Cost ranges are severity-bucket heuristics (US national rule-of-thumb). Get contractor quotes + a written scope before underwriting a rehab budget.
Schools (NCES district)
- District
- Monroe Township Public School District
- NCES district ID
- 3410470
- Math proficiency
- 20% ▼ -24.00%
- Reading proficiency
- 45% ▼ -9.00%
- Median HH income
- $71,557
- Composite
- 30.24/100
- National rank
- #6295
- State rank
- #302 of 472 in NJ
Livability — Williamstown
- Score
- 69/100
- State rank
- #289
- US rank
- #8603
Category grades
Schools grade is shown separately in the Schools card above.
Census & demographics
- County
- Gloucester County · 160,422 people
- City population
- 41,595
- Metro
- Philadelphia-Camden-Wilmington, PA-NJ-DE-MD
- Population (ZIP)
- 41,595
- Household income
- $96,699
- Rent vs Own
- Severe rent burden
- 721.0
Population outlook (Gloucester County) Hauer SSP2
- Today (2025)
- 298,895 people
- By 2030
- 299,031 · +0.0%
- By 2040
- 294,020 · -1.6%
- By 2050
- 284,188 · -4.9%
- By 2075
- 260,720 · -12.8%
- By 2100
- 229,565 · -23.2%
Race, ethnicity, and origin ACS 2023
- Neighborhood character
- Predominantly White (73%)
- Race & ethnicity
- White 73% Hispanic / Latino 11% Black 10% Two or more races 8% Asian 1%
- Hispanic origin (detail)
- Puerto Rican 6% Dominican 1%
- Common ancestry
- Romanian 6% Slovak 2% Lithuanian 1%
- Foreign-born
- 4% · Canada
- Languages at home
- 92% English-only · Spanish 5% Russian/Polish/Slavic 1%
Political lean MEDSL · Gloucester
- 2024 margin
- Toss-up / Even · D 47.8% · R 50.6% · Other 1.6%
- 2008→2024 swing
- -15.0pp toward R · 2008: 12.2pp · 2024: -2.8pp
- All cycles
- 2024: R+2.8 2020: D+1.9 2016: R+0.4 2012: D+10.5 2008: D+12.2
Not yet ingested
- Civics
- —
Market trends
- HPI YoY
- ▼ -213.12%
- Current HPI
- 278.3849
- Rent YoY
- —
- Metro
- Philadelphia-Camden-Wilmington, PA-NJ-DE-MD
- State GDP YoY
- ▲ 2.05%
- F500 in state
- 34
Industry mix (Fortune 500 HQ in NJ)
| Industry | F500 HQs | Revenue |
|---|---|---|
| Consumer Goods | 3 | $31B |
|
||
| Pharmaceuticals | 2 | $153B |
|
||
| Technology | 2 | $21B |
|
||
| Insurance | 2 | $20B |
|
||
| Healthcare | 2 | $19B |
|
||
| Financial Services | 1 | $70B |
|
||
Price history
1 event — show timeline
- 2026-06-10 Listed $55,000 BRIGHT MLS
Cash-flow waterfall
monthlySold comps — $/sqft
last 12 mo · ≤1 miLoading sold comps…