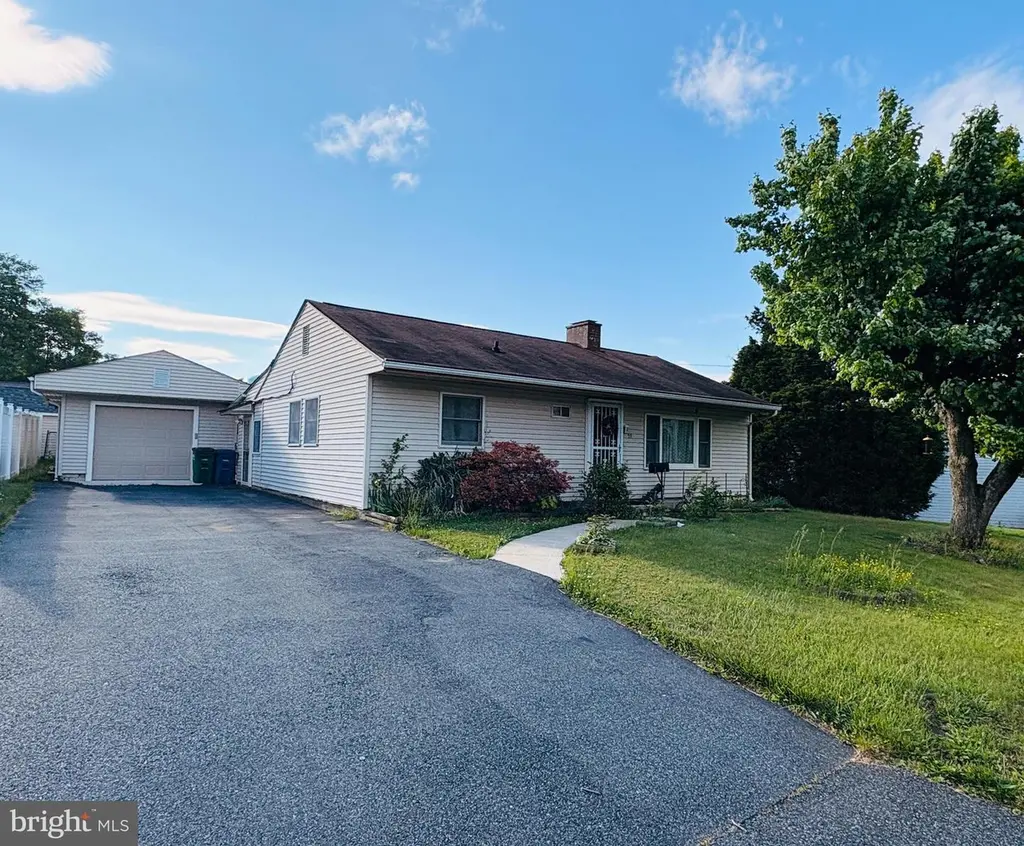
59 Moyer Dr · Aberdeen, MD
Flood risk 1/10 · Minimal
- FEMA flood zone
- X (unshaded)
- Chance of flooding over 30 yrs
- 0.0%
- Est. flood insurance / yr
- $507 – $1,088
Fire risk 2/10 · Minimal
- Est. fire insurance / yr
- $755 – $1,403
Heat risk 7/10 · Major
- Hot days now (above 104°F)
- 7 days/yr
- Hot days in 30 yrs
- 15 days/yr
Wind risk 6/10 · Moderate
- Chance of severe wind over 30 yrs
- 27.0%
Air-quality risk 3/10 · Minor
- Unhealthy air days now
- 2 days/yr
- Unhealthy air days in 30 yrs
- 3 days/yr
Risk factors via First Street. Map © Google.
Why this score? — see what drove the D grade
The composite is a weighted blend of 9 inputs, each scored 0–100. Each bar is that input's sub-score; the figure is the points it added to the 100-point composite (weight × sub-score).
- Cash flow +12.4/30.0
- ARV discount +10.3/15.0
- Livability +4.0/5.0
- DSCR +3.7/10.0
- Schools +2.9/10.0
- 1% rule +2.6/10.0
- Rent growth +2.6/5.0
- Condition / age +2.5/5.0
- Appreciation +0.0/10.0
$249,900
🖨 Deal sheet 📄 Offer letter ✓ Due diligence
Listing remarks
Charming and full of potential! This adorable ranch-style home offers a fantastic opportunity for first-time home buyers, downsizers or investors looking to add their personal touch. Currently featuring 2 bedrooms, the home was originally a 3 bedroom and included a sewing room that could easily be converted back to a third bedroom. Enjoy convenient one-level living, a detached garage, spacious driveway, and a lovely yard. The charm of the enclosed back porch is perfect for relaxing, family dinners, hobbies or additional living space. Full of character and great possibilities, this well-loved home is ready for its next chapter!
Key facts
- 6,700 sq ft lot
- Garage
- Built 1950
Property features AI
Exterior
- Parking: Detached garage (front and side entry); One garage space; Four driveway spaces; On-street parking available; Paved driveway; Total of five parking spaces
- Utilities: Public water; Private sewer; Cable TV available; Municipal trash not provided
- Home design: Detached property; Building not winterized; Property in good condition; Fee simple ownership
- Construction: Aluminum and vinyl siding; Block foundation; Composite shingle roof; Garage structure present; Year built information from assessor
- Exterior features: Chain link fencing; Not in a federal flood zone; No tidal water
Interior
- Kitchen: Refrigerator included
- Bedrooms: Three main-level bedrooms; Room list includes living room, bedroom 1, bedroom 2, bedroom 3, kitchen, sun/florida room, bathroom
- Flooring: Carpet; Concrete; Vinyl
- Bathrooms: One full bathroom (main level)
- Heating & cooling: Forced air heating with natural gas; Heat pump with gas backup; Central air conditioning (central A/C); Natural gas hot water
- Interior features: Family room off the kitchen; Tub with shower; Storm door; Drywall and paneled walls
- Laundry & utility: Washer and dryer on the main floor
Neighborhood map
What this means for you Summary
Snapshot
- This is a 3-bed/1.0-bath single-family listed at $250k.
Deal economics
- At list price, monthly cash flow is $-40 ($-484/yr) — negative.
- To cash-flow at today's rent, offer at most $243k (2.9% below list).
- To meet the 1% rule (rent ≥ 1% of price), the offer needs to be $189k (24.4% below list).
- Recommended offer: $189k (24.4% below list) — sets the bar for 1% rule.
- Cap rate 6.1% vs local median 4.9% in Aberdeen — meaningfully above typical; check what's discounted (condition, days-on-market, listing class) to confirm the premium yield is real.
Location & tenants
- Location reads 81/100 on livability (#42 in MD, #1,545 nationally) — a professional / high-income tenant draw. Strengths: commute A+, housing A+, health & safety A+; Watch: schools C-, crime F.
- Harford County Public Schools (suburban): math 22% / reading 39% proficiency, ranked #9 of 24 in MD (top 38%) — families likely to look elsewhere, expect single-tenant / working-renter base with shorter leases.
- Market conditions: Rents flat; 186 active listings in the ZIP; 16 comparable units currently listed for rent nearby; rentals leasing fast (median 5d on market — plan ~1-2 weeks tenant-placement turnaround); solid renter incomes; 803 units permitted in Harford County in 2024 (26 in 5+ unit buildings).
Forward outlook
- Local home prices are declining (-3.0%/yr); year-one equity from $2k of loan paydown is wiped out by about $7k of value loss. Plan a longer hold.
Negotiation context
- Only 12 days on market — expect competitive offers; lowballing is unlikely to land.
Risks & watch-outs
- Watch-outs: built in 1950 — expect roof / HVAC / electrical / plumbing capex.
- Climate carrying-cost: major wind risk, 27% chance of damaging wind over 30y; extreme-heat days projected 7→15/yr by 2055 (HVAC capex compounding) — expect insurance premiums to compound above CPI over the hold.
Questions for the listing agent
- What do current leases actually rent for vs. the listed asking? Can we see a recent rent roll and the last 12 months of T-12 income?
- Built in 1950 — when were the roof, HVAC, electrical panel, plumbing, and water heater last replaced?
- Is there a deadline driving the sale (1031 exchange, divorce, estate, relocation)? That informs how much negotiation room exists.
- Crime grade is F in this area — have there been break-ins, vandalism, or insurance claims at this property in the last 3 years? What carrier currently insures it and at what premium?
- The area grade is low — what's the realistic commute time and amenity access for the typical tenant pool here? Any planned neighborhood developments (good or bad) we should know about?
- What's the average days-on-market for RENTAL listings here right now (not sales)? A rising rental-DOM trend means longer vacancies and softer asking-rent achievability than the comps imply.
- What's the recent tenant-quality profile in this submarket — average credit score on applications, eviction rate, late-payment / NSF rate, and stable-employment percentage? A property-management company in the area should have these aggregated.
- How much new for-sale + rental construction is in the pipeline within 1–3 miles? Heavy new supply typically softens prices + rents 12–24 months out; constrained supply supports both.
Investment metrics
- 1% rule
- 0.76% ✗
- Cap rate
- 6.10%
- Cash-on-cash
- -0.69%
- DSCR
- 0.97
- GRM
- 11.0
CMA / ARV
- ARV (median comp)
- $266,536
- List price
- $249,900
- Delta
- -6.24%
- Verdict
- FAIR
- Comps
- 20 within 1.0 mi
Show comp detail 12 sales within ~0.75 mi
| Address | Dist | Beds/Ba | Sqft | Sold | Price | $/sf | Match |
|---|---|---|---|---|---|---|---|
| 36 Moyer Dr | 0.06mi | 3/1.0 | 1,226 (+0%) | 9mo | $269,900 | $220 | 89 |
| 7 Alton St | 0.23mi | 3/1.0 | 1,320 (+8%) | 9mo | $230,000 | $174 | 69 |
| 647 Elm St | 0.30mi | 2/2.0 (-1) | 1,268 (+4%) | 3mo | $310,000 | $244 | 69 |
| 438 Chestnut St | 0.41mi | 3/2.0 | 1,268 (+4%) | 5mo | $340,000 | $268 | 67 |
| 303 Graceford Dr | 0.45mi | 3/1.5 | 1,362 (+11%) | 3mo | $299,000 | $220 | 55 |
| 217 Graceford Dr | 0.35mi | 3/1.5 | 1,362 (+11%) | 11mo | $305,000 | $224 | 54 |
| 439 Washington St | 0.65mi | 3/2.0 | 1,164 (-5%) | 8mo | $250,000 | $215 | 50 |
| 426 Bonnett St | 0.66mi | 3/1.0 | 1,168 (-5%) | 14mo | $238,000 | $204 | 50 |
| 61 Baker St | 0.60mi | 4/2.0 (+1) | 1,304 (+6%) | 9mo | $325,000 | $249 | 45 |
| 45 Mount Royal Ave | 0.66mi | 2/1.0 (-1) | 1,080 (-12%) | 1mo | $236,000 | $219 | 44 |
| 435 Edmund St | 0.74mi | 4/1.5 (+1) | 1,284 (+5%) | 14mo | $121,900 | $95 | 38 |
| 327 Roberts Way | 0.59mi | 3/2.0 | 1,361 (+11%) | 16mo | $364,500 | $268 | 37 |
Match score weights: distance 35% · size 25% · config 20% · recency 20%. Top-matched comps best support the ARV.
Projected returns pro-forma
-3.0% appreciation · 0.28% rent growth · sell at horizon
- IRR
- -20.2%
- Equity multiple
- 0.31×
- Total profit
- $-48,187
- Equity at exit
- $37,261
- IRR
- -19.7%
- Equity multiple
- 0.07×
- Total profit
- $-65,190
- Equity at exit
- $21,607
Cash invested: $69,972 (down + closing). Projections, not guarantees.
Landlord ↔ Tenant lean methodology
- Overall (STATE)
- 27 Tenant-Leaning
- State Maryland
- 27 Tenant-Leaning · D+14
- County
- — inherits STATE
- City
- — inherits STATE
ZIP-level market 21001
- Home prices YoY
- -30.5%
- Rents YoY
- 0.3%
- Active inventory
- 186
- Price-to-rent
- 11.0×
Monthly cashflow live
- Estimated rent
- $1,888 high interval (Pro) →
- Mortgage (P&I)
- −$1,311
- Tax from tax record
- −$117 /mo · $1,407/yr
- Insurance
- −$104
- HOA
- −$0
- Vacancy / Maint / Mgmt
- −$396
- Net cashflow
- $-40
Break-even live
UW: 25.0% down · 7.5% · 30yr · 1.5% tax · 5.0% vac · 8.0% maint · 8.0% mgmt
Financing live
Cash to close
- Down payment
- $62,475
- Closing costs
- $7,497
- Reserves months
- —
- Total cash needed
- —
Loan-product check · same deal, 3 products live
Conventional
25% down · 7.5% · 30yr
- Down + closing
- —
- Monthly P&I
- —
- Monthly cashflow
- —
- DSCR
- —
- Eligible?
- —
Personal DTI + credit; lowest rate.
DSCR
20% down · 8.5% · 30yr
- Down + closing
- —
- Monthly P&I
- —
- Monthly cashflow
- —
- DSCR
- —
- Eligible?
- —
No personal income docs; deal must DSCR.
Hard money
10% down · 12.0% · 12mo
- Down + closing
- —
- Monthly P&I
- —
- Monthly cashflow
- —
- DSCR
- —
- Eligible?
- —
Short-term bridge; refi at stabilization.
Rent comps 16 comps
| Address | Beds | Baths | Sqft | Rent | $/sqft | DOM | Units | Dist |
|---|---|---|---|---|---|---|---|---|
| 15 Grant St Aberdeen, MD | 2.0 | 1.0 | 850 | $1,435 | $1.69 | 43d | 1 | 0.29mi |
| 514 W Bel Air Ave Unit 2 Aberdeen, MD | 2.0 | 1.0 | 750 | $1,295 | $1.73 | 17d | 1 | 0.33mi |
| 980 Middelton Rd Aberdeen, MD | 1.0–3.0 | 1.0–2.0 | 1017 | $2,435 | $2.39 | 1d | 12 | 0.34mi |
| 731 W Bel Air Ave Aberdeen, MD | 1.0–2.0 | 1.0–2.0 | 950 | $1,495 | $1.57 | 1d | 1 | 0.37mi |
| 417 Oak St Aberdeen, MD | 3.0 | 1.0 | 1268 | $1,500 | $1.18 | 43d | 1 | 0.43mi |
| 470 Washington St Aberdeen, MD | 3.0 | 1.5 | 1445 | $2,200 | $1.52 | 4d | 1 | 0.61mi |
| 686 Holly Cir Aberdeen, MD | 2.0–3.0 | 1.0 | 1150 | $1,600 | $1.39 | 1d | 1 | 0.67mi |
| 114 S Parke St Apt A Aberdeen, MD | 2.0 | 1.5 | 825 | $1,400 | $1.70 | 43d | 1 | 0.84mi |
| 300 Stevens Cir Aberdeen, MD | 2.0–3.0 | 1.0 | 1150 | $1,999 | $1.74 | 1d | 6 | 0.85mi |
| 104 S Parke St Aberdeen, MD | 3.0 | 1.5 | 900 | $1,700 | $1.89 | 23d | 1 | 0.85mi |
| 309 S Parke St Aberdeen, MD | 1.0–2.0 | 1.0 | 850 | $1,695 | $1.99 | 1d | 1 | 0.93mi |
| 27 E Bel Air Ave Apt 2 Aberdeen, MD | 3.0 | 1.0 | 944 | $1,550 | $1.64 | 43d | 1 | 1.07mi |
| 27 E Bel Air Ave Unit 1 Aberdeen, MD | 3.0 | 1.0 | 923 | $1,750 | $1.90 | 43d | 1 | 1.07mi |
| 742 Nottingham Dr Aberdeen, MD | 3.0 | 1.0 | 1084 | $2,200 | $2.03 | 4d | 1 | 1.07mi |
| 901 Camden Way Aberdeen, MD | 1.0–3.0 | 1.0–2.5 | 1210 | $2,991 | $2.47 | 1d | 53 | 1.27mi |
| 70 Swan St Aberdeen, MD | 3.0 | 2.0 | 924 | $1,715 | $1.86 | 4d | 1 | 1.35mi |
Listing history 4 events
-
2026-06-02statusdays on market $249,900 Pending 12 DOM
-
2026-06-01days on market $249,900 Active 11 DOM
-
2026-05-31days on market $249,900 Active 10 DOM
-
2026-05-15historical $249,900 634-char remark
ⓘ Source: listings_history table (triggers on properties + properties_extension) + one-shot
backfill from property_details.listing_events for pre-trigger history.
Tax reassessment forecast MD · Partial reset (capped growth)
- Current annual tax
- $1,407 · $117/mo
- Projected year-2 tax
- $2,066 · $172/mo
- Expected delta
- +$658/yr (+$55/mo · 46.8%)
ⓘ Screening estimate from a state-policy table — verify with the county assessor before closing.
Climate risk First Street
- Flood 1/10 Low FEMA zone X (unshaded) · 0% chance over 30 yrs
- Wildfire 2/10 Low
- Heat 7/10 Severe 7 d/yr ≥104°F today · 15 d/yr by 30 yrs out
- Wind 6/10 Major 27% chance of damaging wind over 30 yrs
- Air quality 3/10 Moderate 2 unhealthy d/yr today · 3 by 30 yrs out
Nearby sold comps map
Loading sold comps map…
Walkable amenities ~0.75 mi
Loading nearby amenities…
Taxation est. · year 1
- Rental income
- $22,656
- − Mortgage interest
- −$13,998
- − Property taxes
- −$1,407
- − Insurance
- −$1,250
- − Repairs & maintenance
- −$1,813
- − Management
- −$1,813
- − Depreciation
- −$7,270
- Taxable loss
- −$4,894
- Est. tax savings @ 24.0%
- +$1,174
- After-tax cash flow
- $690/yr
For passive investors: Depreciation is non-cash, so a rental often shows a tax loss while cash-flowing — sheltering income. Rental losses are passive: they offset passive income freely, and up to $25,000/yr can offset ordinary (W-2) income if you actively participate and your MAGI is under $100k (phasing out to $0 by $150k); unused losses carry forward. On sale, claimed depreciation is recaptured at up to 25%, and gains may owe capital-gains tax (a 1031 exchange can defer both). Figures are a year-1 estimate at your 24.0% rate — not tax advice; consult a CPA.
Schools (NCES district)
- District
- Harford County Public Schools
- NCES district ID
- 2400390
- Math proficiency
- 22% ▼ -23.00%
- Reading proficiency
- 39% ▼ -12.00%
- Median HH income
- $79,569
- Composite
- 29.38/100
- National rank
- #6527
- State rank
- #9 of 24 in MD
Livability — Aberdeen
- Score
- 81/100
- State rank
- #42
- US rank
- #1545
Category grades
Schools grade is shown separately in the Schools card above.
Census & demographics
- Census place
- Aberdeen, MD
- County
- Harford County · 198,512 people
- City population
- 27,168
- Metro
- Baltimore-Columbia-Towson, MD
- Population (ZIP)
- 27,168
- Household income
- $83,238
- Rent vs Own
- Severe rent burden
- 736.0
Population outlook (Harford County) Hauer SSP2
- Today (2025)
- 262,292 people
- By 2030
- 266,437 · +1.6%
- By 2040
- 269,954 · +2.9%
- By 2050
- 265,659 · +1.3%
- By 2075
- 252,886 · -3.6%
- By 2100
- 224,014 · -14.6%
Race, ethnicity, and origin ACS 2023
- Neighborhood character
- Diverse neighborhood (Simpson 0.62)
- Race & ethnicity
- White 54% Black 28% Hispanic / Latino 9% Two or more races 9% Asian 3%
- Hispanic origin (detail)
- Mexican 3% Puerto Rican 2% Dominican 1%
- Common ancestry
- Romanian 3% Slovak 1% Scotch-Irish 1%
- Foreign-born
- 8% · Canada, China, South Korea
- Languages at home
- 89% English-only · Spanish 4% Other Indo-European 1% German/W. Germanic 1%
Political lean MEDSL · Harford
- 2024 margin
- R (+13.8) · D 41.9% · R 55.7% · Other 2.4%
- 2008→2024 swing
- +5.0pp toward D · 2008: -18.8pp · 2024: -13.8pp
- All cycles
- 2024: R+13.8 2020: R+12.0 2016: R+24.5 2012: R+19.5 2008: R+18.8
Not yet ingested
- Civics
- —
Market trends
- HPI YoY
- ▼ -108.65%
- Current HPI
- 247.668
- Rent YoY
- ▲ 0.28%
- Metro
- Baltimore-Columbia-Towson, MD
- State GDP YoY
- ▲ 2.97%
- F500 in state
- 12
Industry mix (Fortune 500 HQ in MD)
| Industry | F500 HQs | Revenue |
|---|---|---|
| Aerospace / Defense | 1 | $71B |
|
||
| Utilities | 1 | $25B |
|
||
| Hotels | 1 | $24B |
|
||
| Consumer Goods | 1 | $7B |
|
||
| Real Estate | 1 | $6B |
|
||
| Chemicals | 1 | $2B |
|
||
Price history
+0.0% since first listed3 events — show timeline
- 2026-06-02 Pending — BRIGHT MLS
- 2026-05-22 Listed $249,900 BRIGHT MLS
- 2026-05-15 Coming Soon $249,900 BRIGHT MLS
Property tax history
-3.9%/yrLatest (2019): $1,407 · +2.3% YoY. Source: county tax records.
Cash-flow waterfall
monthlySold comps — $/sqft
last 12 mo · ≤1 miLoading sold comps…