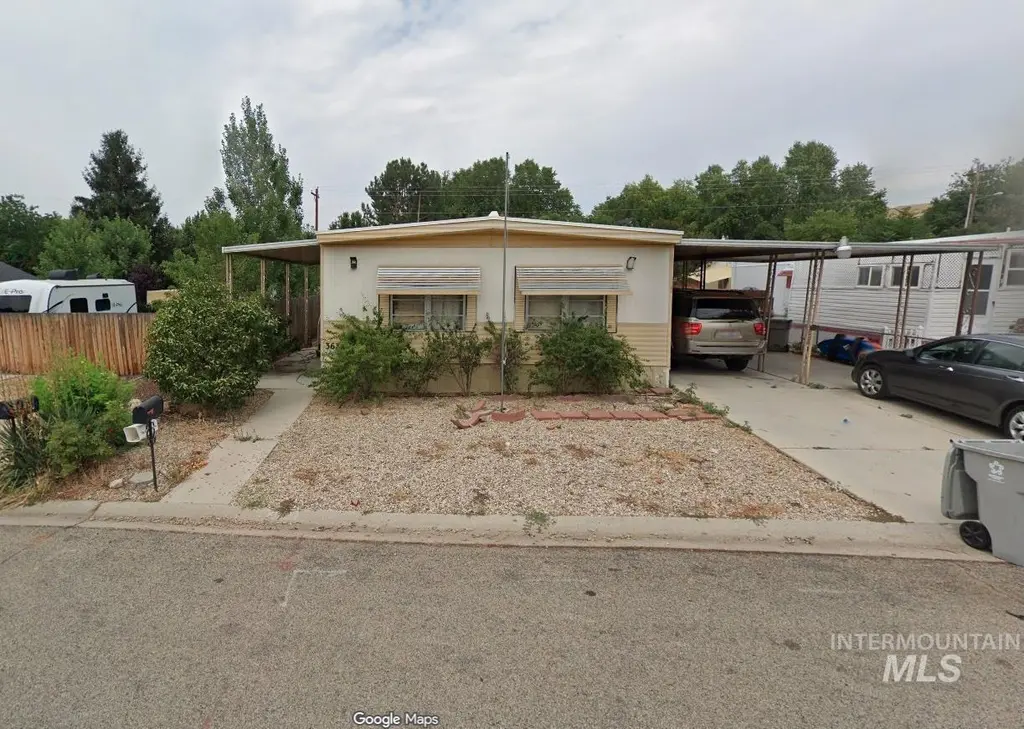
3637 S Kingsland · Boise City, ID
Flood risk 1/10 · Minimal
- FEMA flood zone
- X (unshaded)
- Chance of flooding over 30 yrs
- 0.0%
- Est. flood insurance / yr
- $507 – $1,088
Fire risk 10/10 · Severe
- Est. fire insurance / yr
- $584 – $1,086
Heat risk 4/10 · Minor
- Hot days now (above 95°F)
- 7 days/yr
- Hot days in 30 yrs
- 18 days/yr
Wind risk 1/10 · Minimal
- Chance of severe wind over 30 yrs
- —
Air-quality risk 8/10 · Major
- Unhealthy air days now
- 15 days/yr
- Unhealthy air days in 30 yrs
- 18 days/yr
Risk factors via First Street. Map © Google.
Why this score? — see what drove the B- grade
The composite is a weighted blend of 9 inputs, each scored 0–100. Each bar is that input's sub-score; the figure is the points it added to the 100-point composite (weight × sub-score).
- Cash flow +26.5/30.0
- ARV discount +15.0/15.0
- DSCR +9.0/10.0
- 1% rule +6.0/10.0
- Schools +4.2/10.0
- Rent growth +3.7/5.0
- Livability +2.5/5.0
- Condition / age +2.5/5.0
- Appreciation +0.0/10.0
$169,900
🖨 Deal sheet 📄 Offer letter ✓ Due diligence
Listing remarks
Tucked into the highly sought-after Barber Valley/Harris Ranch area, this property offers an exceptional opportunity to invest in one of Boise’s most desirable locations. Just minutes from the Greenbelt, Warm Springs Avenue, outdoor recreation, and East Boise amenities, the value here is truly in the location and the land. Situated on its own lot, this 2-bedroom, 2-bath mobile home is not on a permanent foundation and will require extensive renovation or replacement, making it ideal for investors, flippers, builders, or cash buyers with vision. The property also includes a storage shed, perfect for tools, equipment, or workspace during improvements. Whether you’re looking to ren
Key facts
- 5,706 sq ft lot
- Parking
- Built 1972
Property features AI
Finance
- Financial info: Homeowner tax exemption reported
- HOA & community: Located in the Golden Dawn Mob subdivision
Exterior
- Parking: Carport (1 covered space)
- Utilities: City water service
- Home design: Manufactured home placed on land; Built in 1972
- Construction: Metal siding
- Exterior features: Small lot (approx. 5,999 SF); Paved road access
Interior
- Bedrooms: 2 bedrooms on the main level
- Bathrooms: 2 bathrooms
- Heating & cooling: No built-in heating; No built-in cooling
- Interior features: Main-level living
Neighborhood map
What this means for you Summary
Snapshot
- This is a 2-bed/2.0-bath manufactured listed at $170k.
Deal economics
- At list price, monthly cash flow is $447 ($5k/yr) — positive.
- The deal already cash-flows at list — no discount required.
- Meets the 1% rule at list price ($2k rent vs $170k).
- Cap rate 9.5% vs local median 2.6% in Boise City — top-decile yield for the area; either an underpriced asset or a hidden risk that comps aren't pricing in. Stress-test before assuming the spread holds.
Location & tenants
- Location reads: area grade B — affects rentability + tenant quality, not the cash-flow math above.
- Boise Independent District (urban): math 42% / reading 56% proficiency, ranked #36 of 92 in ID (top 39%) — families likely to look elsewhere, expect single-tenant / working-renter base with shorter leases.
- Zoned schools: Riverside Elementary School (math 63% / reading 66%, grade B, #43 of 357 statewide, top 13%, 616 students, 6% FRL); Timberline High School (math 53% / reading 74%, grade B-, #14 of 169 statewide, top 8%, 1,398 students, 10% FRL) — zoned schools average 8% FRL vs 33% district-wide (26 pts lower); this property's tenant base skews higher-income than the district average.
- Zoned-school proficiency averages 64% at this address vs 49% district-wide (+15 pts) — the actual schools serving this property are materially stronger than the Boise Independent District average implies; a family-tenant draw the district grade alone would hide.
- Market conditions: Rents rising fast (+4.8%/yr); 328 active listings in the ZIP; 5 comparable units currently listed for rent nearby; rentals at typical pace (median 15d on market — plan ~3-4 weeks tenant-placement turnaround); high-income renter base; 5,129 units permitted in Ada County in 2024 (414 in 5+ unit buildings).
- This rent is only 17% of the median local income ($129k/yr) — well below the 30% rent-burden line; pricing power to push rent on renewal without tenant pushback.
Forward outlook
- Local home prices are declining (-3.0%/yr); year-one equity from $1k of loan paydown is wiped out by about $5k of value loss. Plan a longer hold.
- Ada County population projected at +45% by 2050 — long-run rental-demand tailwind backs the buy-and-hold thesis.
- At projected returns (-3.0% appreciation + 4.8% rent growth), your $48k cash investment doubles in ~9 years — after that, you're playing with house money.
Negotiation context
- Only 1 days on market — expect competitive offers; lowballing is unlikely to land.
Risks & watch-outs
- Climate carrying-cost: severe wildfire risk — expect insurance premiums to compound above CPI over the hold.
Questions for the listing agent
- Built in 1972 — when were the roof, HVAC, electrical panel, plumbing, and water heater last replaced?
- Is there a deadline driving the sale (1031 exchange, divorce, estate, relocation)? That informs how much negotiation room exists.
- What's the average days-on-market for RENTAL listings here right now (not sales)? A rising rental-DOM trend means longer vacancies and softer asking-rent achievability than the comps imply.
- What's the recent tenant-quality profile in this submarket — average credit score on applications, eviction rate, late-payment / NSF rate, and stable-employment percentage? A property-management company in the area should have these aggregated.
- How much new for-sale + rental construction is in the pipeline within 1–3 miles? Heavy new supply typically softens prices + rents 12–24 months out; constrained supply supports both.
Investment metrics
- 1% rule
- 1.10% ✓
- Cap rate
- 9.45%
- Cash-on-cash
- 11.28%
- DSCR
- 1.50
- GRM
- 7.6
CMA / ARV
- ARV (on-the-fly)
- $204,120
- Comps found
- 7
Show comp detail 7 sales within ~0.75 mi
| Address | Dist | Beds/Ba | Sqft | Sold | Price | $/sf | Match |
|---|---|---|---|---|---|---|---|
| 3678 S Durham Way | 0.12mi | 2/2.0 | 846 (+1%) | 14mo | $210,000 | $248 | 81 |
| 3703 S Clacton Way | 0.14mi | 2/2.0 | 924 (+10%) | 3mo | $224,900 | $243 | 74 |
| 3548 S Kingsland Way | 0.10mi | 2/1.0 | 880 (+5%) | 18mo | $190,000 | $216 | 68 |
| 3655 S Clacton Way | 0.15mi | 3/1.5 (+1) | 924 (+10%) | 2mo | $225,000 | $244 | 68 |
| 3620 S Durham Way | 0.08mi | 2/2.0 | 900 (+7%) | 21mo | $299,900 | $333 | 67 |
| 3535 S Kingsland Way | 0.14mi | 2/1.0 | 938 (+12%) | 7mo | $185,000 | $197 | 64 |
| 3523 3523 S Kingsland Way | 0.16mi | 2/1.0 | 924 (+10%) | 11mo | $208,000 | $225 | 62 |
Match score weights: distance 35% · size 25% · config 20% · recency 20%. Top-matched comps best support the ARV.
Projected returns pro-forma
-3.0% appreciation · 4.78% rent growth · sell at horizon
- IRR
- 2.3%
- Equity multiple
- 1.09×
- Total profit
- $4,298
- Equity at exit
- $25,333
- IRR
- 13.4%
- Equity multiple
- 2.15×
- Total profit
- $54,659
- Equity at exit
- $14,690
Cash invested: $47,572 (down + closing). Projections, not guarantees.
Landlord ↔ Tenant lean methodology
- Overall (STATE)
- 91 Strongly Landlord-Friendly
- State Idaho
- 91 Strongly Landlord-Friendly · R+18
- County
- — inherits STATE
- City
- — inherits STATE
ZIP-level market 83716
- Home prices YoY
- -22.8%
- Rents YoY
- 4.8%
- Active inventory
- 328
- Price-to-rent
- 7.6×
Monthly cashflow live
- Estimated rent
- $1,868 high interval (Pro) →
- Mortgage (P&I)
- −$891
- Tax from tax record
- −$66 /mo · $796/yr
- Insurance
- −$71
- HOA
- −$0
- Vacancy / Maint / Mgmt
- −$392
- Net cashflow
- $447
Break-even live
UW: 25.0% down · 7.5% · 30yr · 1.5% tax · 5.0% vac · 8.0% maint · 8.0% mgmt
Financing live
Cash to close
- Down payment
- $42,475
- Closing costs
- $5,097
- Reserves months
- —
- Total cash needed
- —
Loan-product check · same deal, 3 products live
Conventional
25% down · 7.5% · 30yr
- Down + closing
- —
- Monthly P&I
- —
- Monthly cashflow
- —
- DSCR
- —
- Eligible?
- —
Personal DTI + credit; lowest rate.
DSCR
20% down · 8.5% · 30yr
- Down + closing
- —
- Monthly P&I
- —
- Monthly cashflow
- —
- DSCR
- —
- Eligible?
- —
No personal income docs; deal must DSCR.
Hard money
10% down · 12.0% · 12mo
- Down + closing
- —
- Monthly P&I
- —
- Monthly cashflow
- —
- DSCR
- —
- Eligible?
- —
Short-term bridge; refi at stabilization.
Rent comps 5 comps
| Address | Beds | Baths | Sqft | Rent | $/sqft | DOM | Units | Dist |
|---|---|---|---|---|---|---|---|---|
| 3670 S Clacton Way Boise, ID | 2.0 | 2.0 | 800 | $1,500 | $1.88 | 14d | 1 | 0.18mi |
| 3724 S Eckert Rd Boise, ID | 1.0 | 1.0 | 823 | $1,650 | $2.00 | 3d | 1 | 0.23mi |
| 4430 E Haystack St Boise, ID | 2.0 | 2.0 | 1032 | $2,400 | $2.33 | 14d | 1 | 0.61mi |
| 4184 E Haystack St #109 Boise, ID | 1.0 | 1.0 | 699 | $1,800 | $2.58 | 14d | 1 | 0.77mi |
| 3850 E Haystack St #307 Boise, ID | 1.0 | 1.0 | 710 | $1,995 | $2.81 | 14d | 1 | 1.01mi |
Listing history 2 events
-
2026-05-05status Pending
-
2026-05-05$169,900 Active
ⓘ Source: listings_history table (triggers on properties + properties_extension) + one-shot
backfill from property_details.listing_events for pre-trigger history.
Tax reassessment forecast ID · Resets to sale price
- Current annual tax
- $796 · $66/mo
- Projected year-2 tax
- $1,172 · $98/mo
- Expected delta
- +$376/yr (+$31/mo · 47.2%)
ⓘ Screening estimate from a state-policy table — verify with the county assessor before closing.
Climate risk First Street
- Flood 1/10 Low FEMA zone X (unshaded) · 0% chance over 30 yrs
- Wildfire 10/10 Extreme
- Heat 4/10 Moderate 7 d/yr ≥95°F today · 18 d/yr by 30 yrs out
- Wind 1/10 Low
- Air quality 8/10 Severe 15 unhealthy d/yr today · 18 by 30 yrs out
Nearby sold comps map
Loading sold comps map…
Walkable amenities ~0.75 mi
Loading nearby amenities…
Taxation est. · year 1
- Rental income
- $22,411
- − Mortgage interest
- −$9,517
- − Property taxes
- −$796
- − Insurance
- −$850
- − Repairs & maintenance
- −$1,793
- − Management
- −$1,793
- − Depreciation
- −$4,943
- Taxable income
- $2,720
- Est. tax owed @ 24.0%
- −$653
- After-tax cash flow
- $4,714/yr
For passive investors: Depreciation is non-cash, so a rental often shows a tax loss while cash-flowing — sheltering income. Rental losses are passive: they offset passive income freely, and up to $25,000/yr can offset ordinary (W-2) income if you actively participate and your MAGI is under $100k (phasing out to $0 by $150k); unused losses carry forward. On sale, claimed depreciation is recaptured at up to 25%, and gains may owe capital-gains tax (a 1031 exchange can defer both). Figures are a year-1 estimate at your 24.0% rate — not tax advice; consult a CPA.
Schools (NCES district)
- District
- Boise Independent District
- NCES district ID
- 1600360
- Math proficiency
- 42% ▼ -5.00%
- Reading proficiency
- 56% ▼ -1.00%
- Median HH income
- $49,135
- Composite
- 41.82/100
- National rank
- #3388
- State rank
- #36 of 92 in ID
Livability — Boise City
No livability data for this city. (Only ~50 U.S. cities are tracked.)
Census & demographics
- Census place
- Boise City, ID
- County
- Ada County · 522,161 people
- City population
- 152,689
- Metro
- Boise City, ID
- Population (ZIP)
- 21,402
- Household income
- $128,822
- Rent vs Own
- Severe rent burden
- 408.0
Population outlook (Ada County) Hauer SSP2
- Today (2025)
- 535,818 people
- By 2030
- 585,751 · +9.3%
- By 2040
- 682,435 · +27.4%
- By 2050
- 775,818 · +44.8%
- By 2075
- 994,458 · +85.6%
- By 2100
- 1,148,884 · +114.4%
Race, ethnicity, and origin ACS 2023
- Neighborhood character
- Predominantly White (77%)
- Race & ethnicity
- White 77% Asian 9% Two or more races 7% Hispanic / Latino 6%
- Hispanic origin (detail)
- Mexican 3%
- Common ancestry
- Italian 6% Portuguese 2% Slovak 2%
- Foreign-born
- 11% · Canada, China, South Korea
- Languages at home
- 87% English-only · Spanish 4% Chinese 2% Other Asian/Pacific 2%
Political lean MEDSL · Ada
- 2024 margin
- R (+10.3) · D 43.4% · R 53.8% · Other 2.8%
- 2008→2024 swing
- -4.2pp toward R · 2008: -6.2pp · 2024: -10.3pp
- All cycles
- 2024: R+10.3 2020: R+3.9 2016: R+9.2 2012: R+11.3 2008: R+6.2
Not yet ingested
- Civics
- —
Market trends
- HPI YoY
- ▼ -97.80%
- Current HPI
- 332.0696
- Rent YoY
- ▲ 4.78%
- Metro
- Boise City, ID
- State GDP YoY
- ▲ 4.51%
- F500 in state
- 6
Industry mix (Fortune 500 HQ in ID)
| Industry | F500 HQs | Revenue |
|---|---|---|
| Retail | 1 | $79B |
|
||
| Technology | 1 | $25B |
|
||
| Food / Agriculture | 1 | $6B |
|
||
Price history
2 events — show timeline
- 2026-05-05 Pending — IMLS
- 2026-05-05 Listed $169,900 IMLS
Property tax history
+5.6%/yrLatest (2025): $796 · +4.9% YoY. Source: county tax records.
Cash-flow waterfall
monthlySold comps — $/sqft
last 12 mo · ≤1 miLoading sold comps…