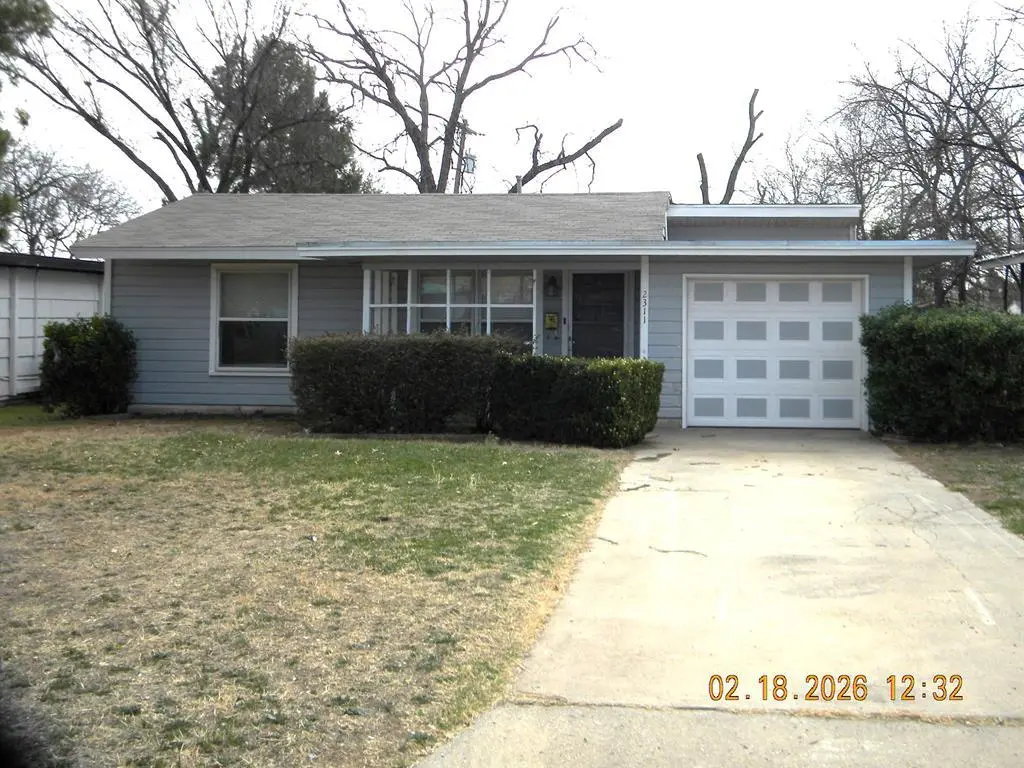
2311 W Harris Ave · San Angelo, TX
Flood risk 1/10 · Minimal
- FEMA flood zone
- X (unshaded)
- Chance of flooding over 30 yrs
- 0.0%
- Est. flood insurance / yr
- $507 – $1,088
Fire risk 3/10 · Minor
- Est. fire insurance / yr
- $1,222 – $2,270
Heat risk 7/10 · Major
- Hot days now (above 104°F)
- 7 days/yr
- Hot days in 30 yrs
- 23 days/yr
Wind risk 4/10 · Minor
- Chance of severe wind over 30 yrs
- 12.0%
Air-quality risk 1/10 · Minimal
- Unhealthy air days now
- 0 days/yr
- Unhealthy air days in 30 yrs
- 0 days/yr
Risk factors via First Street. Map © Google.
Why this score? — see what drove the B grade
The composite is a weighted blend of 9 inputs, each scored 0–100. Each bar is that input's sub-score; the figure is the points it added to the 100-point composite (weight × sub-score).
- Cash flow +21.7/30.0
- ARV discount +15.0/15.0
- Appreciation +10.0/10.0
- DSCR +6.9/10.0
- 1% rule +6.3/10.0
- Rent growth +3.9/5.0
- Livability +3.7/5.0
- Schools +2.6/10.0
- Condition / age +2.5/5.0
$145,000
🖨 Deal sheet 📄 Offer letter ✓ Due diligence
Listing remarks MLS
Motivated seller. Price reduced $5000. Very unique property. The home features 2 bedrooms and 2 baths with an attached 1 Bedroom, 1 Bath Efficiency apartment. Would be a great home for college students or Mother-in-law room. The 2 car carport and 1 car garage is a plus. Centrally located and a short distance to Angelo State University.
Key facts
- Efficiency apartment
- Centrally located
- 7,492 sq ft lot
Tags
Neighborhood map
What this means for you Summary
Snapshot
- This is a 3-bed/3.0-bath single-family listed at $145k.
Deal economics
- At list price, monthly cash flow is $222 ($3k/yr) — positive.
- The deal already cash-flows at list — no discount required.
- Meets the 1% rule at list price ($2k rent vs $145k).
- Recommended offer: $132k (9.0% below list) — sets the bar for market timing.
- Cap rate 8.1% vs local median 3.8% in San Angelo — top-decile yield for the area; either an underpriced asset or a hidden risk that comps aren't pricing in. Stress-test before assuming the spread holds.
Location & tenants
- Location reads 73/100 on livability (#199 in TX) — a middle-class / working-renter tenant base. Strengths: cost of living A+, housing A+, health & safety A+; Watch: employment C-, schools F, amenities F.
- San Angelo ISD (urban): math 27% / reading 33% proficiency, ranked #627 of 826 in TX (top 76%) — families likely to look elsewhere, expect single-tenant / working-renter base with shorter leases.
- Market conditions: Rents rising fast (+5.8%/yr); 331 active listings in the ZIP; 16 comparable units currently listed for rent nearby; rentals lingering (median 44d on market — plan ~5-8 weeks vacancy on turnover, expect pricing pressure); 62% of comp listings sitting > 30 days — soft ceiling on asking rent; 233 units permitted in Tom Green County in 2024 (0 in 5+ unit buildings).
Forward outlook
- In year one you build about $16k of equity ($1k loan paydown + $14k appreciation (10.0% local appreciation)).
- Tom Green County population projected at +35% by 2050 — long-run rental-demand tailwind backs the buy-and-hold thesis.
- At projected returns (10.0% appreciation + 5.8% rent growth), your $41k cash investment doubles in ~3 years — after that, you're playing with house money.
- By year 3, paydown + projected appreciation supports a ~$39k cash-out refi (75% LTV) — recoverable capital for the next deal without selling this one.
Negotiation context
- It's been on market 112 days — a 9% lower offer ($132k) is reasonable based on typical stale-listing flexibility.
Risks & watch-outs
- Watch-outs: built in 1950 — expect roof / HVAC / electrical / plumbing capex.
- Climate carrying-cost: extreme-heat days projected 7→23/yr by 2055 (HVAC capex compounding) — expect insurance premiums to compound above CPI over the hold.
Questions for the listing agent
- It's been on market 112 days. Have you received any prior offers? Is the seller open to a 9% concession, seller financing, or rate buy-down credit?
- Built in 1950 — when were the roof, HVAC, electrical panel, plumbing, and water heater last replaced?
- Why hasn't it sold? Are there any deal-killer items the seller is aware of (foundation, flood, title, zoning, code violations)?
- Is there a deadline driving the sale (1031 exchange, divorce, estate, relocation)? That informs how much negotiation room exists.
- Schools are F-rated, which usually means shorter tenancies and higher turnover. Who's the typical renter profile here, and what's been the actual vacancy rate?
- What's the average days-on-market for RENTAL listings here right now (not sales)? A rising rental-DOM trend means longer vacancies and softer asking-rent achievability than the comps imply.
- What's the recent tenant-quality profile in this submarket — average credit score on applications, eviction rate, late-payment / NSF rate, and stable-employment percentage? A property-management company in the area should have these aggregated.
- How much new for-sale + rental construction is in the pipeline within 1–3 miles? Heavy new supply typically softens prices + rents 12–24 months out; constrained supply supports both.
Investment metrics
- 1% rule
- 1.13% ✓
- Cap rate
- 8.13%
- Cash-on-cash
- 6.57%
- DSCR
- 1.29
- GRM
- 7.4
CMA / ARV
- ARV (median comp)
- $176,241
- List price
- $145,000
- Delta
- -17.73%
- Verdict
- UNDERPRICED
- Comps
- 20 within 1.0 mi
Show comp detail 12 sales within ~0.75 mi
| Address | Dist | Beds/Ba | Sqft | Sold | Price | $/sf | Match |
|---|---|---|---|---|---|---|---|
| 1902 W Twohig Ave | 0.40mi | 3/4.0 | 1,688 (-4%) | 3mo | $237,500 | $141 | 68 |
| 2821 W Twohig Ave | 0.54mi | 3/2.0 | 1,768 (+0%) | 4mo | $199,900 | $113 | 67 |
| 2813 W Avenue Ave N | 0.63mi | 3/2.0 | 1,800 (+2%) | 0mo | $249,900 | $139 | 63 |
| 2833 W Beauregard Ave | 0.52mi | 3/2.0 | 1,877 (+6%) | 0mo | $210,000 | $112 | 61 |
| 2701 San Antonio St | 0.41mi | 4/2.0 (+1) | 1,676 (-5%) | 4mo | $225,000 | $134 | 60 |
| 409 N Pierce St | 0.36mi | 3/2.0 | 1,950 (+10%) | 2mo | $225,000 | $115 | 60 |
| 1908 Rebecca Dr | 0.70mi | 3/2.0 | 1,743 (-1%) | 3mo | $284,900 | $163 | 59 |
| 2704 W Beauregard Ave | 0.38mi | 4/4.0 (+1) | 1,546 (-12%) | 2mo | $219,900 | $142 | 51 |
| 2012 Jade Dr | 0.74mi | 4/2.0 (+1) | 1,841 (+4%) | 2mo | $332,500 | $181 | 48 |
| 1858 W Twohig Ave | 0.44mi | 4/4.0 (+1) | 2,000 (+13%) | 2mo | $179,900 | $90 | 47 |
| 1901 Walnut St | 0.72mi | 3/4.0 | 1,614 (-9%) | 4mo | $229,500 | $142 | 45 |
| 404 S Monroe St | 0.70mi | 2/1.0 (-1) | 1,520 (-14%) | 5mo | $304,999 | $201 | 27 |
Match score weights: distance 35% · size 25% · config 20% · recency 20%. Top-matched comps best support the ARV.
Projected returns pro-forma
10.0% appreciation · 5.78% rent growth · sell at horizon
- IRR
- 30.3%
- Equity multiple
- 3.41×
- Total profit
- $97,925
- Equity at exit
- $130,627
- IRR
- 27.2%
- Equity multiple
- 8.10×
- Total profit
- $288,097
- Equity at exit
- $281,703
Cash invested: $40,600 (down + closing). Projections, not guarantees.
Landlord ↔ Tenant lean methodology
- Overall (STATE)
- 87 Strongly Landlord-Friendly
- State Texas
- 87 Strongly Landlord-Friendly · R+5
- County
- — inherits STATE
- City
- — inherits STATE
ZIP-level market 76901
- Home prices YoY
- 6.4%
- Rents YoY
- 5.8%
- Active inventory
- 331
- Price-to-rent
- 7.4×
Monthly cashflow live
- Estimated rent
- $1,643 high interval (Pro) →
- Mortgage (P&I)
- −$760
- Tax from tax record
- −$255 /mo · $3,054/yr
- Insurance
- −$60
- HOA
- −$0
- Vacancy / Maint / Mgmt
- −$345
- Net cashflow
- $222
Break-even live
UW: 25.0% down · 7.5% · 30yr · 1.5% tax · 5.0% vac · 8.0% maint · 8.0% mgmt
Financing live
Cash to close
- Down payment
- $36,250
- Closing costs
- $4,350
- Reserves months
- —
- Total cash needed
- —
Loan-product check · same deal, 3 products live
Conventional
25% down · 7.5% · 30yr
- Down + closing
- —
- Monthly P&I
- —
- Monthly cashflow
- —
- DSCR
- —
- Eligible?
- —
Personal DTI + credit; lowest rate.
DSCR
20% down · 8.5% · 30yr
- Down + closing
- —
- Monthly P&I
- —
- Monthly cashflow
- —
- DSCR
- —
- Eligible?
- —
No personal income docs; deal must DSCR.
Hard money
10% down · 12.0% · 12mo
- Down + closing
- —
- Monthly P&I
- —
- Monthly cashflow
- —
- DSCR
- —
- Eligible?
- —
Short-term bridge; refi at stabilization.
Rent comps 16 comps
| Address | Beds | Baths | Sqft | Rent | $/sqft | DOM | Units | Dist |
|---|---|---|---|---|---|---|---|---|
| 2505 W Harris Ave San Angelo, TX | 2.0 | 2.0 | 1582 | $1,300 | $0.82 | 43d | 1 | 0.11mi |
| 2425 Waco St San Angelo, TX | 4.0 | 1.0 | 1225 | $1,395 | $1.14 | 43d | 1 | 0.58mi |
| 1835 Willow St San Angelo, TX | 3.0 | 1.0 | 1267 | $1,750 | $1.38 | 43d | 1 | 0.63mi |
| 2013 Rosemont Dr San Angelo, TX | 3.0 | 2.0 | 1400 | $2,100 | $1.50 | 21d | 1 | 0.79mi |
| 2804 Abilene St San Angelo, TX | 3.0 | 2.0 | 1304 | $1,550 | $1.19 | 43d | 1 | 0.81mi |
| 210 N Jefferson St #210 San Angelo, TX | 3.0 | 3.0 | 1706 | $1,600 | $0.94 | 21d | 1 | 0.82mi |
| 711 N Monroe St San Angelo, TX | 3.0 | 1.0 | 1345 | $1,500 | $1.12 | 43d | 1 | 0.82mi |
| 417 N Jefferson St San Angelo, TX | 4.0 | 2.0 | 1940 | $2,350 | $1.21 | 21d | 1 | 0.83mi |
| 3344 Trinity Ave San Angelo, TX | 3.0 | 2.0 | 1545 | $1,900 | $1.23 | 21d | 1 | 0.85mi |
| 2102 Webster St San Angelo, TX | 3.0 | 1.0 | 1233 | $1,750 | $1.42 | 43d | 1 | 0.88mi |
| 2629 Forest Park Ave San Angelo, TX | 3.0 | 2.0 | 1336 | $1,895 | $1.42 | 43d | 1 | 0.93mi |
| 2756 Sac Ave San Angelo, TX | 3.0 | 1.0 | 1461 | $1,650 | $1.13 | 43d | 1 | 0.95mi |
| 3207 Trinity Ave San Angelo, TX | 3.0 | 2.0 | 1536 | $1,995 | $1.30 | 43d | 1 | 0.96mi |
| 2431 College Hills Blvd San Angelo, TX | 1.0–3.0 | 1.0–2.0 | 1025 | $1,609 | $1.57 | 21d | 17 | 1.29mi |
| 2802 Field St San Angelo, TX | 3.0 | 2.0 | 1384 | $1,600 | $1.16 | 43d | 1 | 1.40mi |
| 279 Glenna Dr San Angelo, TX | 3.0 | 2.0 | 1625 | $1,795 | $1.10 | 21d | 1 | 1.40mi |
Listing history 14 events
-
2026-06-10days on market $145,000 Active 112 DOM
-
2026-06-09days on market $145,000 Active 111 DOM
-
2026-06-08days on market $145,000 Active 110 DOM
-
2026-06-07days on market $145,000 Active 109 DOM
-
2026-06-02days on market $145,000 Active 104 DOM
-
2026-06-01days on market $145,000 Active 103 DOM
-
2026-05-31days on market $145,000 Active 102 DOM
-
2026-05-30days on market $145,000 Active 101 DOM
-
2026-04-22price $154,900 337-char remark
Show marketing remark (337 chars)
Motivated seller. Price reduced $5000. Very unique property. The home features 2 bedrooms and 2 baths with an attached 1 Bedroom, 1 Bath Efficiency apartment. Would be a great home for college students or Mother-in-law room. The 2 car carport and 1 car garage is a plus. Centrally located and a short distance to Angelo State University.
-
2026-03-30price $159,900 337-char remark
Show marketing remark (337 chars)
Motivated seller. Price reduced $5000. Very unique property. The home features 2 bedrooms and 2 baths with an attached 1 Bedroom, 1 Bath Efficiency apartment. Would be a great home for college students or Mother-in-law room. The 2 car carport and 1 car garage is a plus. Centrally located and a short distance to Angelo State University.
-
2026-03-17price $164,900 337-char remark
Show marketing remark (337 chars)
Motivated seller. Price reduced $5000. Very unique property. The home features 2 bedrooms and 2 baths with an attached 1 Bedroom, 1 Bath Efficiency apartment. Would be a great home for college students or Mother-in-law room. The 2 car carport and 1 car garage is a plus. Centrally located and a short distance to Angelo State University.
-
2026-02-19$169,900 Active 337-char remark
Show marketing remark (337 chars)
Motivated seller. Price reduced $5000. Very unique property. The home features 2 bedrooms and 2 baths with an attached 1 Bedroom, 1 Bath Efficiency apartment. Would be a great home for college students or Mother-in-law room. The 2 car carport and 1 car garage is a plus. Centrally located and a short distance to Angelo State University.
-
2026-01-15soldstatus
-
2014-06-19soldstatus
ⓘ Source: listings_history table (triggers on properties + properties_extension) + one-shot
backfill from property_details.listing_events for pre-trigger history.
Tax reassessment forecast TX · Resets to sale price
- Current annual tax
- $3,054 · $255/mo
- Projected year-2 tax
- $3,054 · $255/mo
- Expected delta
- $0/yr ($0/mo · 0.0%)
ⓘ Screening estimate from a state-policy table — verify with the county assessor before closing.
Climate risk First Street
- Flood 1/10 Low FEMA zone X (unshaded) · 0% chance over 30 yrs
- Wildfire 3/10 Moderate
- Heat 7/10 Severe 7 d/yr ≥104°F today · 23 d/yr by 30 yrs out
- Wind 4/10 Moderate 12% chance of damaging wind over 30 yrs
- Air quality 1/10 Low 0 unhealthy d/yr today · 0 by 30 yrs out
Nearby sold comps map
Loading sold comps map…
Walkable amenities ~0.75 mi
Loading nearby amenities…
Taxation est. · year 1
- Rental income
- $19,712
- − Mortgage interest
- −$8,122
- − Property taxes
- −$3,054
- − Insurance
- −$725
- − Repairs & maintenance
- −$1,577
- − Management
- −$1,577
- − Depreciation
- −$4,218
- Taxable income
- $438
- Est. tax owed @ 24.0%
- −$105
- After-tax cash flow
- $2,563/yr
For passive investors: Depreciation is non-cash, so a rental often shows a tax loss while cash-flowing — sheltering income. Rental losses are passive: they offset passive income freely, and up to $25,000/yr can offset ordinary (W-2) income if you actively participate and your MAGI is under $100k (phasing out to $0 by $150k); unused losses carry forward. On sale, claimed depreciation is recaptured at up to 25%, and gains may owe capital-gains tax (a 1031 exchange can defer both). Figures are a year-1 estimate at your 24.0% rate — not tax advice; consult a CPA.
Schools (NCES district)
- District
- San Angelo ISD
- NCES district ID
- 4838700
- Math proficiency
- 27% ▼ -9.00%
- Reading proficiency
- 33% ▼ -3.00%
- Median HH income
- $43,501
- Composite
- 25.56/100
- National rank
- #7427
- State rank
- #627 of 826 in TX
Livability — San Angelo
- Score
- 73/100
- State rank
- #199
- US rank
- #5030
Category grades
Schools grade is shown separately in the Schools card above.
Census & demographics
- Census place
- San Angelo, TX
- County
- Tom Green County · 113,188 people
- City population
- 81,357
- Metro
- San Angelo, TX
- Population (ZIP)
- 31,831
- Household income
- $69,450
- Rent vs Own
- Severe rent burden
- 1034.0
Population outlook (Tom Green County) Hauer SSP2
- Today (2025)
- 135,110 people
- By 2030
- 144,090 · +6.6%
- By 2040
- 162,561 · +20.3%
- By 2050
- 182,158 · +34.8%
- By 2075
- 232,274 · +71.9%
- By 2100
- 268,218 · +98.5%
Race, ethnicity, and origin ACS 2023
- Neighborhood character
- Majority White (55%)
- Race & ethnicity
- White 55% Hispanic / Latino 41% Two or more races 17% Black 2%
- Hispanic origin (detail)
- Mexican 38%
- Common ancestry
- Lithuanian 3% Slovak 3% Iranian 1%
- Foreign-born
- 5% · Canada
- Languages at home
- 77% English-only · Spanish 21% German/W. Germanic 1%
Political lean MEDSL · Tom Green
- 2024 margin
- Solid R (+48.0) · D 25.5% · R 73.5% · Other 1.0%
- 2008→2024 swing
- -6.3pp toward R · 2008: -41.7pp · 2024: -48.0pp
- All cycles
- 2024: R+48.0 2020: R+44.4 2016: R+47.9 2012: R+47.9 2008: R+41.7
Not yet ingested
- Civics
- —
Market trends
- HPI YoY
- ▲ 47.96%
- Current HPI
- 798.58
- Rent YoY
- ▲ 5.78%
- Metro
- San Angelo, TX
- State GDP YoY
- ▲ 3.95%
- F500 in state
- 110
Industry mix (Fortune 500 HQ in TX)
| Industry | F500 HQs | Revenue |
|---|---|---|
| Energy | 16 | $1,198B |
|
||
| Technology | 5 | $198B |
|
||
| Engineering / Construction | 4 | $72B |
|
||
| Energy Services | 3 | $60B |
|
||
| Utilities | 3 | $41B |
|
||
| Healthcare | 2 | $330B |
|
||
Price history
-8.8% since first listed6 events — show timeline
- 2026-04-22 Price Changed $154,900 SAAR TX
- 2026-03-30 Price Changed $159,900 SAAR TX
- 2026-03-17 Price Changed $164,900 SAAR TX
- 2026-02-19 Listed $169,900 SAAR TX
- 2026-01-15 Sold (Public Records) — Public Records
- 2014-06-19 Sold (Public Records) — Public Records
Property tax history
-0.5%/yrLatest (2025): $3,054 · +26.0% YoY. Source: county tax records.
Cash-flow waterfall
monthlySold comps — $/sqft
last 12 mo · ≤1 miLoading sold comps…