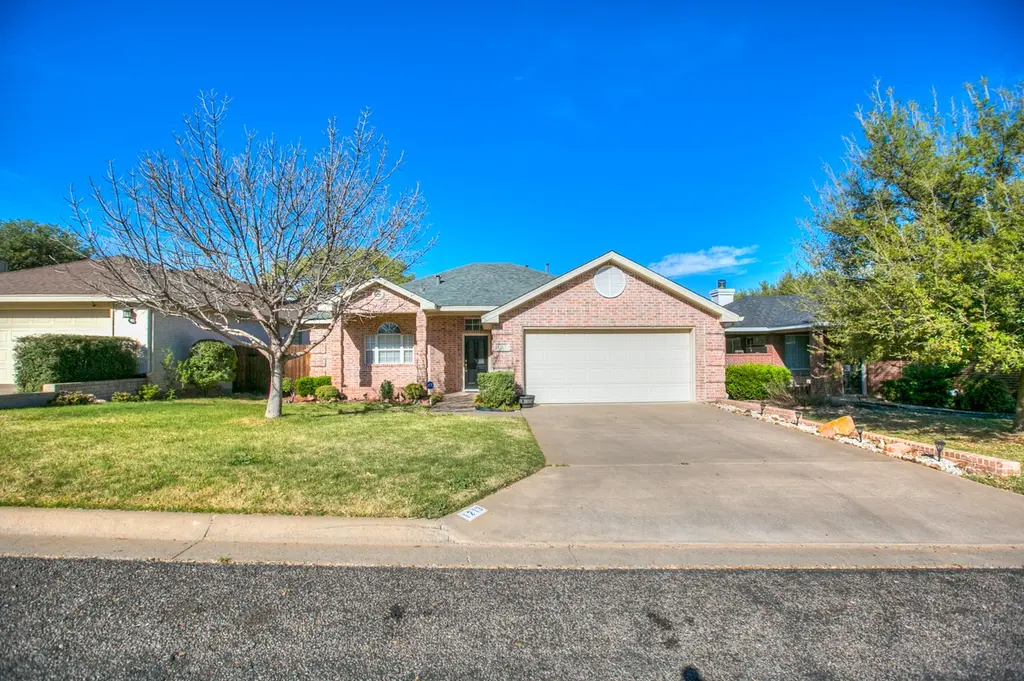
1213 Dorchester Dr · San Angelo, TX
Flood risk 1/10 · Minimal
- FEMA flood zone
- X (unshaded)
- Chance of flooding over 30 yrs
- 0.0%
- Est. flood insurance / yr
- $507 – $1,088
Fire risk 8/10 · Major
- Est. fire insurance / yr
- $1,222 – $2,270
Heat risk 7/10 · Major
- Hot days now (above 103°F)
- 7 days/yr
- Hot days in 30 yrs
- 23 days/yr
Wind risk 4/10 · Minor
- Chance of severe wind over 30 yrs
- 17.0%
Air-quality risk 2/10 · Minimal
- Unhealthy air days now
- 0 days/yr
- Unhealthy air days in 30 yrs
- 1 days/yr
Risk factors via First Street. Map © Google.
Why this score? — see what drove the D grade
The composite is a weighted blend of 9 inputs, each scored 0–100. Each bar is that input's sub-score; the figure is the points it added to the 100-point composite (weight × sub-score).
- ARV discount +11.8/15.0
- Appreciation +10.0/10.0
- Cash flow +6.2/30.0
- Rent growth +3.9/5.0
- Livability +3.7/5.0
- Schools +2.6/10.0
- Condition / age +2.5/5.0
- 1% rule +2.1/10.0
- DSCR +0.6/10.0
$307,000
🖨 Deal sheet (PDF) 📄 Offer letter ✓ Due diligence
Listing remarks
This beautifully maintained home in Upper Bluffs offers a perfect blend of comfort and style, ideal for discerning buyers. Featuring a spacious living and dining area, the open layout is perfect for both entertaining and everyday living. The large kitchen boasts abundant cabinetry and extra space for a cozy breakfast nook, making meal preparation and casual dining a pleasure. Enjoy the warmth and ambiance of a charming corner fireplace that adds character to the living space. The well-landscaped yard provides a serene outdoor retreat with a side patio and a second covered patio accessible directly from the primary bedroom, creating a private space to relax and unwind. The front and back yar
Key facts
- Cozy breakfast nook
- Second covered patio
- Well-landscaped yard
Tags
Neighborhood map
What this means for you Summary
Snapshot
- This is a 3-bed/2.0-bath single-family listed at $307k.
Deal economics
- At list price, monthly cash flow is $-554 ($-7k/yr) — negative.
- To cash-flow at today's rent, offer at most $209k (31.9% below list).
- To meet the 1% rule (rent ≥ 1% of price), the offer needs to be $218k (28.9% below list).
- Recommended offer: $209k (31.9% below list) — sets the bar for cash-flow.
Location & tenants
- Location reads 73/100 on livability (#199 in TX) — a middle-class / working-renter tenant base. Strengths: cost of living A+, housing A+, health & safety A+; Watch: employment C-, amenities F, commute F.
- San Angelo ISD (urban): math 27% / reading 33% proficiency, ranked #627 of 826 in TX (top 76%) — families likely to look elsewhere, expect single-tenant / working-renter base with shorter leases.
- Zoned schools: Bonham El (math 40% / reading 43%, grade F, #1,437 of 4,322 statewide, top 34%, 525 students, 40% FRL); Lone Star Middle (math 28% / reading 32%, grade F, #1,056 of 1,662 statewide, top 65%, 903 students, 63% FRL); Central H S (math 22% / reading 43%, grade F, #1,029 of 1,632 statewide, top 64%, 3,065 students, 48% FRL) — zoned schools at 50% FRL track the district average.
- Market conditions: Rents rising fast (+5.8%/yr); 331 active listings in the ZIP; 4 comparable units currently listed for rent nearby; rentals lingering (median 45d on market — plan ~5-8 weeks vacancy on turnover, expect pricing pressure); 50% of comp listings sitting > 30 days — soft ceiling on asking rent; 233 units permitted in Tom Green County in 2024 (0 in 5+ unit buildings).
- This rent runs 38% of the median local income ($69k/yr) — at the standard rent-burdened threshold; future hikes will face affordability resistance.
Forward outlook
- In year one you build about $33k of equity ($2k loan paydown + $31k appreciation (10.0% local appreciation)).
- Tom Green County population projected at +35% by 2050 — long-run rental-demand tailwind backs the buy-and-hold thesis.
- By year 2, paydown + projected appreciation supports a ~$53k cash-out refi (75% LTV) — recoverable capital for the next deal without selling this one.
Negotiation context
- It's been on market 27 days — a 2% lower offer ($302k) is reasonable based on typical stale-listing flexibility.
Risks & watch-outs
- Climate carrying-cost: severe wildfire risk; extreme-heat days projected 7→23/yr by 2055 (HVAC capex compounding) — expect insurance premiums to compound above CPI over the hold.
Questions for the listing agent
- What do current leases actually rent for vs. the listed asking? Can we see a recent rent roll and the last 12 months of T-12 income?
- Is there a deadline driving the sale (1031 exchange, divorce, estate, relocation)? That informs how much negotiation room exists.
- Schools are F-rated, which usually means shorter tenancies and higher turnover. Who's the typical renter profile here, and what's been the actual vacancy rate?
- The area grade is low — what's the realistic commute time and amenity access for the typical tenant pool here? Any planned neighborhood developments (good or bad) we should know about?
- What's the average days-on-market for RENTAL listings here right now (not sales)? A rising rental-DOM trend means longer vacancies and softer asking-rent achievability than the comps imply.
- What's the recent tenant-quality profile in this submarket — average credit score on applications, eviction rate, late-payment / NSF rate, and stable-employment percentage? A property-management company in the area should have these aggregated.
- How much new for-sale + rental construction is in the pipeline within 1–3 miles? Heavy new supply typically softens prices + rents 12–24 months out; constrained supply supports both.
Investment metrics
- 1% rule
- 0.71% ✗
- Cap rate
- 4.13%
- Cash-on-cash
- -7.74%
- DSCR
- 0.66
- GRM
- 11.7
CMA / ARV
- ARV (on-the-fly)
- $339,624
- Comps found
- 12
Show comp detail 12 sales within ~0.75 mi
| Address | Dist | Beds/Ba | Sqft | Sold | Price | $/sf | Match |
|---|---|---|---|---|---|---|---|
| 1213 Dorchester Dr | 0.00mi | 3/2.0 | 1,908 (0%) | 1mo | $307,000 | $161 | 99 |
| 1217 Dorchester Dr | 0.02mi | 3/2.0 | 1,950 (+2%) | 10mo | $319,000 | $164 | 87 |
| 1221 Avondale Ave | 0.08mi | 3/2.0 | 2,106 (+10%) | 2mo | $385,000 | $183 | 77 |
| 1118 Hunters Glen Rd | 0.42mi | 3/2.0 | 1,892 (-1%) | 8mo | $355,000 | $188 | 72 |
| 5801 Barrington Ct | 0.43mi | 3/2.0 | 1,976 (+4%) | 8mo | $350,000 | $177 | 67 |
| 6021 Melrose Ave | 0.38mi | 3/2.0 | 2,116 (+11%) | 1mo | $385,000 | $182 | 63 |
| 1113 Windemere Cir | 0.47mi | 4/2.0 (+1) | 1,879 (-2%) | 10mo | $345,000 | $184 | 62 |
| 701 Durham Ct | 0.67mi | 3/2.0 | 1,780 (-7%) | 2mo | $308,900 | $174 | 56 |
| 5821 Davenport Dr | 0.51mi | 4/3.0 (+1) | 1,767 (-7%) | 4mo | $284,500 | $161 | 52 |
| 6018 Warwick Dr | 0.43mi | 4/2.0 (+1) | 2,112 (+11%) | 12mo | $375,000 | $178 | 47 |
| 5829 Normandy Ln | 0.57mi | 3/2.0 | 1,624 (-15%) | 3mo | $249,900 | $154 | 46 |
| 702 Hunters Glen Rd | 0.67mi | 4/2.5 (+1) | 2,020 (+6%) | 12mo | $375,000 | $186 | 42 |
Match score weights: distance 35% · size 25% · config 20% · recency 20%. Top-matched comps best support the ARV.
Projected returns pro-forma
10.0% appreciation · 5.78% rent growth · sell at horizon
- IRR
- 19.6%
- Equity multiple
- 2.61×
- Total profit
- $138,290
- Equity at exit
- $276,570
- IRR
- 18.6%
- Equity multiple
- 6.23×
- Total profit
- $449,502
- Equity at exit
- $596,433
Cash invested: $85,960 (down + closing). Projections, not guarantees.
Landlord ↔ Tenant lean methodology
- Overall (STATE)
- 87 Strongly Landlord-Friendly
- State Texas
- 87 Strongly Landlord-Friendly · R+5
- County
- — inherits STATE
- City
- — inherits STATE
ZIP-level market 76901
- Home prices YoY
- 6.4%
- Rents YoY
- 5.8%
- Active inventory
- 331
- Price-to-rent
- 11.7×
Monthly cashflow live
- Estimated rent
- $2,181 medium interval (Pro) →
- Mortgage (P&I)
- −$1,610
- Tax from tax record
- −$540 /mo · $6,477/yr
- Insurance
- −$128
- HOA
- −$0
- Vacancy / Maint / Mgmt
- −$458
- Net cashflow
- $-554
Break-even live
Sensitivity live
| Price | -10% $-381 | -5% $-468 | +0% $-554 | +5% $-641 | +10% $-728 |
|---|---|---|---|---|---|
| Rent | -10% $-727 | -5% $-641 | +0% $-554 | +5% $-468 | +10% $-382 |
| Rate | -1.0pp $-400 | -0.5pp $-476 | base $-554 | +0.5pp $-634 | +1.0pp $-715 |
UW: 25.0% down · 7.5% · 30yr · 1.5% tax · 5.0% vac · 8.0% maint · 8.0% mgmt
Financing live
Cash to close
- Down payment
- $76,750
- Closing costs
- $9,210
- Reserves months
- —
- Total cash needed
- —
Loan-product check · same deal, 3 products live
Conventional
25% down · 7.5% · 30yr
- Down + closing
- —
- Monthly P&I
- —
- Monthly cashflow
- —
- DSCR
- —
- Eligible?
- —
Personal DTI + credit; lowest rate.
DSCR
20% down · 8.5% · 30yr
- Down + closing
- —
- Monthly P&I
- —
- Monthly cashflow
- —
- DSCR
- —
- Eligible?
- —
No personal income docs; deal must DSCR.
Hard money
10% down · 12.0% · 12mo
- Down + closing
- —
- Monthly P&I
- —
- Monthly cashflow
- —
- DSCR
- —
- Eligible?
- —
Short-term bridge; refi at stabilization.
Rent comps 4 comps
| Address | Beds | Baths | Sqft | Rent | $/sqft | DOM | Units | Dist |
|---|---|---|---|---|---|---|---|---|
| 707 Wicklow Ct San Angelo, TX | 3.0 | 2.0 | 1576 | $2,000 | $1.27 | 44d | 1 | 0.79mi |
| 5921 Stratford Ave San Angelo, TX | 3.0 | 2.0 | 1738 | $2,400 | $1.38 | 22d | 1 | 0.85mi |
| 5706 Stratford Ct San Angelo, TX | 4.0 | 2.0 | 1742 | $2,800 | $1.61 | 44d | 1 | 0.91mi |
| 5910 Southampton Pl San Angelo, TX | 3.0 | 2.0 | 1596 | $2,100 | $1.32 | 22d | 1 | 0.96mi |
Listing history 5 events
-
2026-04-20status Pending
-
2026-04-07price $307,000
-
2026-03-24$312,500 Active
-
2017-05-02soldstatus
-
2005-07-01soldstatus
ⓘ Source: listings_history table (triggers on properties + properties_extension) + one-shot
backfill from property_details.listing_events for pre-trigger history.
Tax reassessment forecast TX · Resets to sale price
- Current annual tax
- $6,477 · $540/mo
- Projected year-2 tax
- $6,477 · $540/mo
- Expected delta
- $0/yr ($0/mo · 0.0%)
ⓘ Screening estimate from a state-policy table — verify with the county assessor before closing.
Climate risk First Street
- Flood 1/10 Low FEMA zone X (unshaded) · 0% chance over 30 yrs
- Wildfire 8/10 Severe
- Heat 7/10 Severe 7 d/yr ≥103°F today · 23 d/yr by 30 yrs out
- Wind 4/10 Moderate 17% chance of damaging wind over 30 yrs
- Air quality 2/10 Low 0 unhealthy d/yr today · 1 by 30 yrs out
Nearby sold comps map
Loading sold comps map…
Walkable amenities ~0.75 mi
Loading nearby amenities…
Taxation est. · year 1
- Rental income
- $26,175
- − Mortgage interest
- −$17,197
- − Property taxes
- −$6,477
- − Insurance
- −$1,535
- − Repairs & maintenance
- −$2,094
- − Management
- −$2,094
- − Depreciation
- −$8,931
- Taxable loss
- −$12,152
- Est. tax savings @ 24.0%
- +$2,917
- After-tax cash flow
- $-3,736/yr
For passive investors: Depreciation is non-cash, so a rental often shows a tax loss while cash-flowing — sheltering income. Rental losses are passive: they offset passive income freely, and up to $25,000/yr can offset ordinary (W-2) income if you actively participate and your MAGI is under $100k (phasing out to $0 by $150k); unused losses carry forward. On sale, claimed depreciation is recaptured at up to 25%, and gains may owe capital-gains tax (a 1031 exchange can defer both). Figures are a year-1 estimate at your 24.0% rate — not tax advice; consult a CPA.
Schools (NCES district)
- District
- San Angelo ISD
- NCES district ID
- 4838700
- Math proficiency
- 27% ▼ -9.00%
- Reading proficiency
- 33% ▼ -3.00%
- Median HH income
- $43,501
- Composite
- 25.56/100
- National rank
- #7427
- State rank
- #627 of 826 in TX
Livability — San Angelo
- Score
- 73/100
- State rank
- #199
- US rank
- #5030
Category grades
Schools grade is shown separately in the Schools card above.
Census & demographics
- Census place
- San Angelo, TX
- County
- Tom Green County · 113,188 people
- City population
- 81,357
- Metro
- San Angelo, TX
- Population (ZIP)
- 31,831
- Household income
- $69,450
- Rent vs Own
- Severe rent burden
- 1034.0
Population outlook (Tom Green County) Hauer SSP2
- Today (2025)
- 135,110 people
- By 2030
- 144,090 · +6.6%
- By 2040
- 162,561 · +20.3%
- By 2050
- 182,158 · +34.8%
- By 2075
- 232,274 · +71.9%
- By 2100
- 268,218 · +98.5%
Race, ethnicity, and origin ACS 2023
- Neighborhood character
- Majority White (55%)
- Race & ethnicity
- White 55% Hispanic / Latino 41% Two or more races 17% Black 2%
- Hispanic origin (detail)
- Mexican 38%
- Common ancestry
- Lithuanian 3% Slovak 3% Iranian 1%
- Foreign-born
- 5% · Canada
- Languages at home
- 77% English-only · Spanish 21% German/W. Germanic 1%
Political lean MEDSL · Tom Green
- 2024 margin
- Solid R (+48.0) · D 25.5% · R 73.5% · Other 1.0%
- 2008→2024 swing
- -6.3pp toward R · 2008: -41.7pp · 2024: -48.0pp
- All cycles
- 2024: R+48.0 2020: R+44.4 2016: R+47.9 2012: R+47.9 2008: R+41.7
Not yet ingested
- Civics
- —
Market trends
- HPI YoY
- ▲ 47.96%
- Current HPI
- 798.58
- Rent YoY
- ▲ 5.78%
- Metro
- San Angelo, TX
- State GDP YoY
- ▲ 3.95%
- F500 in state
- 110
Industry mix (Fortune 500 HQ in TX)
| Industry | F500 HQs | Revenue |
|---|---|---|
| Energy | 16 | $1,198B |
|
||
| Technology | 5 | $198B |
|
||
| Engineering / Construction | 4 | $72B |
|
||
| Energy Services | 3 | $60B |
|
||
| Utilities | 3 | $41B |
|
||
| Healthcare | 2 | $330B |
|
||
Price history
-1.8% since first listed5 events — show timeline
- 2026-04-20 Pending — SAAR TX
- 2026-04-07 Price Changed $307,000 SAAR TX
- 2026-03-24 Listed $312,500 SAAR TX
- 2017-05-02 Sold (Public Records) — Public Records
- 2005-07-01 Sold (Public Records) — Public Records
Property tax history
+2.7%/yrLatest (2025): $6,477 · +14.5% YoY. Source: county tax records.
Cash-flow waterfall
monthlySold comps — $/sqft
last 12 mo · ≤1 miLoading sold comps…