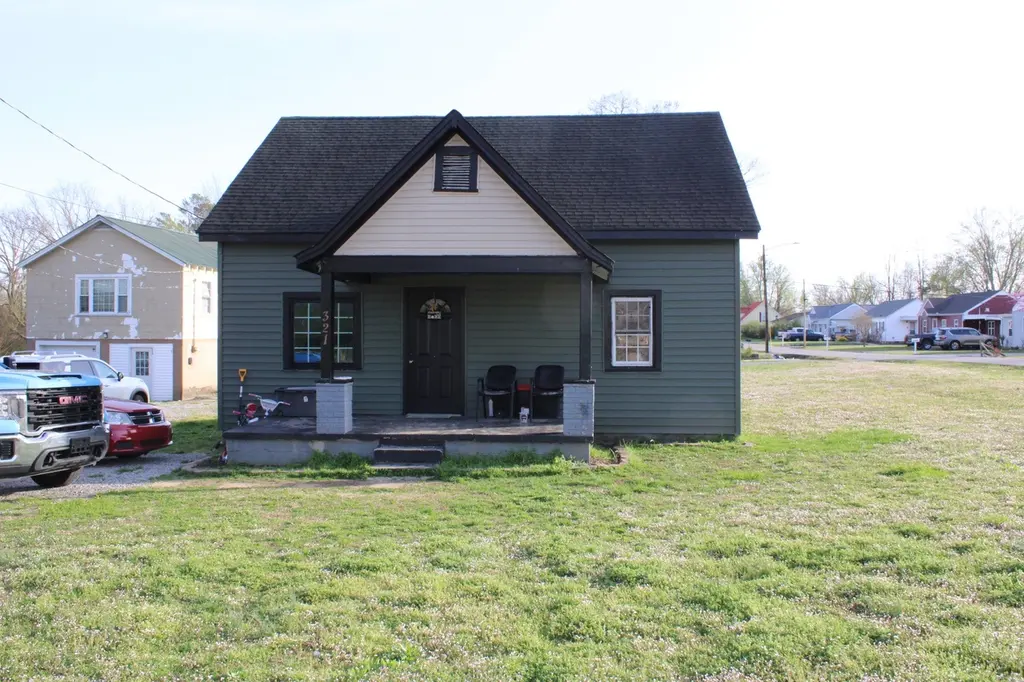
321 W Short St · Manchester, TN
Flood risk 1/10 · Minimal
- FEMA flood zone
- X (unshaded)
- Chance of flooding over 30 yrs
- 0.0%
- Est. flood insurance / yr
- $507 – $1,088
Fire risk 4/10 · Minor
- Est. fire insurance / yr
- $949 – $1,763
Heat risk 5/10 · Moderate
- Hot days now (above 103°F)
- 7 days/yr
- Hot days in 30 yrs
- 20 days/yr
Wind risk 4/10 · Minor
- Chance of severe wind over 30 yrs
- 10.0%
Air-quality risk 2/10 · Minimal
- Unhealthy air days now
- 1 days/yr
- Unhealthy air days in 30 yrs
- 2 days/yr
Risk factors via First Street. Map © Google.
Why this score? — see what drove the C grade
The composite is a weighted blend of 9 inputs, each scored 0–100. Each bar is that input's sub-score; the figure is the points it added to the 100-point composite (weight × sub-score).
- Cash flow +22.2/30.0
- ARV discount +15.0/15.0
- DSCR +7.1/10.0
- 1% rule +4.6/10.0
- Livability +2.9/5.0
- Rent growth +2.5/5.0
- Schools +2.5/10.0
- Condition / age +2.5/5.0
- Appreciation +0.0/10.0
$175,000
🖨 Deal sheet 📄 Offer letter ✓ Due diligence
Listing remarks
Investment opportunity! two rental units on one property. The house and an apartment over a detached garage are currently rented. Large corner lot, perfect for apartments with rezoning. This property will not finance FHA, VA, USDA, or most secondary market loans. Selling AS-IS
Key facts
- Large corner lot
- Two rental units
- Detached garage
Tags
Property features AI
Finance
- Other: Property type: Residential; Sub-type: Single Family Residence; Lot size about 0.56 acres; Directions: From Manchester square take W Main St. to left on Oakdale, then right on W Short St., property is on the left.
Exterior
- Parking: Detached garage (1 covered space; 1 total garage space); Gravel parking
- Utilities: Public water; Public sewer; Electricity available; Natural gas available; Water available
- Home design: Single-family residence; One story
- Construction: Frame construction with vinyl siding; Shingle roof; Block foundation; Existing year built; Living area approximately 924 square feet
- Exterior features: Level lot; Lot dimensions approximately 116.63 x 200
Interior
- Kitchen: Kitchen 10 x 8; No appliances included
- Bedrooms: 3 bedrooms total (1 on main level); Bedroom sizes: 13 x 13; 10 x 11; 14 x 8; Den 20 x 11; Living room 18 x 15
- Flooring: Vinyl flooring; Other flooring
- Bathrooms: 1 full bathroom
- Heating & cooling: Baseboard heating (natural gas); Cooling via electric wall/window unit(s)
- Interior features: Crawl space basement; Other and vinyl flooring
- Laundry & utility: Washer hookup; Electric dryer hookup
Neighborhood map
What this means for you Summary
Snapshot
- This is a 3-bed/1.0-bath single-family listed at $175k.
Deal economics
- At list price, monthly cash flow is $286 ($3k/yr) — positive.
- The deal already cash-flows at list — no discount required.
- To meet the 1% rule (rent ≥ 1% of price), the offer needs to be $169k (3.7% below list).
- Recommended offer: $159k (9.0% below list) — sets the bar for market timing.
- Cap rate 8.3% vs local median 3.1% in Manchester — top-decile yield for the area; either an underpriced asset or a hidden risk that comps aren't pricing in. Stress-test before assuming the spread holds.
Location & tenants
- Location reads 58/100 on livability (#305 in TN) — a working-class tenant base; expect higher turnover. Strengths: cost of living A+, housing A+; Watch: crime F, amenities F, commute F.
- Manchester (town): math 31% / reading 29% proficiency, ranked #61 of 139 in TN (top 44%) — families likely to look elsewhere, expect single-tenant / working-renter base with shorter leases.
- Zoned schools: Westwood Elementary (math 38% / reading 29%, grade F, #354 of 952 statewide, top 38%, 574 students, 0% FRL) — zoned schools average 0% FRL vs 52% district-wide (52 pts lower); this property's tenant base skews higher-income than the district average.
- Market conditions: 206 active listings in the ZIP; 3 comparable units currently listed for rent nearby; rentals lingering (median 44d on market — plan ~5-8 weeks vacancy on turnover, expect pricing pressure); 100% of comp listings sitting > 30 days — soft ceiling on asking rent; 389 units permitted in Coffee County in 2024 (6 in 5+ unit buildings).
- This rent runs 32% of the median local income ($63k/yr) — at the standard rent-burdened threshold; future hikes will face affordability resistance.
Forward outlook
- Local home prices are declining (-3.0%/yr); year-one equity from $1k of loan paydown is wiped out by about $5k of value loss. Plan a longer hold.
- Coffee County population projected at +9% by 2050 — modest demand growth; plan on rents tracking national, not racing it.
Negotiation context
- It's been on market 97 days — a 9% lower offer ($159k) is reasonable based on typical stale-listing flexibility.
- 2 sale attempts with the ask held roughly flat each time — persistent listings suggest the price (not the market) is what's stuck; bring a comps-based counter.
- Current owner paid $50k; list at $175k implies a 250% gain — meaningful room to come down on a strong offer.
Risks & watch-outs
- Watch-outs: built in 1938 — expect roof / HVAC / electrical / plumbing capex.
- Climate carrying-cost: extreme-heat days projected 7→20/yr by 2055 (HVAC capex compounding) — expect insurance premiums to compound above CPI over the hold.
Questions for the listing agent
- It's been on market 97 days. Have you received any prior offers? Is the seller open to a 9% concession, seller financing, or rate buy-down credit?
- Built in 1938 — when were the roof, HVAC, electrical panel, plumbing, and water heater last replaced?
- Why hasn't it sold? Are there any deal-killer items the seller is aware of (foundation, flood, title, zoning, code violations)?
- Is there a deadline driving the sale (1031 exchange, divorce, estate, relocation)? That informs how much negotiation room exists.
- Schools are F-rated, which usually means shorter tenancies and higher turnover. Who's the typical renter profile here, and what's been the actual vacancy rate?
- Crime grade is F in this area — have there been break-ins, vandalism, or insurance claims at this property in the last 3 years? What carrier currently insures it and at what premium?
- What's the average days-on-market for RENTAL listings here right now (not sales)? A rising rental-DOM trend means longer vacancies and softer asking-rent achievability than the comps imply.
- What's the recent tenant-quality profile in this submarket — average credit score on applications, eviction rate, late-payment / NSF rate, and stable-employment percentage? A property-management company in the area should have these aggregated.
- How much new for-sale + rental construction is in the pipeline within 1–3 miles? Heavy new supply typically softens prices + rents 12–24 months out; constrained supply supports both.
Investment metrics
- 1% rule
- 0.96% ✗
- Cap rate
- 8.26%
- Cash-on-cash
- 7.01%
- DSCR
- 1.31
- GRM
- 8.7
CMA / ARV
- ARV (on-the-fly)
- $269,276
- Comps found
- 11
Show comp detail 11 sales within ~0.75 mi
| Address | Dist | Beds/Ba | Sqft | Sold | Price | $/sf | Match |
|---|---|---|---|---|---|---|---|
| 303 Willow St | 0.11mi | 3/2.0 | 1,838 (+11%) | 4mo | $224,000 | $122 | 68 |
| 408 W High St | 0.55mi | 3/2.5 | 1,685 (+2%) | 0mo | $210,000 | $125 | 65 |
| 512 W High St | 0.56mi | 3/2.5 | 1,680 (+2%) | 8mo | $160,000 | $95 | 59 |
| 615 Riverside Dr | 0.26mi | 3/2.0 | 1,472 (-11%) | 13mo | $275,000 | $187 | 54 |
| 510 Noel Ave | 0.10mi | 2/1.0 (-1) | 1,405 (-15%) | 15mo | $229,000 | $163 | 53 |
| 503 S Ramsey St | 0.48mi | 3/1.0 | 1,404 (-15%) | 5mo | $203,000 | $145 | 49 |
| 902 Mcarthur St | 0.68mi | 3/2.0 | 1,520 (-8%) | 5mo | $190,000 | $125 | 47 |
| 25 Stonehenge | 0.73mi | 4/2.5 (+1) | 1,670 (+1%) | 10mo | $325,000 | $195 | 45 |
| 1104 Remington Pl | 0.62mi | 3/2.5 | 1,779 (+8%) | 14mo | $329,000 | $185 | 41 |
| 1011 S Spring St | 0.71mi | 3/2.0 | 1,444 (-13%) | 2mo | $235,000 | $163 | 40 |
| 1008 S Spring St | 0.68mi | 2/2.0 (-1) | 1,512 (-8%) | 17mo | $260,000 | $172 | 31 |
Match score weights: distance 35% · size 25% · config 20% · recency 20%. Top-matched comps best support the ARV.
Projected returns pro-forma
-3.0% appreciation · 3.0% rent growth · sell at horizon
- IRR
- -5.6%
- Equity multiple
- 0.79×
- Total profit
- $-10,199
- Equity at exit
- $26,093
- IRR
- 4.0%
- Equity multiple
- 1.29×
- Total profit
- $14,292
- Equity at exit
- $15,131
Cash invested: $49,000 (down + closing). Projections, not guarantees.
Landlord ↔ Tenant lean methodology
- Overall (STATE)
- 87 Strongly Landlord-Friendly
- State Tennessee
- 87 Strongly Landlord-Friendly · R+13
- County
- — inherits STATE
- City
- — inherits STATE
ZIP-level market 37355
- Home prices YoY
- -7.5%
- Active inventory
- 206
- Price-to-rent
- 8.7×
Monthly cashflow live
- Estimated rent
- $1,685 medium interval (Pro) →
- Mortgage (P&I)
- −$918
- Tax from tax record
- −$54 /mo · $653/yr
- Insurance
- −$73
- HOA
- −$0
- Vacancy / Maint / Mgmt
- −$354
- Net cashflow
- $286
Break-even live
UW: 25.0% down · 7.5% · 30yr · 1.5% tax · 5.0% vac · 8.0% maint · 8.0% mgmt
Financing live
Cash to close
- Down payment
- $43,750
- Closing costs
- $5,250
- Reserves months
- —
- Total cash needed
- —
Loan-product check · same deal, 3 products live
Conventional
25% down · 7.5% · 30yr
- Down + closing
- —
- Monthly P&I
- —
- Monthly cashflow
- —
- DSCR
- —
- Eligible?
- —
Personal DTI + credit; lowest rate.
DSCR
20% down · 8.5% · 30yr
- Down + closing
- —
- Monthly P&I
- —
- Monthly cashflow
- —
- DSCR
- —
- Eligible?
- —
No personal income docs; deal must DSCR.
Hard money
10% down · 12.0% · 12mo
- Down + closing
- —
- Monthly P&I
- —
- Monthly cashflow
- —
- DSCR
- —
- Eligible?
- —
Short-term bridge; refi at stabilization.
Rent comps 3 comps
| Address | Beds | Baths | Sqft | Rent | $/sqft | DOM | Units | Dist |
|---|---|---|---|---|---|---|---|---|
| 504 Casey St Manchester, TN | 3.0 | 1.0 | 1131 | $1,350 | $1.19 | 43d | 1 | 0.19mi |
| 1508 Bartlett Dr Manchester, TN | 3.0 | 2.5 | 1360 | $1,950 | $1.43 | 43d | 1 | 1.26mi |
| 296 Hunt St Manchester, TN | 2.0 | 2.0 | 1400 | $1,490 | $1.06 | 43d | 1 | 1.31mi |
Listing history 21 events
-
2026-06-19days on market $175,000 Active 97 DOM
-
2026-06-18days on market $175,000 Active 96 DOM
-
2026-06-17days on market $175,000 Active 95 DOM
-
2026-06-16days on market $175,000 Active 94 DOM
-
2026-06-15days on market $175,000 Active 93 DOM
-
2026-06-14days on market $175,000 Active 91 DOM
-
2026-06-13days on market $175,000 Active 90 DOM
-
2026-06-10days on market $175,000 Active 88 DOM
-
2026-06-09days on market $175,000 Active 87 DOM
-
2026-06-08days on market $175,000 Active 86 DOM
-
2026-06-07days on market $175,000 Active 85 DOM
-
2026-06-03days on market $175,000 Active 81 DOM
-
2026-06-02days on market $175,000 Active 80 DOM
-
2026-06-01days on market $175,000 Active 79 DOM
-
2026-05-31days on market $175,000 Active 78 DOM
-
2026-05-30days on market $175,000 Active 77 DOM
-
2026-05-14status Active
-
2026-04-23historical Active Under Contract
-
2026-03-14$175,000 Active
-
2008-11-26soldstatus $50,000
-
2007-10-30soldstatus $50,000
ⓘ Source: listings_history table (triggers on properties + properties_extension) + one-shot
backfill from property_details.listing_events for pre-trigger history.
Tax reassessment forecast TN · Resets to sale price
- Current annual tax
- $653 · $54/mo
- Projected year-2 tax
- $1,242 · $104/mo
- Expected delta
- +$590/yr (+$49/mo · 90.3%)
ⓘ Screening estimate from a state-policy table — verify with the county assessor before closing.
Climate risk First Street
- Flood 1/10 Low FEMA zone X (unshaded) · 0% chance over 30 yrs
- Wildfire 4/10 Moderate
- Heat 5/10 Major 7 d/yr ≥103°F today · 20 d/yr by 30 yrs out
- Wind 4/10 Moderate 10% chance of damaging wind over 30 yrs
- Air quality 2/10 Low 1 unhealthy d/yr today · 2 by 30 yrs out
Nearby sold comps map
Loading sold comps map…
Walkable amenities ~0.75 mi
Loading nearby amenities…
Taxation est. · year 1
- Rental income
- $20,223
- − Mortgage interest
- −$9,803
- − Property taxes
- −$653
- − Insurance
- −$875
- − Repairs & maintenance
- −$1,618
- − Management
- −$1,618
- − Depreciation
- −$5,091
- Taxable income
- $566
- Est. tax owed @ 24.0%
- −$136
- After-tax cash flow
- $3,300/yr
For passive investors: Depreciation is non-cash, so a rental often shows a tax loss while cash-flowing — sheltering income. Rental losses are passive: they offset passive income freely, and up to $25,000/yr can offset ordinary (W-2) income if you actively participate and your MAGI is under $100k (phasing out to $0 by $150k); unused losses carry forward. On sale, claimed depreciation is recaptured at up to 25%, and gains may owe capital-gains tax (a 1031 exchange can defer both). Figures are a year-1 estimate at your 24.0% rate — not tax advice; consult a CPA.
Schools (NCES district)
- District
- Manchester
- NCES district ID
- 4702610
- Math proficiency
- 31% ▼ -4.00%
- Reading proficiency
- 29% ▼ -5.00%
- Median HH income
- $41,102
- Composite
- 25.37/100
- National rank
- #7472
- State rank
- #61 of 139 in TN
Livability — Manchester
- Score
- 58/100
- State rank
- #305
- US rank
- #20837
Category grades
Schools grade is shown separately in the Schools card above.
Census & demographics
- Census place
- Manchester, TN
- County
- Coffee County · 57,744 people
- City population
- 29,805
- Metro
- Tullahoma-Manchester, TN
- Population (ZIP)
- 29,805
- Household income
- $63,357
- Rent vs Own
- Severe rent burden
- 401.0
Population outlook (Coffee County) Hauer SSP2
- Today (2025)
- 57,234 people
- By 2030
- 58,571 · +2.3%
- By 2040
- 60,972 · +6.5%
- By 2050
- 62,537 · +9.3%
- By 2075
- 65,694 · +14.8%
- By 2100
- 63,355 · +10.7%
Race, ethnicity, and origin ACS 2023
- Neighborhood character
- Predominantly White (86%)
- Race & ethnicity
- White 86% Hispanic / Latino 7% Two or more races 5% Black 3% Asian 1%
- Hispanic origin (detail)
- Mexican 4%
- Common ancestry
- Lithuanian 1% Romanian 1% Italian 1%
- Foreign-born
- 4% · Canada
- Languages at home
- 94% English-only · Spanish 4% Other Asian/Pacific 1%
Political lean MEDSL · Coffee
- 2024 margin
- Solid R (+55.1) · D 21.8% · R 76.9% · Other 1.3%
- 2008→2024 swing
- -25.7pp toward R · 2008: -29.4pp · 2024: -55.1pp
- All cycles
- 2024: R+55.1 2020: R+50.2 2016: R+48.6 2012: R+37.1 2008: R+29.4
Not yet ingested
- Civics
- —
Market trends
- HPI YoY
- ▼ -27.43%
- Current HPI
- 336.5317
- Rent YoY
- —
- Metro
- Tullahoma-Manchester, TN
- State GDP YoY
- ▲ 2.78%
- F500 in state
- 22
Industry mix (Fortune 500 HQ in TN)
| Industry | F500 HQs | Revenue |
|---|---|---|
| Healthcare | 3 | $91B |
|
||
| Retail | 3 | $72B |
|
||
| Transportation / Logistics | 1 | $88B |
|
||
| Paper / Packaging | 1 | $19B |
|
||
| Insurance | 1 | $13B |
|
||
| Energy | 1 | $12B |
|
||
Price history
+250.0% since first listed5 events — show timeline
- 2026-05-14 Relisted — REALTRACS as Distributed by MLS Grid
- 2026-04-23 Contingent — REALTRACS as Distributed by MLS Grid
- 2026-03-14 Listed $175,000 REALTRACS as Distributed by MLS Grid
- 2008-11-26 Sold (Public Records) $50,000 Public Records
- 2007-10-30 Sold (Public Records) $50,000 Public Records
Property tax history
-1.0%/yrLatest (2025): $653 · -6.3% YoY. Source: county tax records.
Cash-flow waterfall
monthlySold comps — $/sqft
last 12 mo · ≤1 miLoading sold comps…